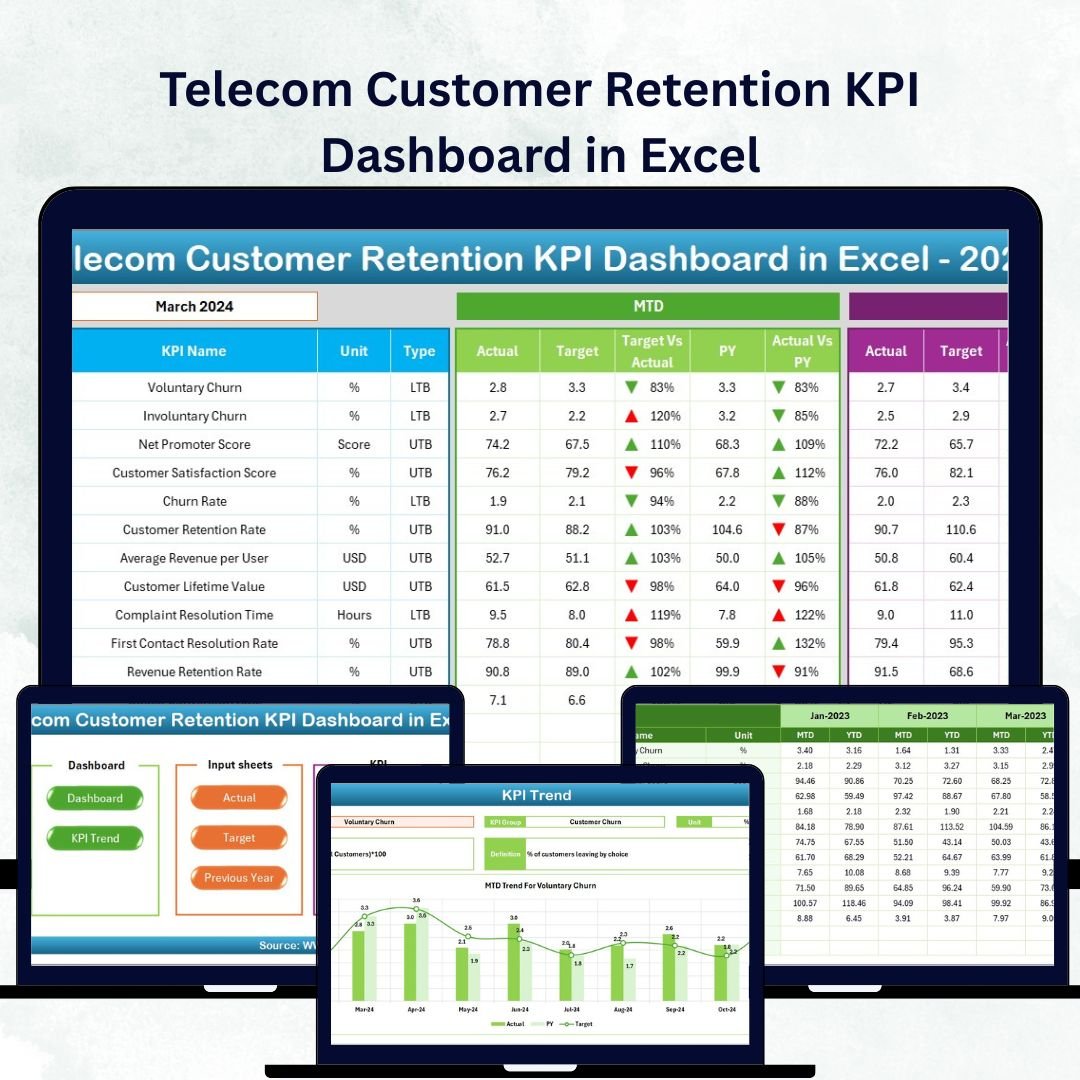
In today’s hyper-competitive telecom landscape, retaining customers is more cost-effective than acquiring new ones. 📊 The Telecom Customer Retention KPI Dashboard in Excel is your one-stop solution to monitor, analyze, and improve customer loyalty, satisfaction, and churn performance—all from a single interactive Excel file.
This powerful yet easy-to-use dashboard empowers telecom professionals to make data-driven decisions that boost customer retention and long-term profitability. Built entirely in Microsoft Excel, it eliminates the need for complex tools or coding knowledge, making it ideal for telecom teams of all sizes.Telecom Customer Retention KPI Dashboard in Excel
💡 Key Features of the Telecom Customer Retention KPI Dashboard
✨ Interactive Excel Dashboard:
Analyze customer retention KPIs like churn rate, loyalty index, and satisfaction levels through interactive visuals and dropdowns.
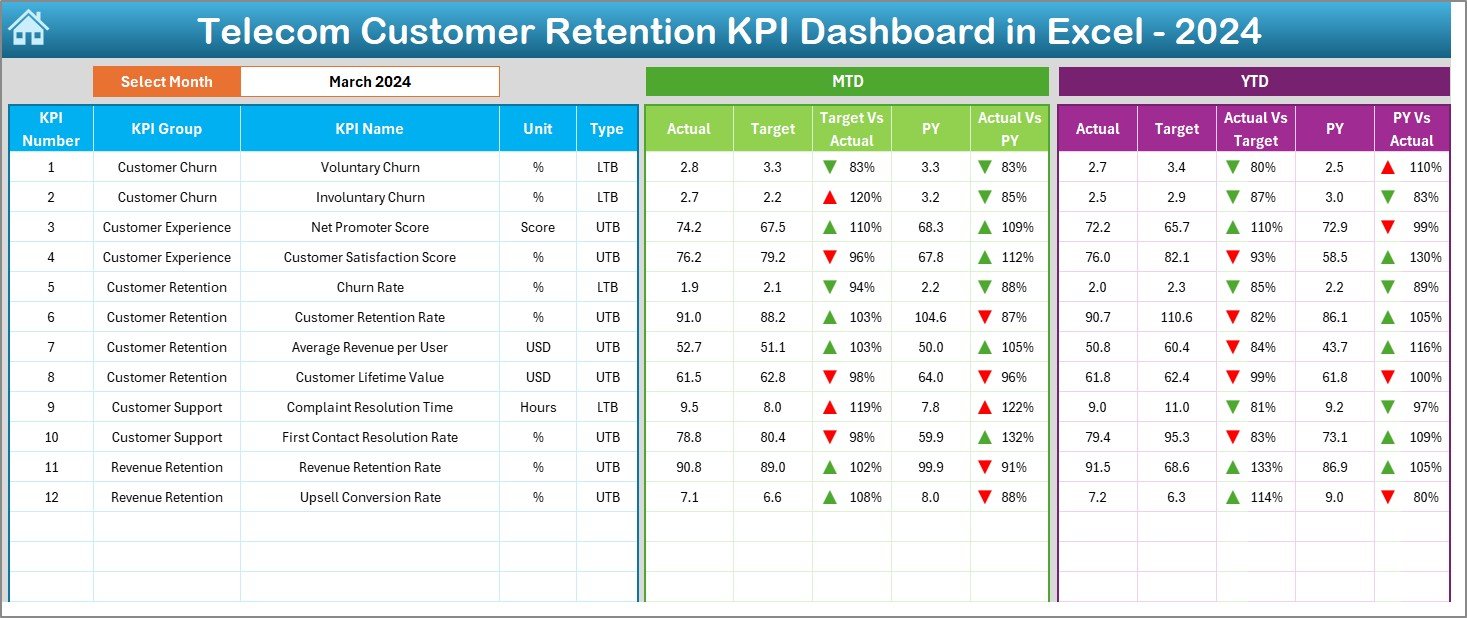
📅 MTD & YTD Insights:
Track Month-to-Date and Year-to-Date progress for each KPI to stay aligned with monthly and annual goals.
📈 Target vs Actual Comparison:
Compare performance against targets and previous year values using visual up/down arrows and conditional formatting.
🎯 Dynamic Data Updates:
Change the month from a dropdown, and watch all visuals update instantly across the dashboard.
🧩 Automated Sheets:
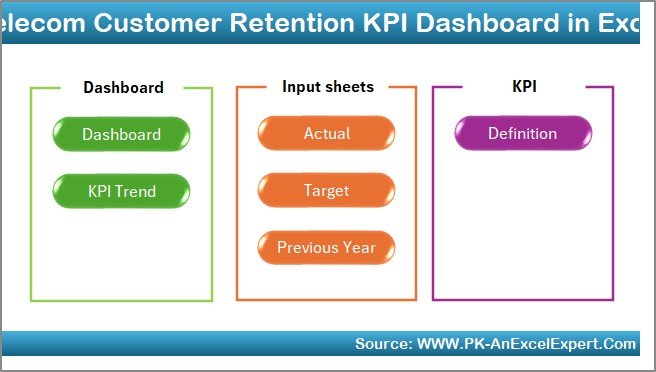
Seven organized sheets — Home, Dashboard, KPI Trend, Actual Numbers, Target, Previous Year, and KPI Definition — simplify tracking and analysis.Telecom Customer Retention KPI Dashboard in Excel
🧠 No Coding Required:
Everything runs on Excel’s built-in formulas, charts, and logic, ensuring smooth usability for all professionals.
📘 What’s Inside the Telecom Customer Retention KPI Dashboard
This Excel-based dashboard includes seven structured sheets, each designed for simplicity and accuracy:
1️⃣ Home Sheet: The navigation hub with six easy buttons to jump directly between sheets — Dashboard, KPI Trend, Target, and more.Telecom Customer Retention KPI Dashboard in Excel
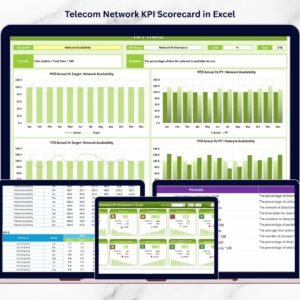
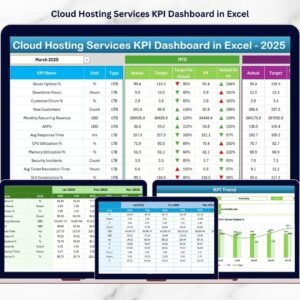
2️⃣ Dashboard Sheet: Displays all key metrics visually. Select any month from cell D3, and all charts refresh automatically to show updated performance.
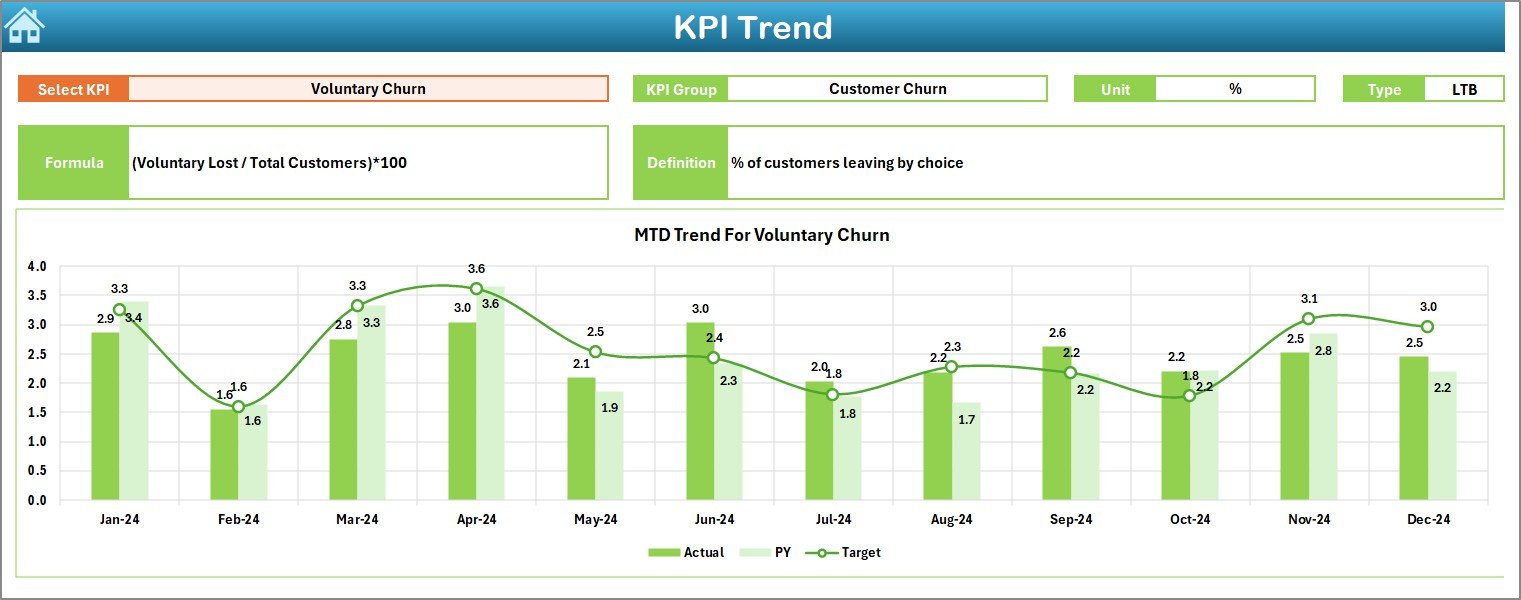
3️⃣ KPI Trend Sheet: View how each KPI performs over time. Select any KPI name to see MTD & YTD trends, targets, and previous year comparisons.
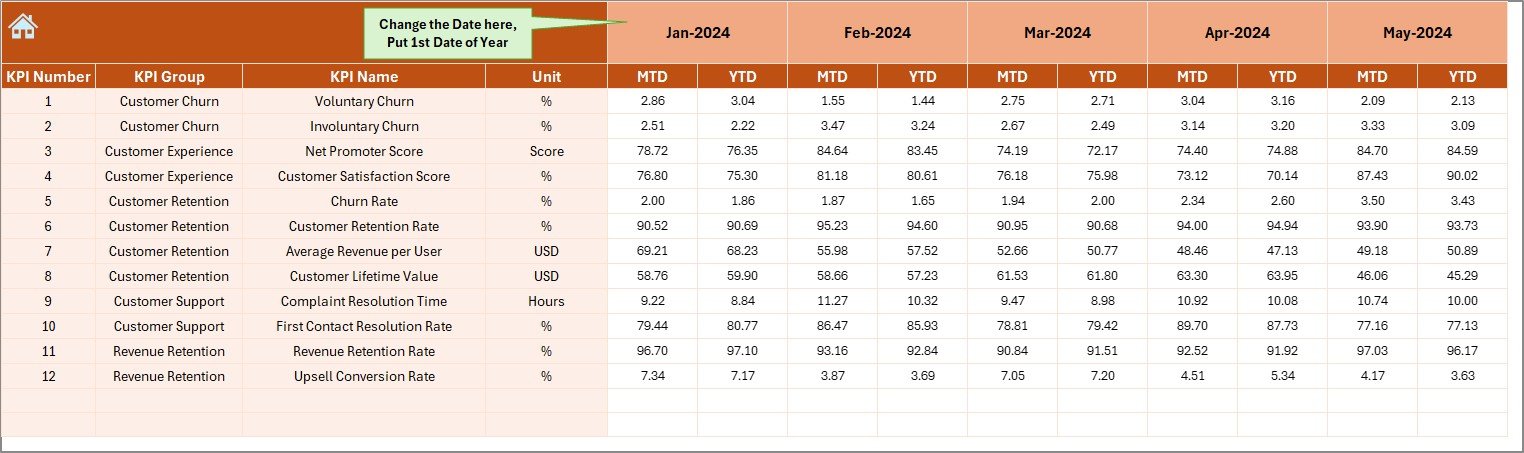
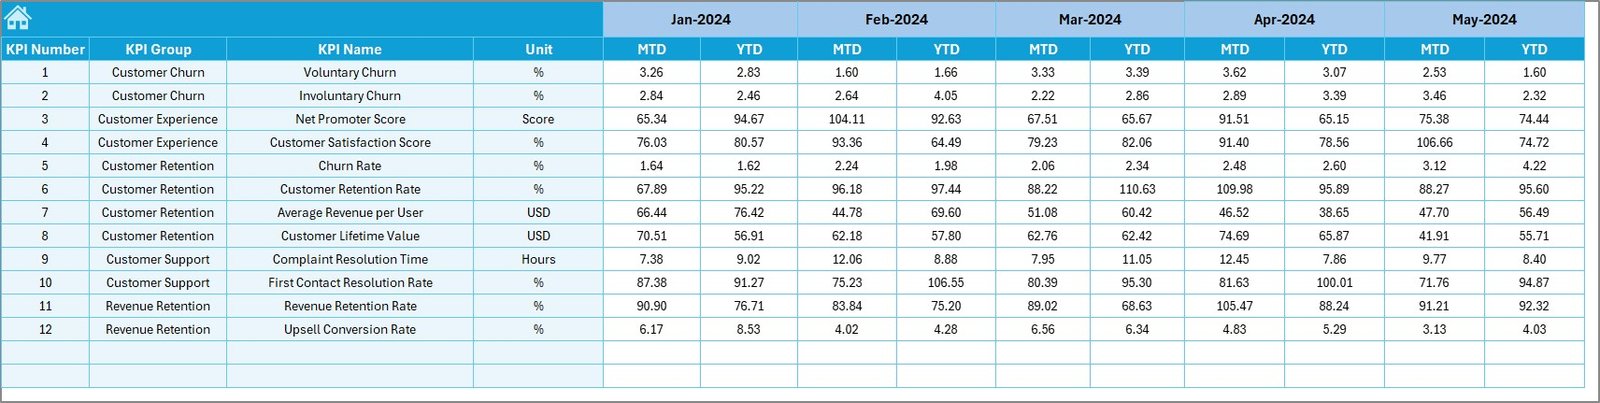
4️⃣ Actual Numbers Input Sheet: Input real performance data monthly and track progress effortlessly.
5️⃣ Target Sheet: Set clear monthly and annual goals to evaluate progress.
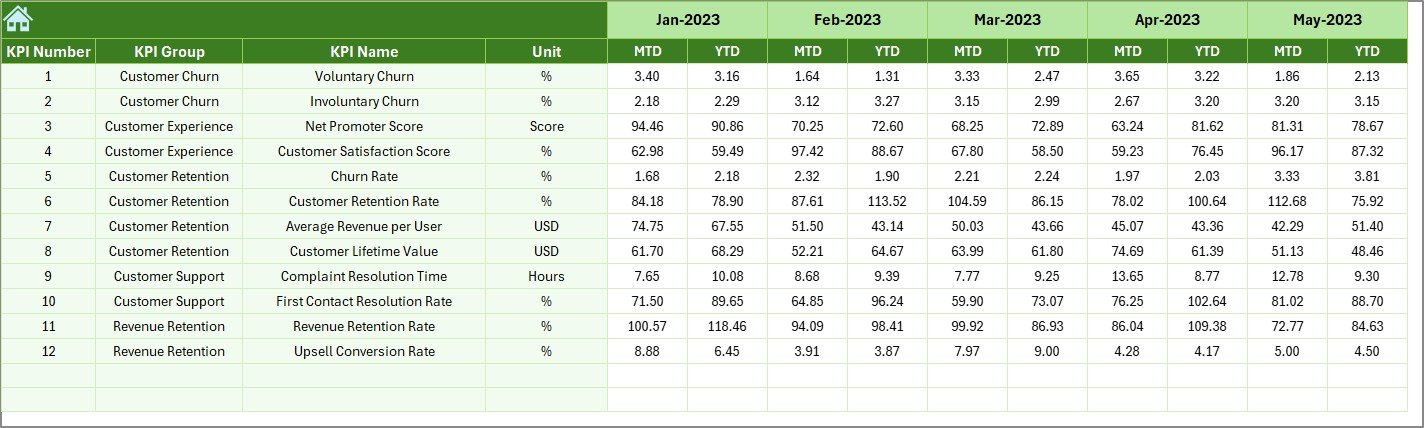
6️⃣ Previous Year Sheet: Compare historical data for year-over-year insights.
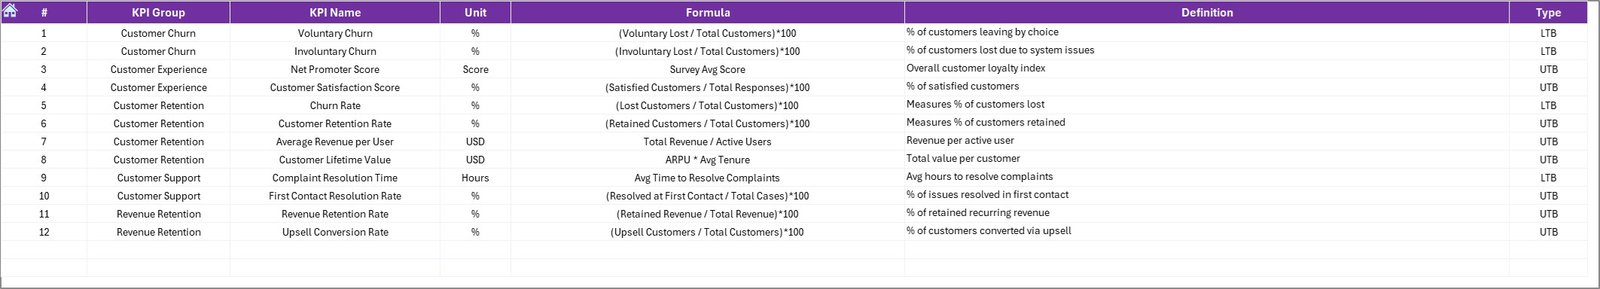
7️⃣ KPI Definition Sheet: Maintain clarity with a detailed list of KPI names, units, formulas, and definitions.
Each sheet is interconnected, ensuring seamless data flow and real-time visualization of telecom performance metrics.
🧭 How to Use the Telecom Customer Retention KPI Dashboard
1️⃣ Start from the Home Sheet:
Use the navigation buttons to move between sheets quickly.
2️⃣ Enter Data in the Actual Numbers Sheet:
Add your monthly MTD and YTD numbers for each KPI.
3️⃣ Set Targets:
Input your team’s goals in the Target sheet for meaningful performance comparison.
4️⃣ View Dashboard Insights:
Use the Dashboard tab to instantly see your company’s MTD and YTD performance.
5️⃣ Analyze KPI Trends:
Dive into the KPI Trend sheet to identify patterns in satisfaction, churn, and retention over time.
6️⃣ Review and Act:
Spot underperforming KPIs highlighted in red and take corrective actions promptly.
With these steps, any telecom manager or analyst can transform raw data into actionable insights — all without writing a single line of code.
👥 Who Can Benefit from This Dashboard
✅ Telecom Managers:
Monitor retention KPIs and ensure teams meet customer satisfaction goals.
✅ Customer Experience Teams:
Analyze complaint resolution times and service performance trends.
✅ Analysts & BI Teams:
Visualize data patterns across months and compare results with previous years.
✅ Marketing Teams:
Identify at-risk customers and optimize retention campaigns.
✅ Executives & Leaders:
Get a 360° view of customer loyalty metrics to make informed business decisions.
Whether you manage mobile, broadband, or enterprise divisions, this Excel dashboard adapts effortlessly to your data and objectives.


Reviews
There are no reviews yet.