


In today’s fast-changing digital world, technology teams are responsible for much more than just IT support. They manage infrastructure, oversee cybersecurity, drive digital transformation, and ensure systems run smoothly. But without proper tracking, it’s difficult to know if technology initiatives are truly effective.
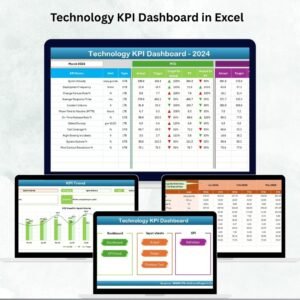
The Technology KPI Dashboard in Excel is the solution. This ready-to-use Excel template consolidates IT performance data into one structured, visual dashboard. From tracking uptime and incidents to monitoring project delivery and user satisfaction, it provides a complete view of technology operations in an easy-to-use format.
Unlike costly BI software, this Excel-based dashboard is affordable, customizable, and beginner-friendly—making it ideal for small, medium, and large organizations alike.
✨ Key Features of Technology KPI Dashboard
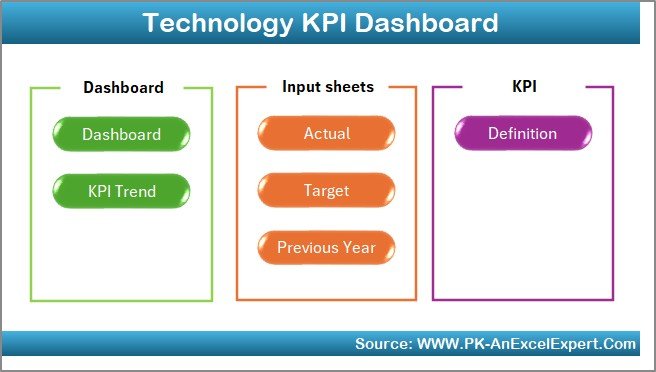
✅ Home Sheet – User-friendly index page with quick navigation buttons.
✅ Dashboard Tab – Main reporting hub with KPI cards and charts. Shows:
-
Month-to-Date (MTD) vs Target vs Previous Year
-
Year-to-Date (YTD) vs Target vs Previous Year
-
Conditional formatting (green/red arrows for performance).
✅ KPI Trend Sheet – Select a KPI to view: -
KPI Group, Unit, Type (UTB/LTB), Formula, and Definition.
-
Trend charts for MTD and YTD performance.
✅ Actual Numbers Sheet – Enter real-time performance values for MTD & YTD.
✅ Target Sheet – Record monthly and yearly targets to align goals.
✅ Previous Year Data Sheet – Store historical data for benchmarking.
✅ KPI Definition Sheet – Maintain a structured KPI library with formulas and definitions.
✅ Dynamic Charts & Slicers – Easily filter and analyze trends without manual effort.
📦 What’s Inside the Technology KPI Dashboard
When you download this template, you get:
-
Interactive Dashboard Page with KPIs and trend visuals.
-
KPI Trend Tab for detailed drill-down analysis.
-
Data Input Sheets (Actual Numbers, Targets, Previous Year).
-
KPI Definition Sheet for transparency in formulas and metrics.
-
Preloaded Sample KPIs like uptime, incident resolution, IT cost per employee, and project delivery rate.
-
Customizable Layout so you can adapt it to your organization’s priorities.
This setup ensures that your IT performance is always measurable, transparent, and actionable.
🛠️ How to Use the Technology KPI Dashboard
-
Start at the Home Sheet – Use navigation buttons to jump between sections.
-
Enter Actual Data – Input MTD and YTD performance numbers.
-
Set Targets – Record monthly/yearly targets in the Target Sheet.
-
Add Previous Year Data – Store past metrics for benchmarking.
-
Track Performance – Review KPIs in the Dashboard and KPI Trend tabs.
-
Update KPI Library – Add or edit KPIs in the Definition Sheet as needed.
-
Present Reports – Share the dashboard with decision-makers to support IT strategy.
No advanced Excel skills are required—everything is automated with drop-downs, charts, and formulas.
👩💼 Who Can Benefit from This Dashboard?
-
IT Managers & CTOs – Track system uptime, costs, and digital projects.
-
Technology Leaders – Gain real-time insights for better decision-making.
-
CIOs & Executives – Align IT performance with business goals.
-
Helpdesk Managers – Monitor ticket resolution times and user satisfaction.
-
Project Teams – Measure delivery timelines and resource utilization.
-
Small & Mid-Sized Businesses – Affordable solution without expensive BI tools.
By using this dashboard, businesses can make data-driven IT decisions, reduce risks, and improve efficiency across technology operations.


Reviews
There are no reviews yet.