
Managing tax litigation efficiently is no longer optional—it is a necessity. With frequent regulatory changes, rising scrutiny from tax authorities, and increasing case volumes, organizations must track every tax dispute, appeal, and outcome with precision. However, relying on scattered Excel files, emails, or static reports often leads to missed deadlines, poor visibility, and weak decision-making.
That is exactly why the Tax Litigation KPI Dashboard in Power BI is a game-changing solution.
This ready-to-use Power BI dashboard transforms complex tax litigation data into clear, actionable insights. Instead of manual tracking, you get a centralized, interactive, and performance-driven view of all critical tax litigation KPIs—helping you stay compliant, proactive, and in control.
🚀 Key Features of Tax Litigation KPI Dashboard in Power BI
📊 Centralized KPI Monitoring
Track all tax litigation KPIs in one unified Power BI dashboard without switching between files.
📅 Month & KPI Group Slicers
Instantly filter data by reporting month or litigation category for focused analysis.
🎯 MTD & YTD Performance Tracking
Automatically calculate Month-to-Date and Year-to-Date values with zero manual effort.
📈 Target vs Actual Analysis
Clearly see whether targets are met or missed using percentage metrics and visual indicators.
🔄 Previous Year Comparison
Analyze Current Year vs Previous Year performance to measure improvement or decline.
🚦 Visual KPI Status Indicators
Red ▼ and Green ▲ icons instantly highlight performance risks and achievements.
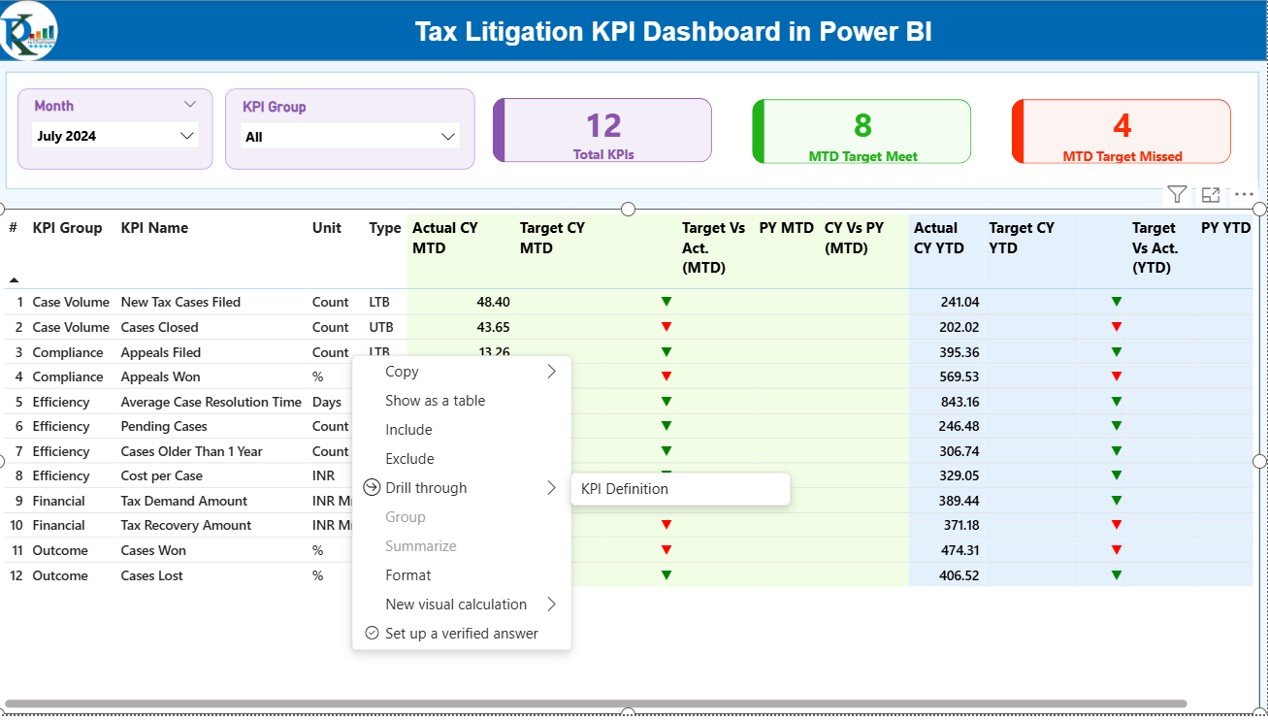
🔍 Drill-Through KPI Definitions
Understand every KPI with formula, definition, unit, and performance type (LTB / UTB).
📦 What’s Inside the Tax Litigation KPI Dashboard
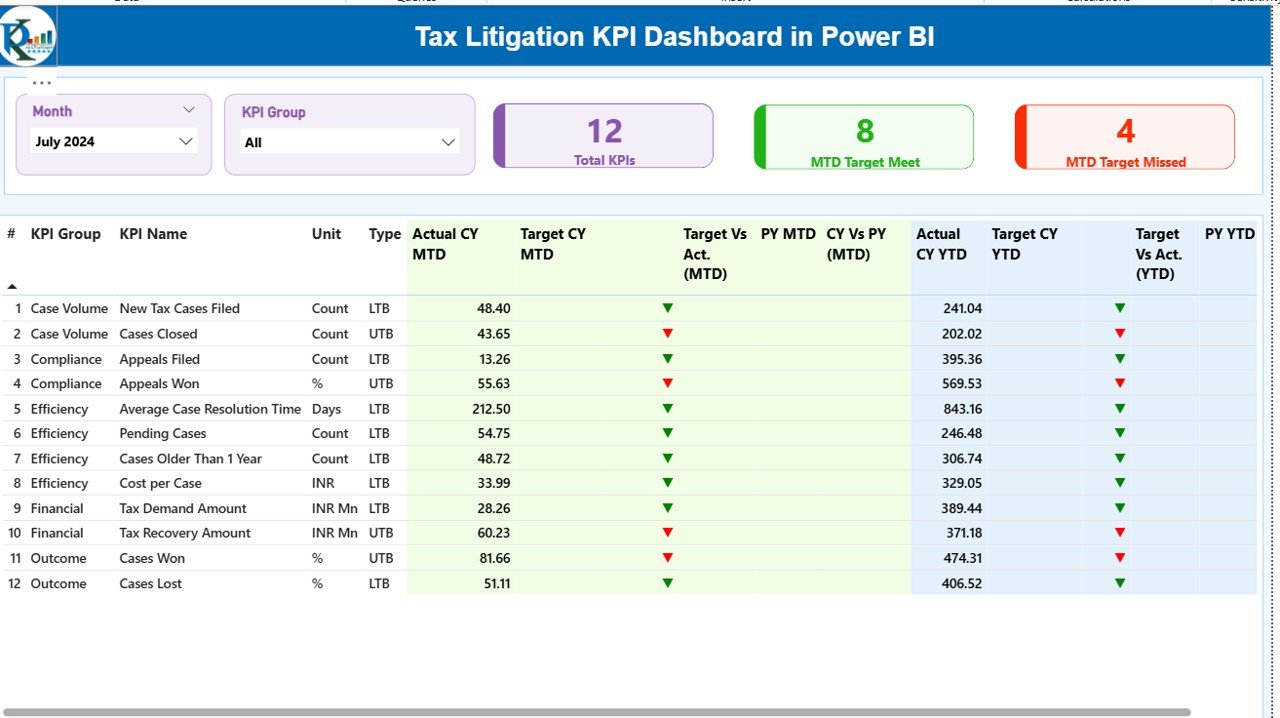
🧩 Summary Page
-
Month & KPI Group slicers
-
KPI cards showing Total KPIs, MTD Target Met, and MTD Target Missed
-
Detailed KPI table with MTD, YTD, Target vs Actual, and Year-over-Year comparisons
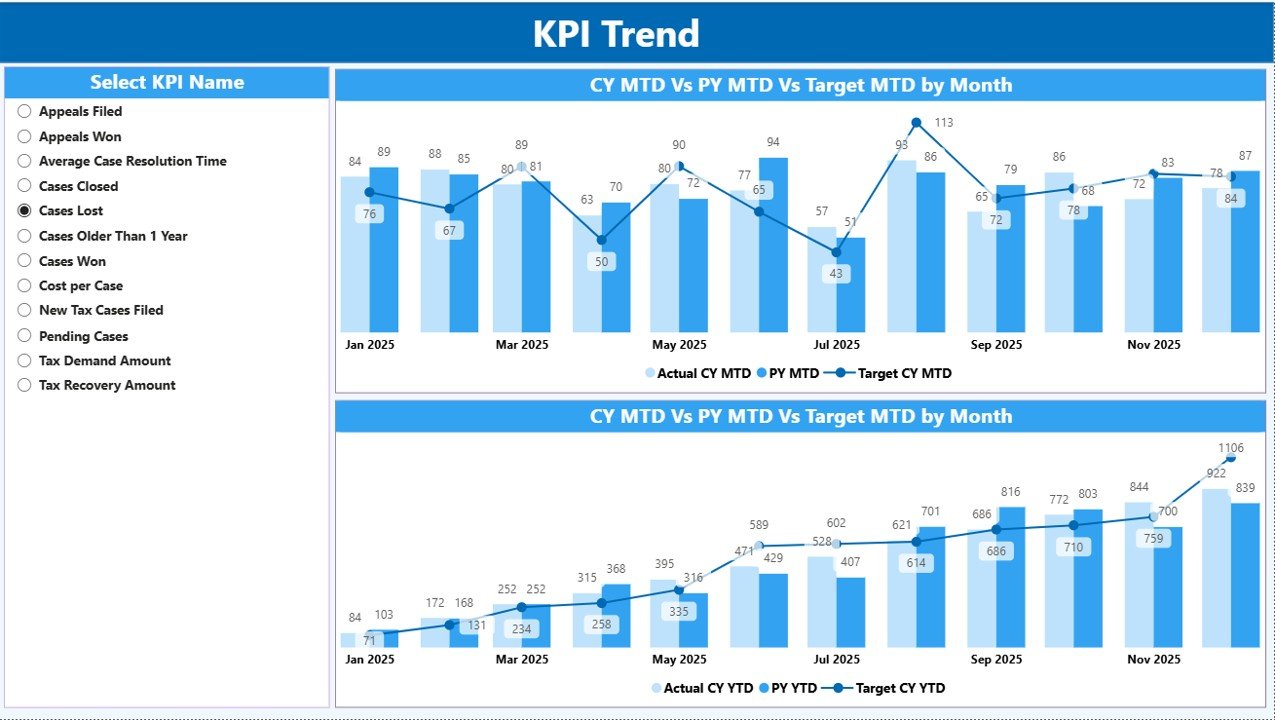
📉 KPI Trend Page
-
Combo charts for MTD and YTD trends
-
Comparison of Current Year Actual, Previous Year Actual, and Targets
-
KPI Name slicer for deep analysis
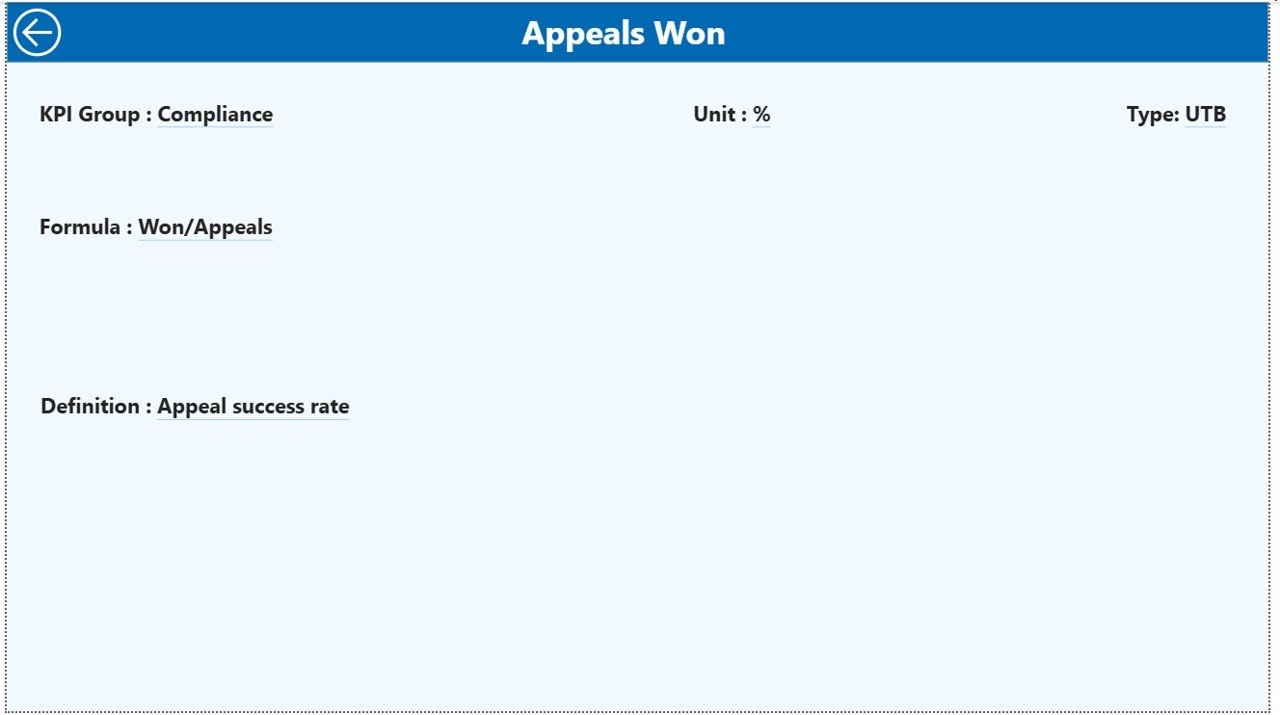
📘 KPI Definition Page
-
Drill-through reference page
-
Displays KPI formula, definition, and LTB/UTB type
-
Helps maintain clarity and consistency across teams
📊 Excel Data Structure
-
Input_Actual Sheet – Enter MTD & YTD actual values
-
Input_Target Sheet – Enter MTD & YTD target values
-
KPI Definition Sheet – Define KPIs, formulas, units, and types
🛠️ How to Use the Tax Litigation KPI Dashboard
1️⃣ Update actual KPI values in the Excel file
2️⃣ Enter target values for each KPI
3️⃣ Maintain KPI definitions in the definition sheet
4️⃣ Refresh the Power BI dashboard
5️⃣ Instantly analyze MTD, YTD, and trend performance
No advanced technical skills required—simple, fast, and efficient.
👥 Who Can Benefit from This Product
👨💼 Tax Managers – Monitor litigation workload and performance
📊 Finance Leaders – Gain visibility into financial exposure and risks
⚖️ Legal & Compliance Teams – Track disputes and compliance effectiveness
🏢 Senior Management – Make informed, data-driven strategic decisions
📑 Consultants & Advisors – Deliver professional litigation insights to clients
Click here to read the Detailed blog post
Watch the step-by-step video tutorial:


