


Managing tax litigation is becoming increasingly complex for businesses, tax professionals, and compliance teams. With frequent changes in tax laws, strict deadlines, and rising scrutiny from authorities, even a small oversight can lead to penalties, delays, or financial losses. Unfortunately, many organizations still rely on scattered Excel files, emails, and manual reports, which makes tracking litigation performance difficult and risky.
That is exactly where the Tax Litigation KPI Dashboard in Excel delivers exceptional value.
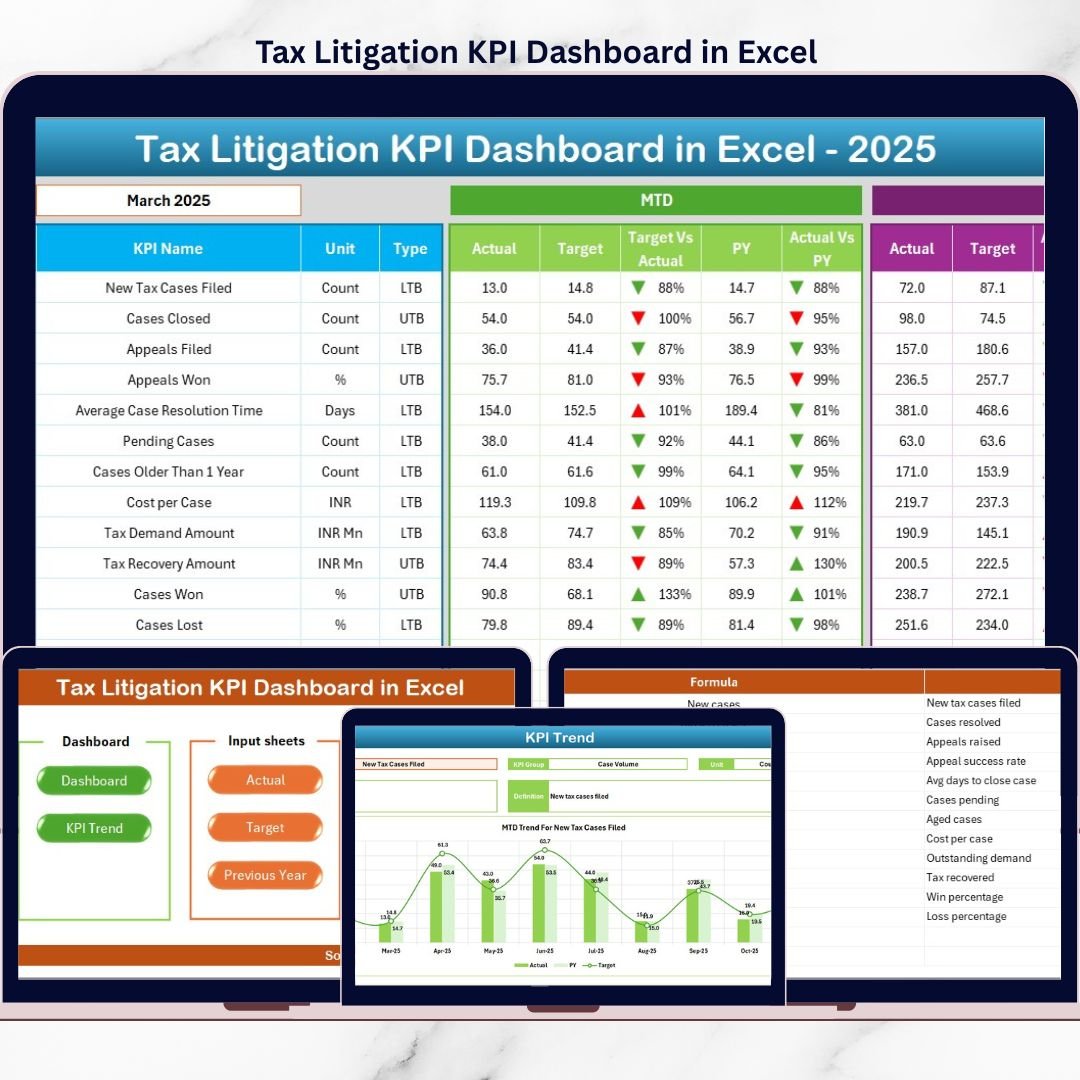
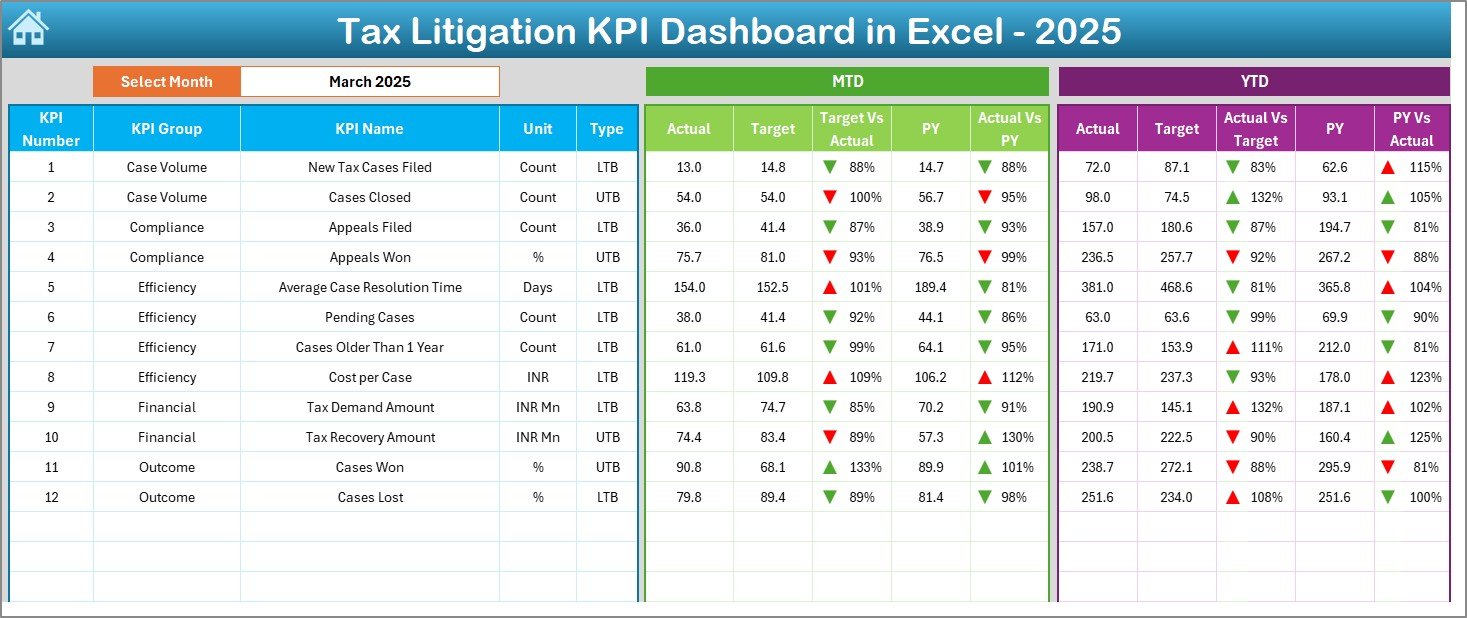
This ready-to-use Excel dashboard is designed to help you track, monitor, and analyze tax litigation KPIs in one centralized and structured system. Instead of switching between multiple files, you get a single, professional dashboard that provides clarity, control, and confidence in your tax dispute management process.
## 🚀 Key Features of Tax Litigation KPI Dashboard in Excel
📊 Centralized KPI Tracking – Monitor all tax litigation KPIs from one Excel dashboard without juggling multiple files.
📅 Dynamic Month Selection – Change the month using a simple drop-down and instantly update all KPIs.
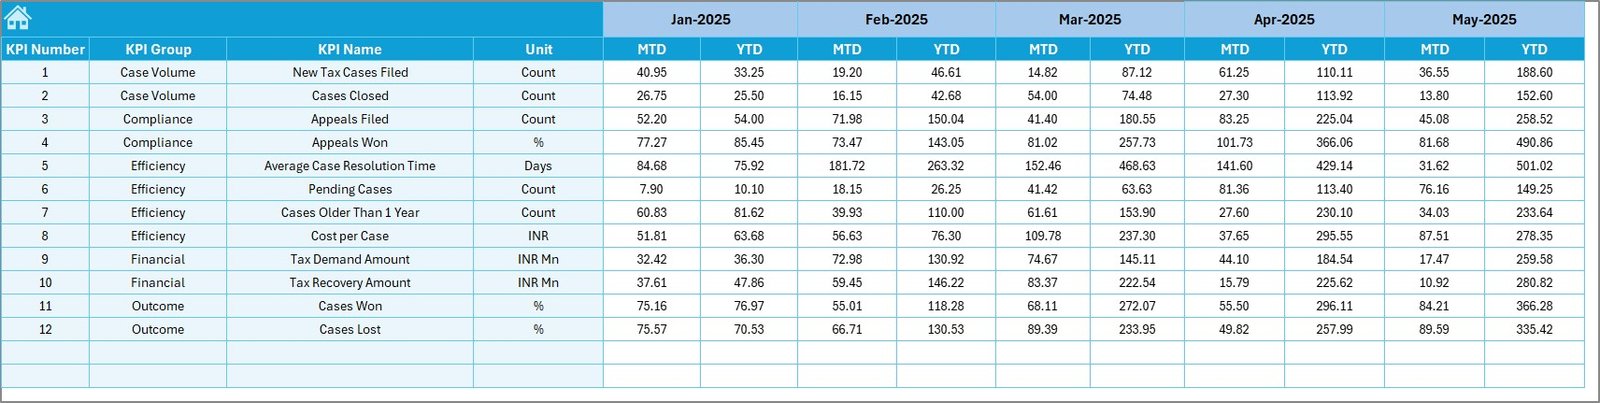
📈 MTD & YTD Performance Analysis – Automatically calculate and display Month-to-Date and Year-to-Date values.
🎯 Target vs Actual Comparison – Instantly identify gaps between planned targets and actual outcomes.
🔁 Previous Year Comparison – Measure improvement by comparing current performance with last year’s data.
⬆️⬇️ Conditional Formatting Indicators – Visual arrows highlight performance trends clearly and quickly.
🧭 Easy Navigation Buttons – Move between sheets smoothly using built-in navigation controls.
## 📦 What’s Inside the Tax Litigation KPI Dashboard in Excel
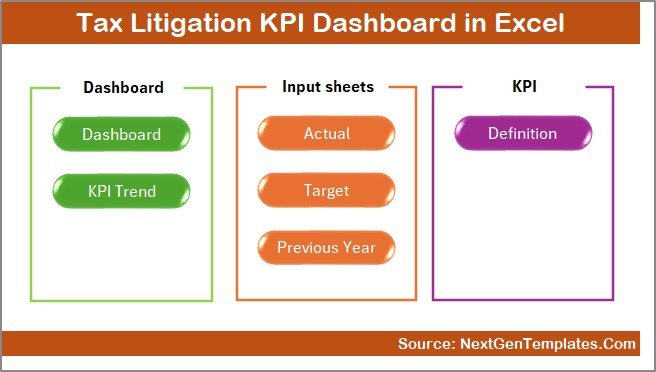
This dashboard includes 7 professionally structured worksheets, each with a specific purpose:
📌 Summary Page – Acts as the index sheet with navigation buttons for fast access to all sections.
📌 Dashboard Sheet – Displays MTD, YTD, Target, and Previous Year values with visual comparisons and indicators.
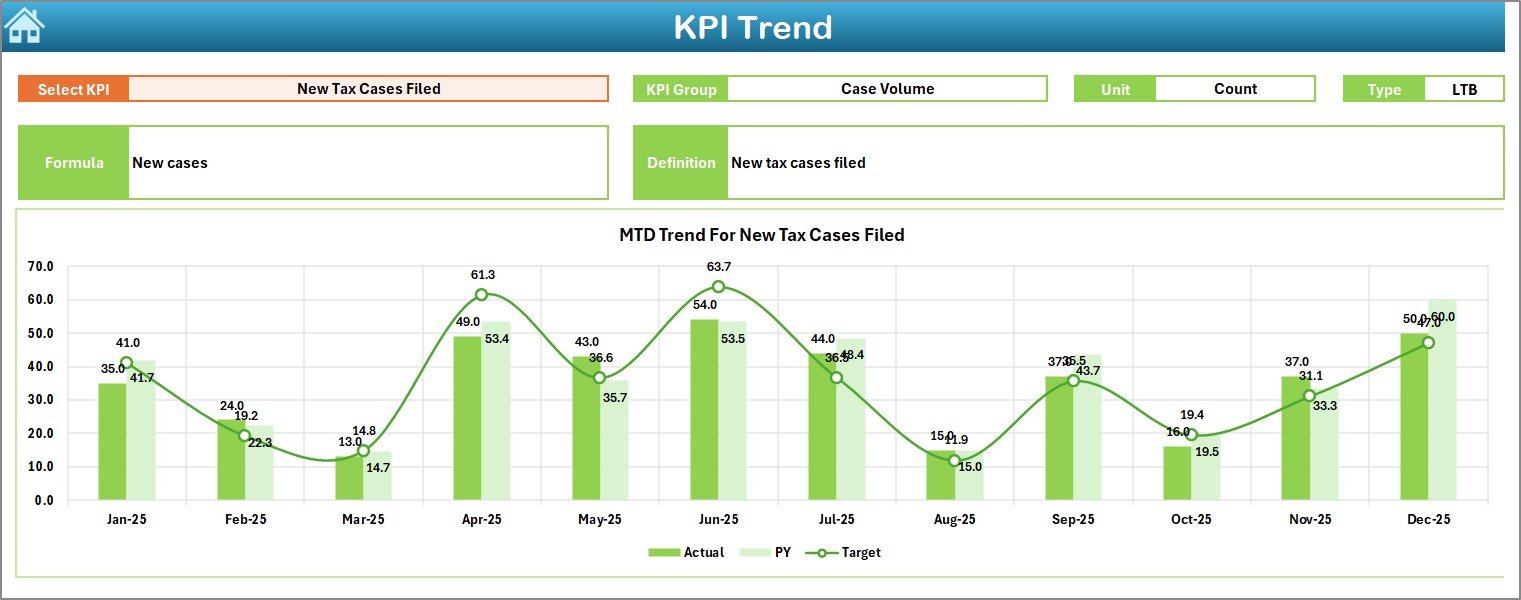
📌 Trend Sheet – Shows KPI-level trends with charts for Actual, Target, and PY (both MTD and YTD).
📌 Actual Numbers Input Sheet – Enter real performance data and control the reporting month easily.
📌 Target Sheet – Define monthly and cumulative targets for accurate performance benchmarking.
📌 Previous Year Number Sheet – Store historical MTD and YTD data for year-over-year analysis.
📌 KPI Definition Sheet – Maintain KPI names, groups, units, formulas, definitions, and KPI types (LTB / UTB).
Together, these sheets create a complete tax litigation performance management solution in Excel.
## 🛠️ How to Use the Tax Litigation KPI Dashboard in Excel
Using this dashboard is simple and user-friendly:
📝 Enter actual MTD and YTD values in the Actual Numbers Input Sheet
🎯 Define targets in the Target Sheet
📂 Add last year’s data in the Previous Year Number Sheet
📅 Select the reporting month from the drop-down
📊 Instantly review results on the Dashboard and Trend Sheets
No macros, no complex tools, and no advanced Excel skills required.
## 👥 Who Can Benefit from This Tax Litigation KPI Dashboard in Excel
This dashboard is ideal for:
👨💼 Tax Managers & Tax Heads
📊 Finance and Compliance Teams
⚖️ Legal & Litigation Departments
📑 Audit Professionals
🏢 Consulting & Advisory Firms
Whether you manage a few cases or a large litigation portfolio, this dashboard adapts easily to your needs.
Click here to read the Detailed blog post
Watch the step-by-step video tutorial:


