Subscription Box Services Dashboard is growing faster than ever across food, beauty, fashion, wellness, and lifestyle segments. However, rapid growth also brings complex challenges. Businesses must continuously track shipping costs, acquisition efficiency, customer satisfaction, and recurring revenue. Without clear visibility, even profitable subscription models can quickly lose control. That is exactly where the Subscription Box Services Dashboard in Power BI becomes a powerful decision-making solution.
This ready-to-use Power BI dashboard helps subscription-based businesses monitor performance, control costs, and improve profitability from one centralized and interactive analytics platform. Instead of relying on multiple Excel sheets or static reports, leadership teams gain instant insights through visually rich and dynamic dashboards.
Designed for simplicity and scalability, this dashboard converts raw operational and financial data into actionable insights. As a result, businesses can respond faster, optimize resources, and make confident, data-driven decisions.
## 🚀 Key Features of Subscription Box Services Dashboard in Power BI
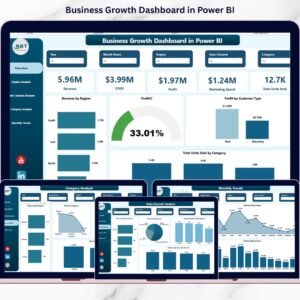
📊 Centralized KPI Visibility
Track shipping costs, operating expenses, customer acquisition cost, revenue, and satisfaction in one unified dashboard.
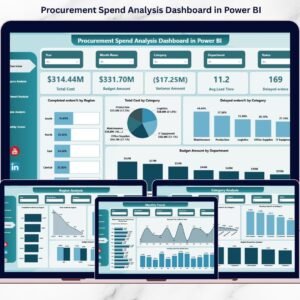
🎯 Cost & Profitability Analysis
Identify high-cost areas across box types, regions, and acquisition channels to protect margins.
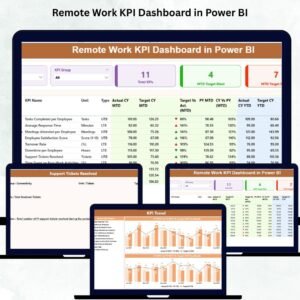
📈 Revenue & Subscription Performance Tracking
Monitor monthly recurring revenue (MRR) and performance across subscription plans.
😊 Customer Satisfaction Monitoring
Analyze satisfaction ratings by box type and subscription company to improve retention.
🎛️ Interactive Slicers & Filters
Filter insights by box type, region, acquisition channel, and time period instantly.
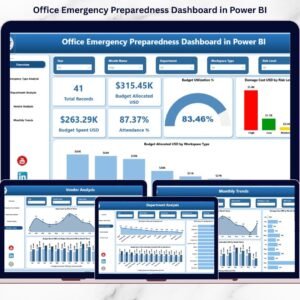
📅 Monthly Trend Analysis
Track cost and efficiency trends over time to detect risks early.
⚡ Fast, Automated Reporting
Refresh data in Power BI and get updated insights without manual reporting effort.
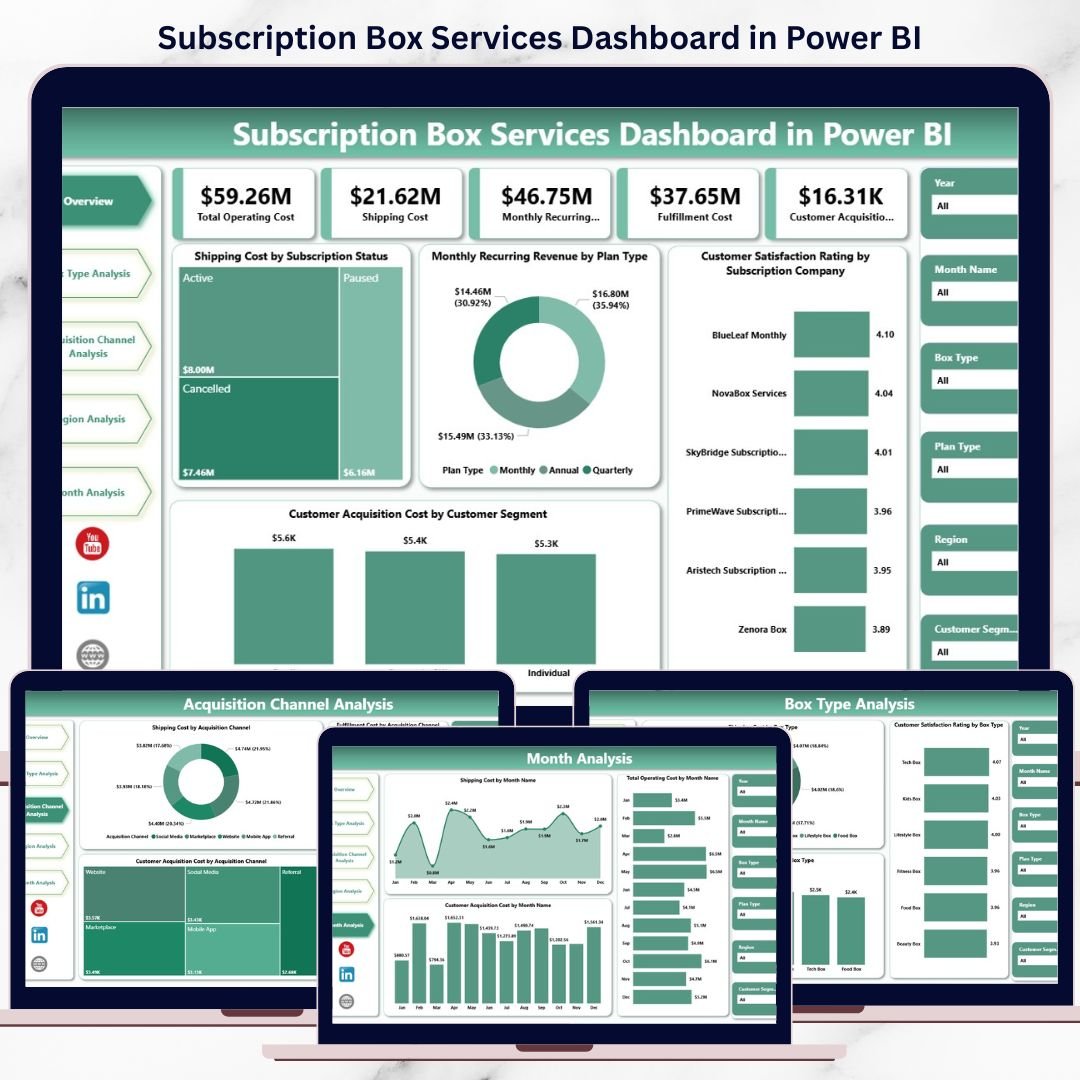
## 📦 What’s Inside the Subscription Box Services Dashboard in Power BI
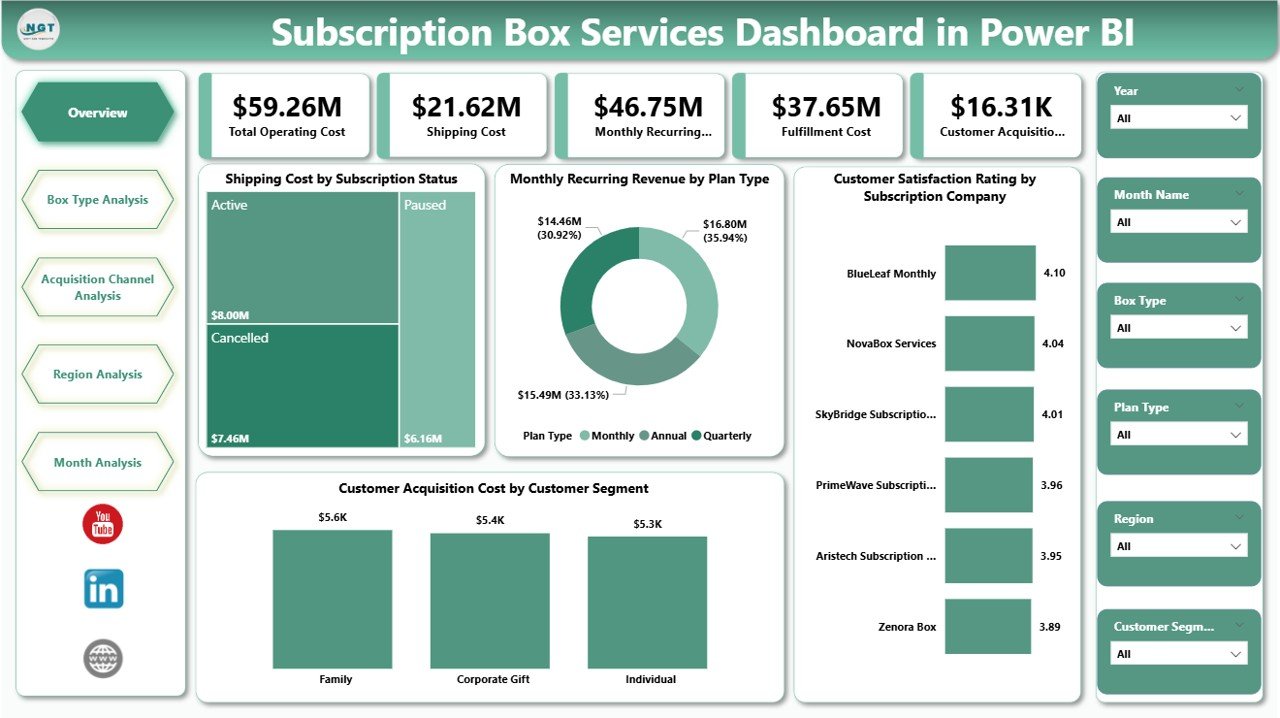
📄 Overview Page – High-level business snapshot with KPI cards and summary charts
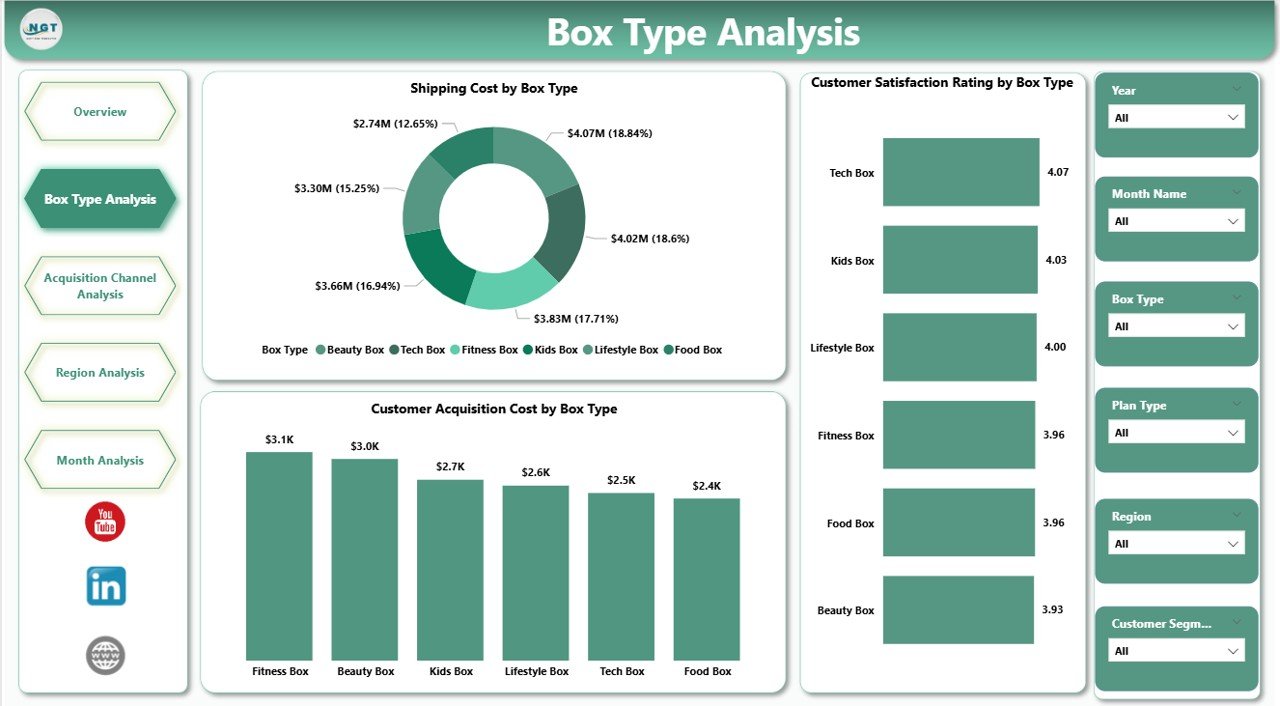
📄 Box Type Analysis Page – Performance comparison across subscription box categories
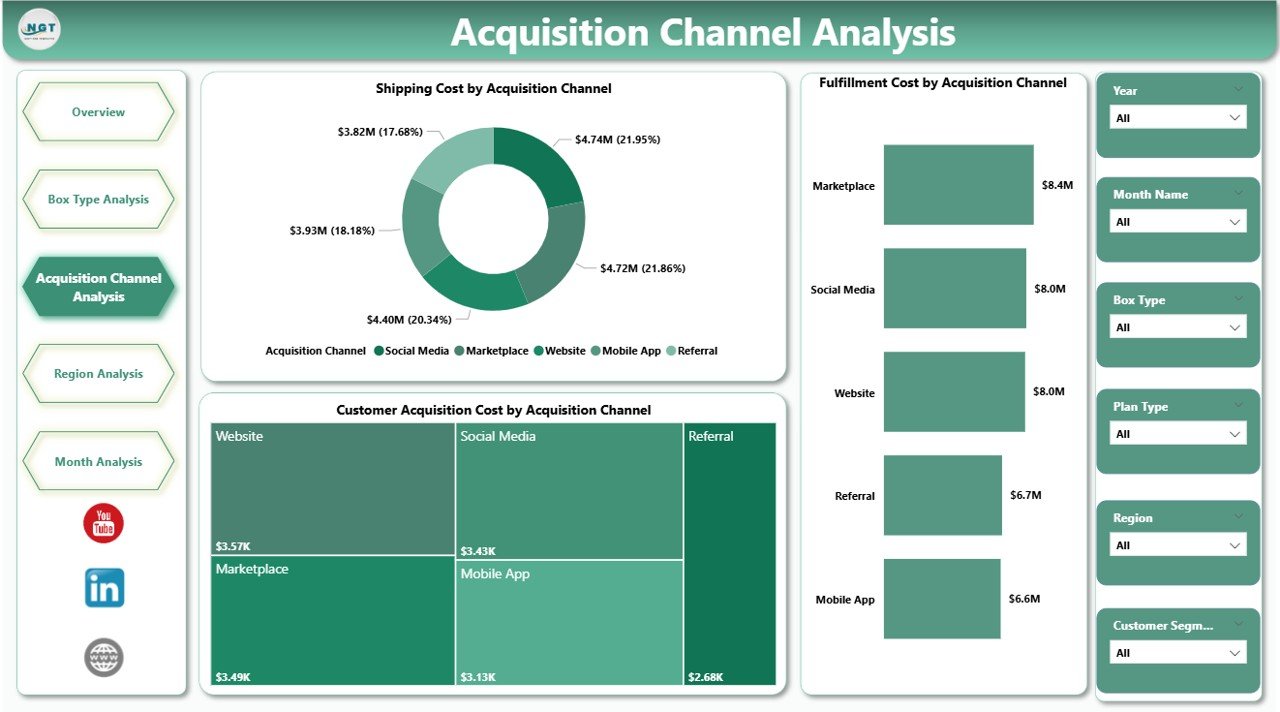
📄 Acquisition Channel Analysis Page – Marketing and fulfillment efficiency insights
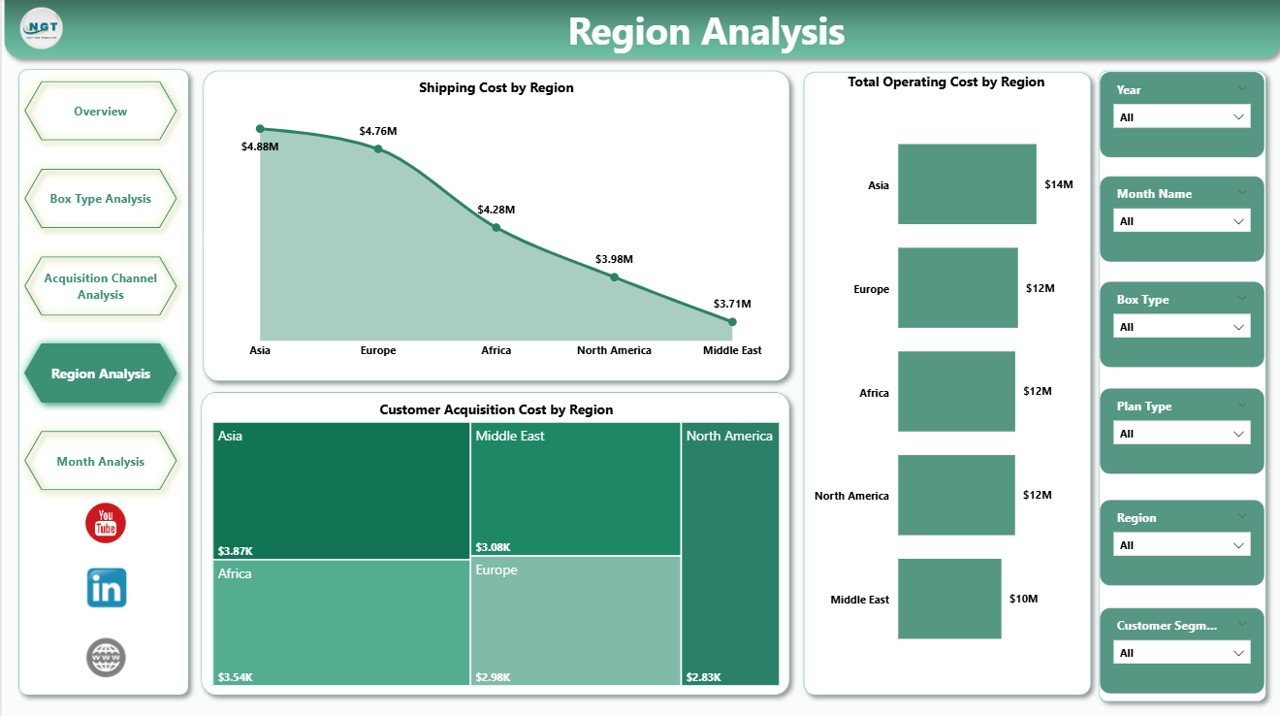
📄 Region Analysis Page – Geographic cost and performance breakdown
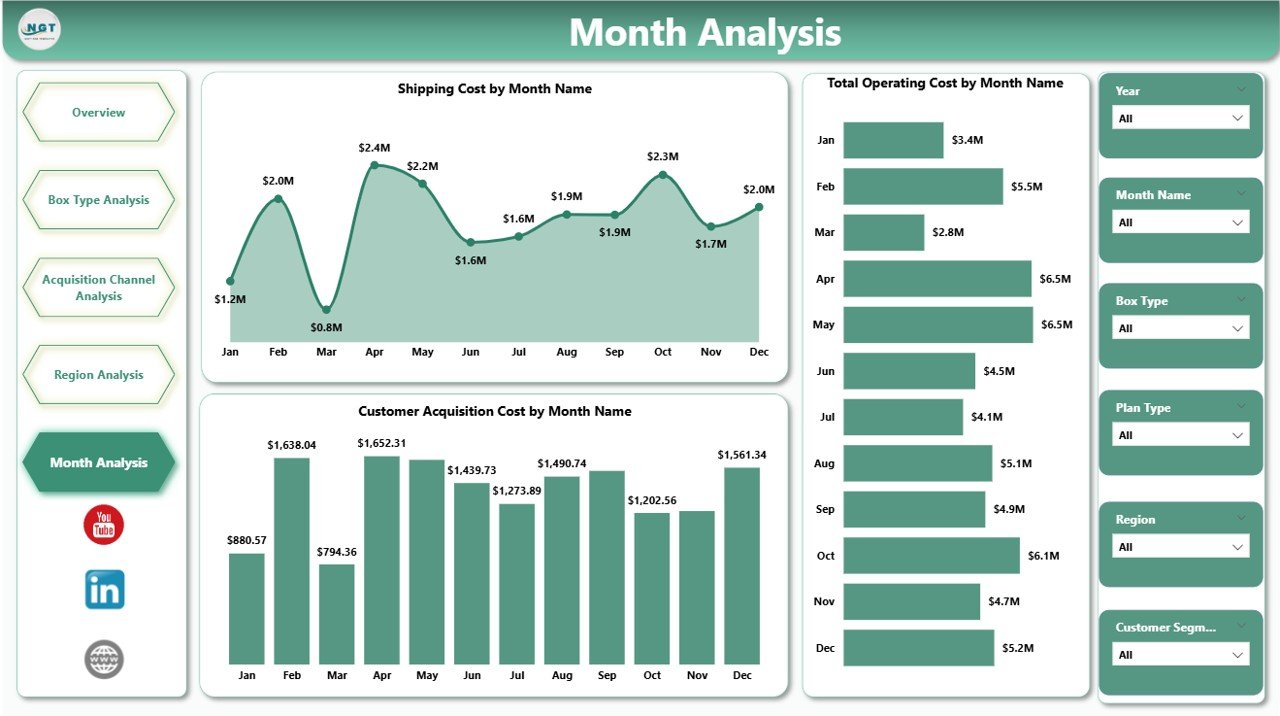
📄 Monthly Trends Page – Time-based analysis of costs and efficiency
Each page answers a specific business question clearly, helping teams move from data to action quickly.
## 🧭 How to Use the Subscription Box Services Dashboard in Power BI
🟢 Step 1: Prepare and connect your data (Excel, database, or other sources)
🟢 Step 2: Open the Power BI dashboard file
🟢 Step 3: Refresh data to load the latest information
🟢 Step 4: Use slicers to filter by box type, region, channel, or month
🟢 Step 5: Review overview metrics and drill into detailed pages
🟢 Step 6: Use insights for pricing, marketing, and operational decisions
You do not need advanced Power BI expertise—basic data understanding is enough.
## 👥 Who Can Benefit from This Subscription Box Services Dashboard in Power BI
📦 Subscription Box Business Owners
📊 Operations & Supply Chain Managers
💰 Finance & Accounting Teams
📢 Marketing & Growth Teams
🧠 Business Analysts
🚀 Startups and Scaling Subscription Brands
If your business depends on recurring revenue and operational efficiency, this dashboard is built for you.
### 🔗 Click here to read the Detailed blog post
📺 Visit our YouTube channel to learn step-by-step video tutorials
👉 Youtube.com/@PKAnExcelExpert


Reviews
There are no reviews yet.