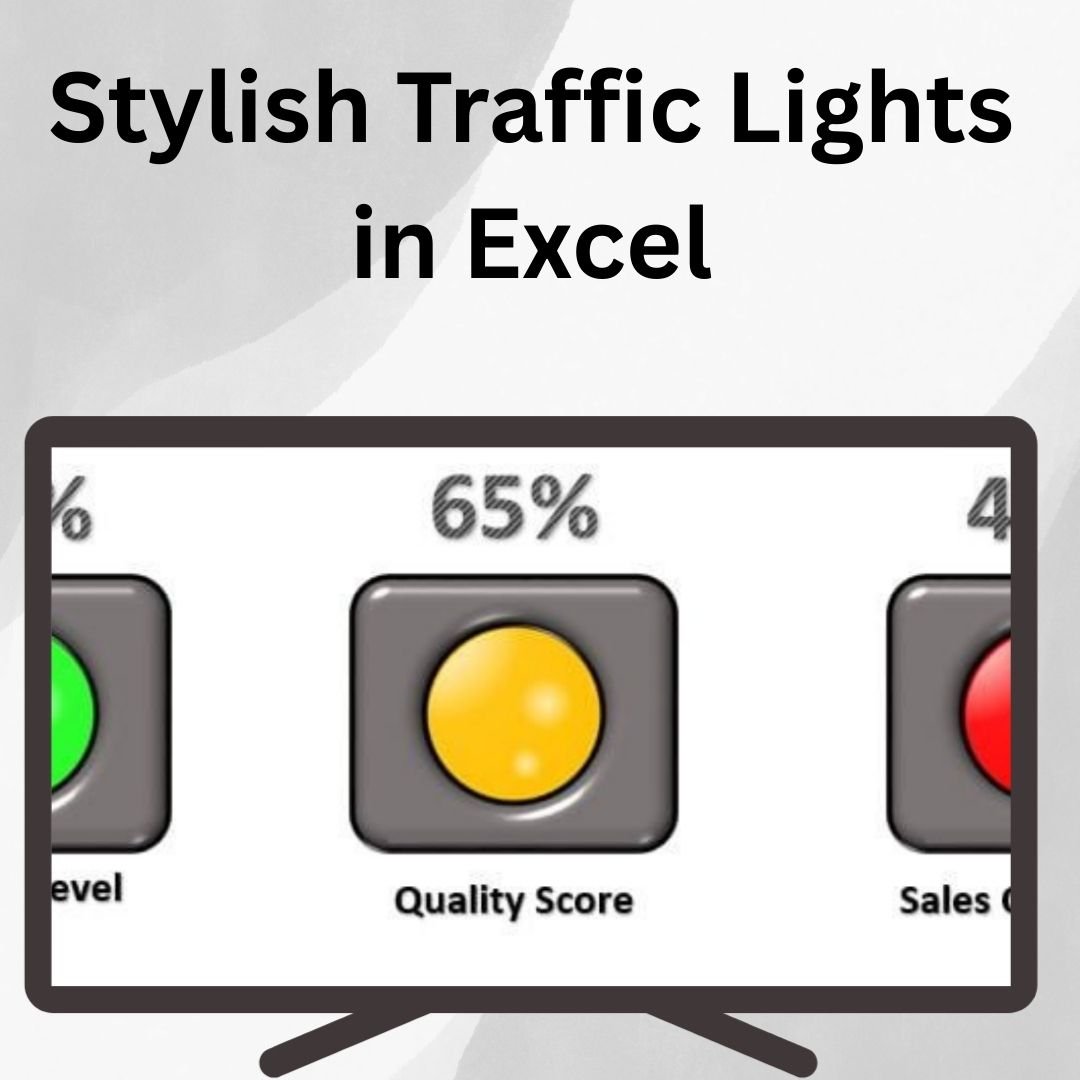
The Stylish Traffic Lights in Excel is a dynamic and visually appealing way to represent data using color-coded traffic light indicators. This tool allows you to showcase performance metrics, statuses, and progress in a simple yet engaging format. Whether you’re tracking project milestones, sales performance, or operational efficiency, the Stylish Traffic Lights are perfect for visualizing data that needs to be assessed quickly.
By using red, yellow, and green traffic light indicators, this Excel feature lets you easily represent critical status information in a way that’s intuitive for users. The design is fully customizable, allowing you to adjust the colors, sizes, and thresholds based on your specific needs. Whether you’re working with financial data, sales targets, or project deadlines, these stylish traffic lights provide a quick visual reference for decision-making.
Key Features of the Stylish Traffic Lights in Excel
📌 Color-Coded Visual Indicators
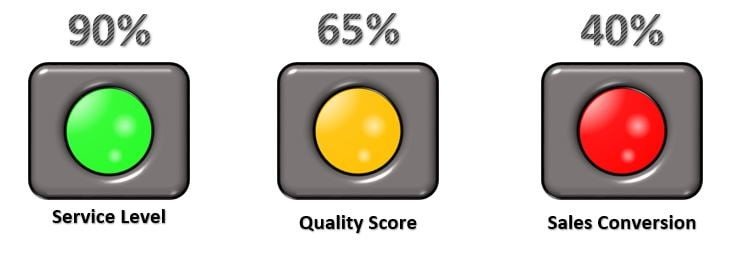
The Stylish Traffic Lights use red, yellow, and green to indicate the status of key metrics, making it easier for users to understand at a glance whether a target is being met or if action is needed. These colors provide a quick visual cue for assessing performance.
🛠 Customizable Design
You can easily adjust the colors, sizes, and thresholds to suit your specific needs. Whether you want to track performance against targets, deadlines, or other criteria, you have full control over how the traffic lights are displayed.
💡 Real-Time Data Updates
As the data in your Excel sheet changes, the traffic lights automatically update to reflect the new status. This real-time update ensures that your data is always current and accurate without needing manual adjustments.
🔢 Dynamic Data Representation
With the ability to set custom thresholds, you can use the Stylish Traffic Lights to dynamically represent different data ranges. For example, green could indicate that a target has been met, yellow could represent a warning, and red could signal that immediate action is required.
🚀 Easy-to-Use Setup
Setting up the Stylish Traffic Lights is simple and doesn’t require advanced Excel skills. With just a few clicks, you can implement these traffic light indicators into your spreadsheet, making your data more visually engaging and actionable.
📊 Perfect for Dashboards and Reports
The Stylish Traffic Lights are ideal for dashboards, reports, and presentations where quick visual representation is needed. These indicators add a professional touch to your reports and help stakeholders grasp key data insights quickly.
⚙ Flexible Data Tracking
Use the Stylish Traffic Lights to track progress on various data points such as sales targets, project deadlines, or budget compliance. With this tool, you can track performance across multiple metrics simultaneously and ensure that nothing gets overlooked.
🚀 Why You’ll Love the Stylish Traffic Lights in Excel
✅ Visual Clarity – Red, yellow, and green indicators make it easy to assess performance at a glance. ✅ Customizable and Flexible – Adjust the traffic light settings to fit your specific needs. ✅ Real-Time Updates – Automatically reflect changes in your data with dynamic traffic lights. ✅ Ideal for Dashboards – Perfect for use in professional reports, dashboards, and presentations. ✅ Easy to Implement – Simple setup for anyone, regardless of Excel experience.
📂 What’s Inside the Stylish Traffic Lights in Excel?
- Color-Coded Traffic Lights: A dynamic, visual representation of data using red, yellow, and green indicators.
- Customizable Settings: Adjust thresholds, colors, and design elements to match your needs.
- Real-Time Data Updates: Automatically adjust to data changes in your Excel sheet.
- Clear Setup Instructions: Step-by-step instructions for quick and easy implementation.
🔍 How to Use the Stylish Traffic Lights in Excel
1️⃣ Download the Template – Instant access to the Excel file upon purchase. 2️⃣ Input Your Data – Enter your data into the template, setting thresholds for your traffic light indicators. 3️⃣ Customize the Design – Adjust the color scheme and other design elements as needed. 4️⃣ Track Progress – Use the traffic lights to visualize performance against targets or goals. 5️⃣ Share and Present – Incorporate the traffic lights into reports or dashboards for clear data representation.
🎯 Who Can Benefit from the Stylish Traffic Lights in Excel? 🔹 Project Managers
🔹 Sales Teams
🔹 Marketing Teams
🔹 Business Analysts
🔹 Operations Managers
🔹 Anyone needing a quick, visual representation of key performance indicators
Make your data easier to understand and more engaging with the Stylish Traffic Lights in Excel. This tool helps you monitor progress, track performance, and make data-driven decisions at a glance.
Click here to read the Detailed blog post
https://www.pk-anexcelexpert.com/stylish-traffic-lights-in-excel/


Reviews
There are no reviews yet.