Managing student exchange programs is becoming increasingly complex as educational institutions expand global partnerships and international collaboration. Universities and academic organizations must track student participation, program costs, funding sources, scholarship distribution, regional engagement, and satisfaction performance simultaneously. However, when information is scattered across multiple spreadsheets, administrators struggle to gain clear insights quickly.
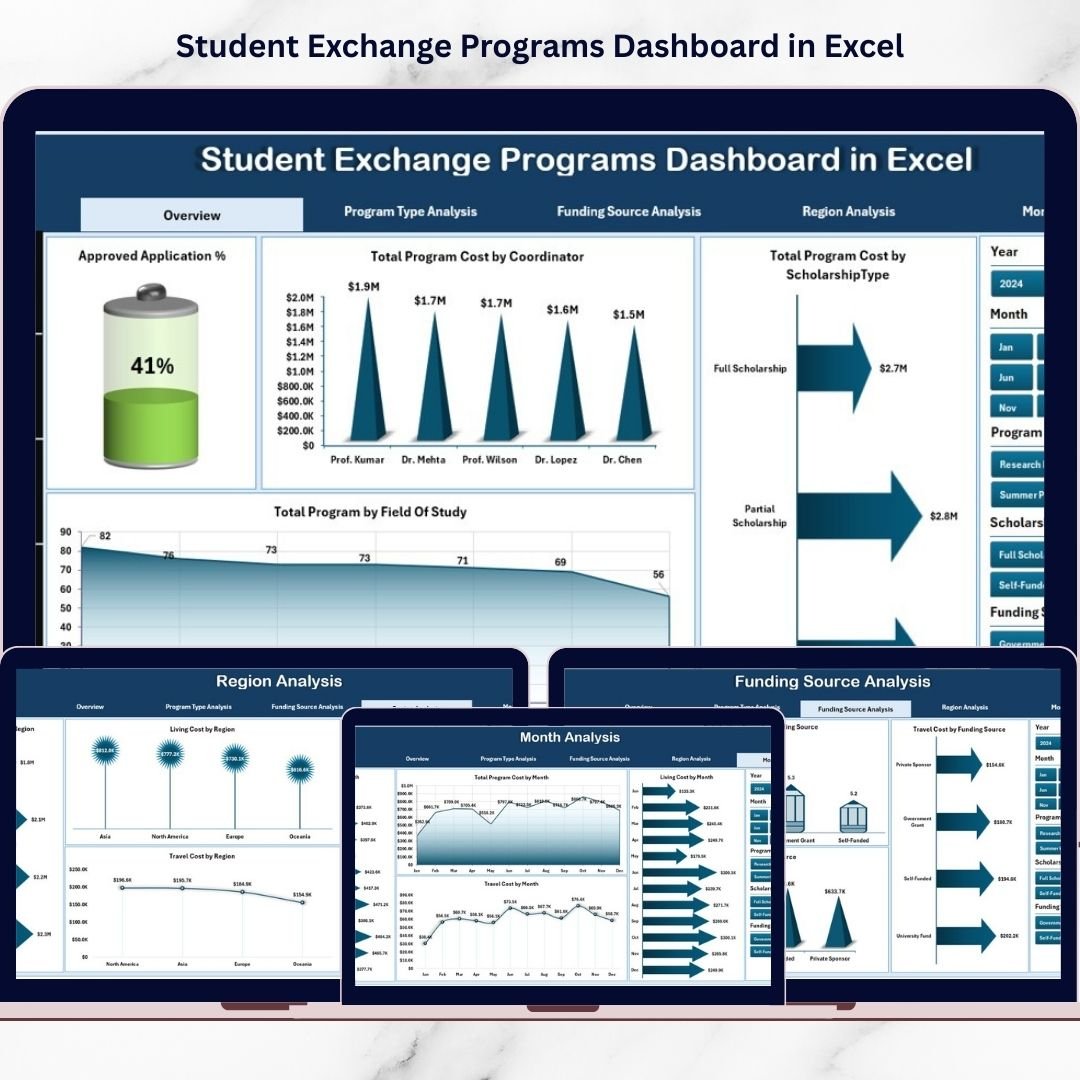
The Student Exchange Programs Dashboard in Excel is a powerful, ready-to-use analytics solution designed to simplify exchange program management through structured data visualization and automated reporting. Instead of manually compiling reports, institutions can monitor program performance from one centralized dashboard powered entirely by Excel.
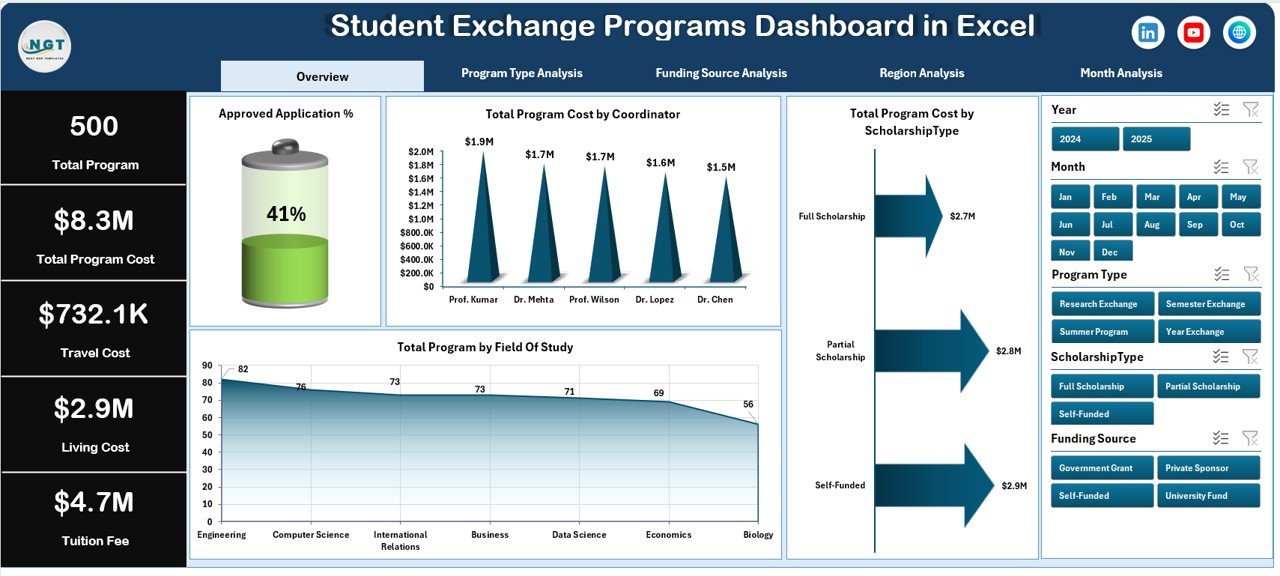
This professionally designed dashboard converts raw program data into meaningful visual insights using interactive charts, KPI cards, and dynamic filters. As a result, administrators can evaluate performance instantly, identify trends, control costs, and make data-driven decisions with confidence.
Whether managing international mobility programs, scholarships, or global academic partnerships, this dashboard helps institutions move from manual tracking to intelligent program management.
🚀 Key Feature of Student Exchange Programs Dashboard in Excel
📊 Centralized Program Monitoring
Track applications, approvals, costs, and satisfaction metrics from one unified dashboard.
🎯 Interactive KPI Overview
Quickly understand program performance using visual KPI cards and analytical charts.
🔎 Dynamic Slicers & Filters
Analyze programs by coordinator, funding source, region, or time period instantly.
📈 Multi-Page Analytical Dashboard
Access five specialized analysis pages for deeper program evaluation.
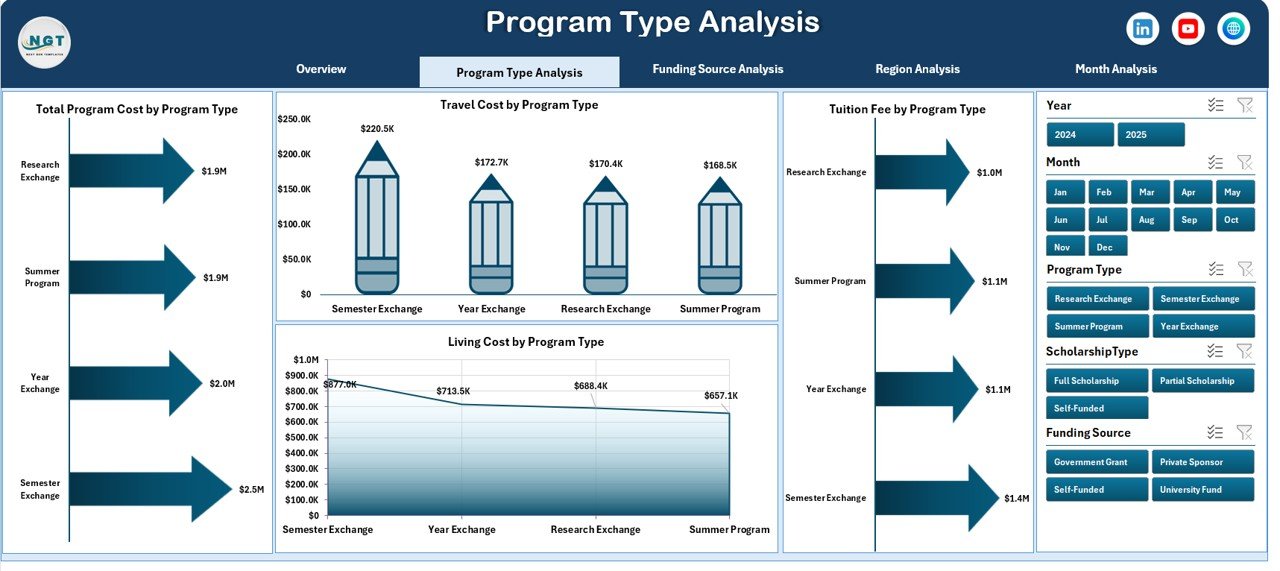
💰 Comprehensive Cost Analysis
Monitor travel, tuition, and living expenses across different program types.
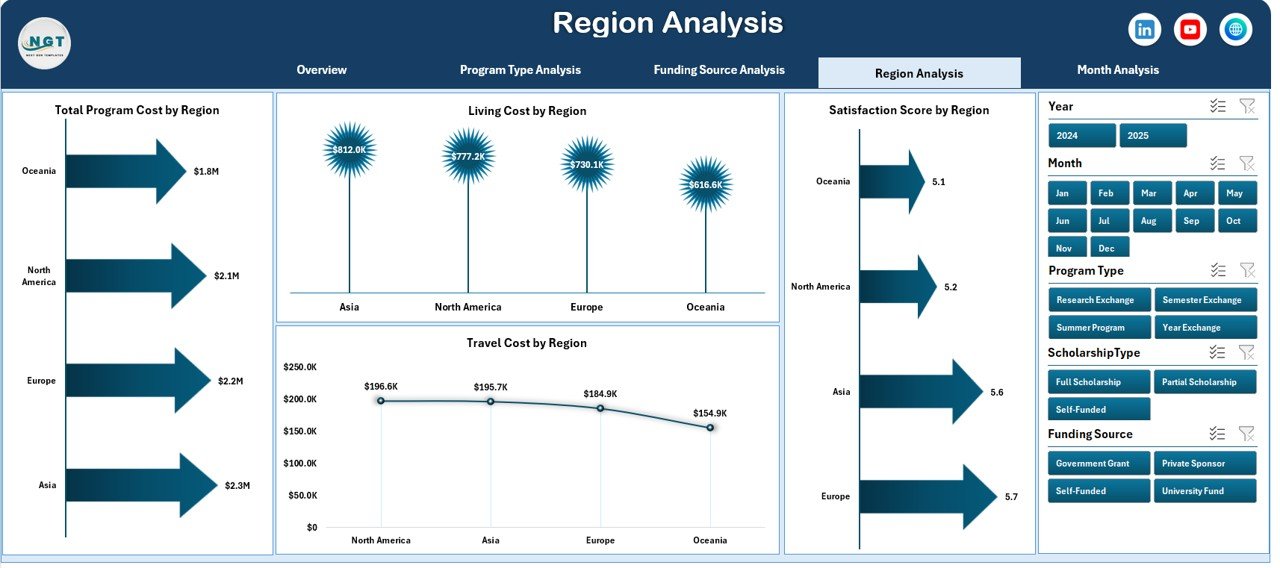
🌍 Regional Performance Insights
Compare participation and satisfaction levels across global regions.
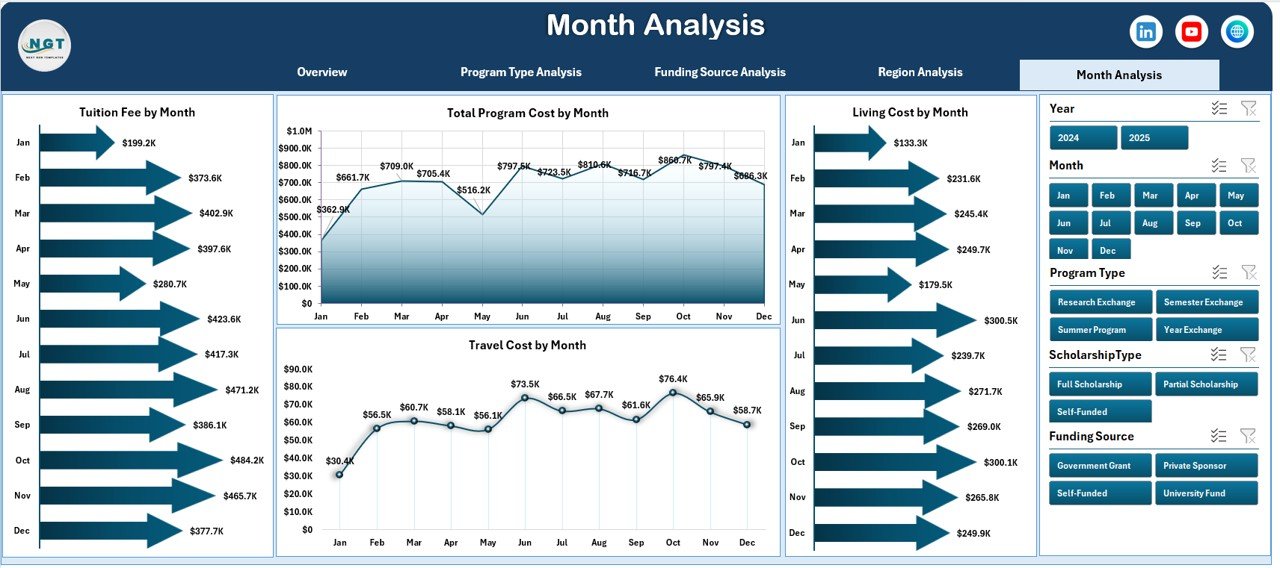
📅 Monthly Trend Analysis
Identify seasonal participation patterns and budget utilization trends.
⚡ Automatic Chart Updates
Update data once and refresh Pivot Tables to instantly update visuals.
📦 What’s Inside the Student Exchange Programs Dashboard in Excel
This ready-to-use Excel dashboard includes a complete analytical framework:
✅ Five Interactive Dashboard Pages
-
Overview Dashboard
-
Program Type Analysis
-
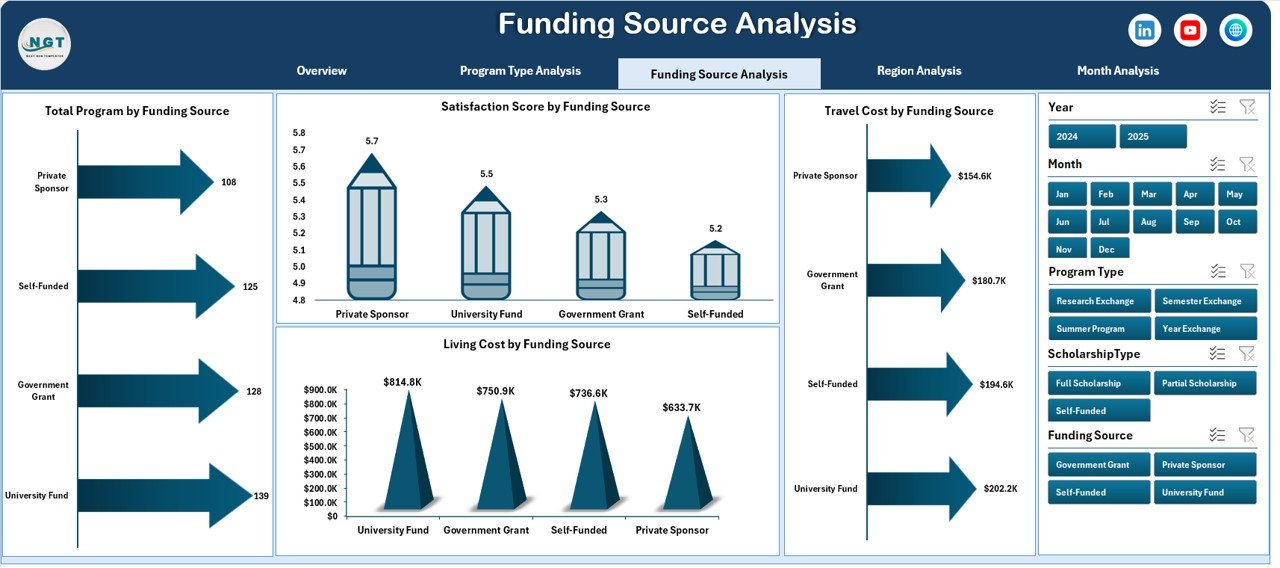
Funding Source Analysis
-
Region Analysis
-
Month Analysis
✅ Structured Backend Sheets
-
Data Sheet for program records
-
Support Sheet for dropdown lists and validations
✅ Prebuilt Pivot Tables & Charts
✅ Interactive Slicers for Easy Filtering
✅ Automated KPI Calculations
✅ Professional Educational Analytics Layout
Simply input your data and start analyzing immediately.
🛠️ How to Use the Student Exchange Programs Dashboard in Excel
The dashboard is designed for simplicity and ease of use:
1️⃣ Enter student and program details into the Data Sheet.
2️⃣ Select values using dropdown lists for accurate entries.
3️⃣ Refresh Pivot Tables to update analytics.
4️⃣ Use slicers to filter by program type, region, or funding source.
5️⃣ Navigate between analytical pages using the Page Navigator.
6️⃣ Review insights and generate reports instantly.
No advanced Excel skills are required — the system is built for everyday administrative users.
👥 Who Can Benefit from This Student Exchange Programs Dashboard in Excel
This dashboard is ideal for organizations managing international education programs:
🎓 Universities and Colleges
🌍 International Relations Offices
📊 Education Administrators
💼 Scholarship Coordinators
🏫 Academic Program Managers
📈 Educational Consultants
💰 Finance & Planning Departments
👨💼 Institutional Leadership Teams
From small exchange initiatives to large global mobility programs, this dashboard provides clarity and control.
By implementing this dashboard, institutions centralize data, improve reporting speed, enhance financial transparency, and make smarter strategic decisions. Instead of spending hours preparing reports, teams focus on improving student experiences and expanding global opportunities.
### Click here to read the Detailed blog post
Visit our YouTube channel to learn step-by-step video tutorials:
👉 https://youtube.com/@PKAnExcelExpert


