Managing sports and recreation programs is no small task — from tracking memberships and event attendance to monitoring facility performance and revenue. That’s why we created the Sports & Recreation KPI Dashboard in Excel — your all-in-one solution to turn raw data into actionable insights effortlessly! ⚽📊
This ready-to-use Excel dashboard helps fitness centers, clubs, academies, and recreation departments monitor their performance with real-time analytics. It’s simple, visual, and powerful — giving you complete control over your operations and performance metrics.
✨ Key Features of Sports & Recreation KPI Dashboard in Excel
✅ Interactive Dashboard: Analyze performance dynamically using month selectors and slicers — no coding required.
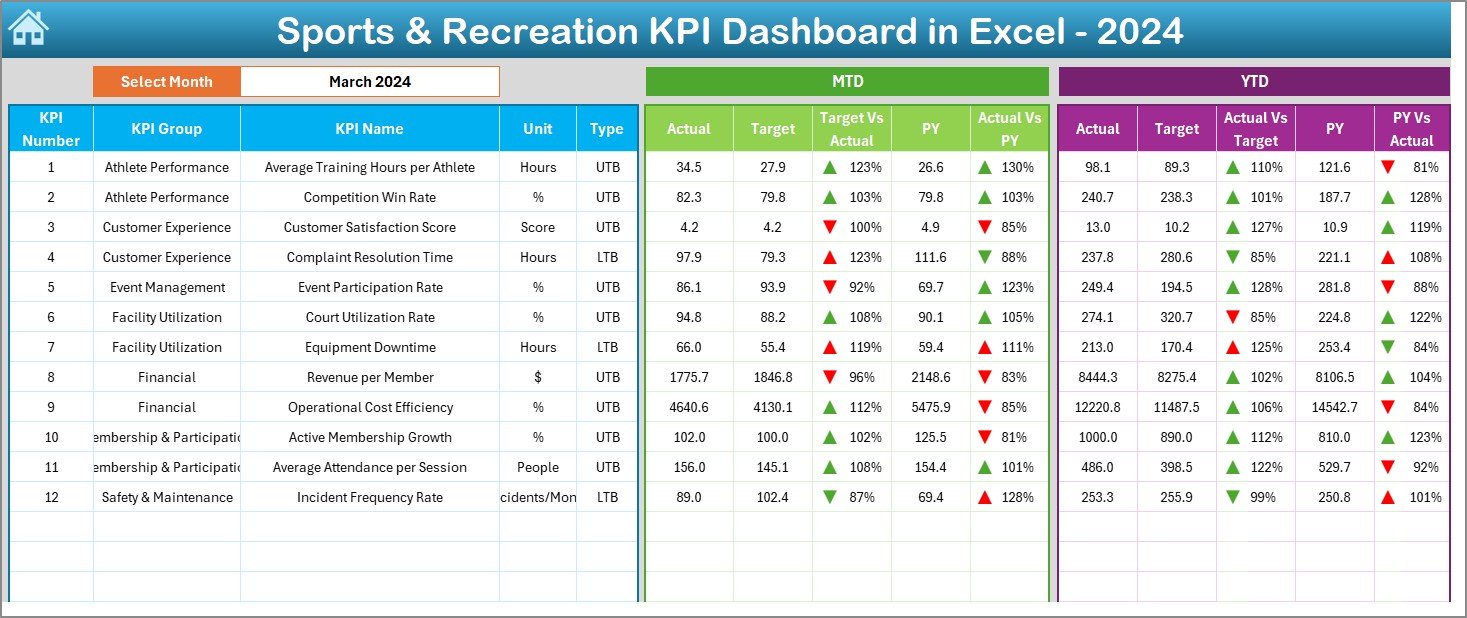
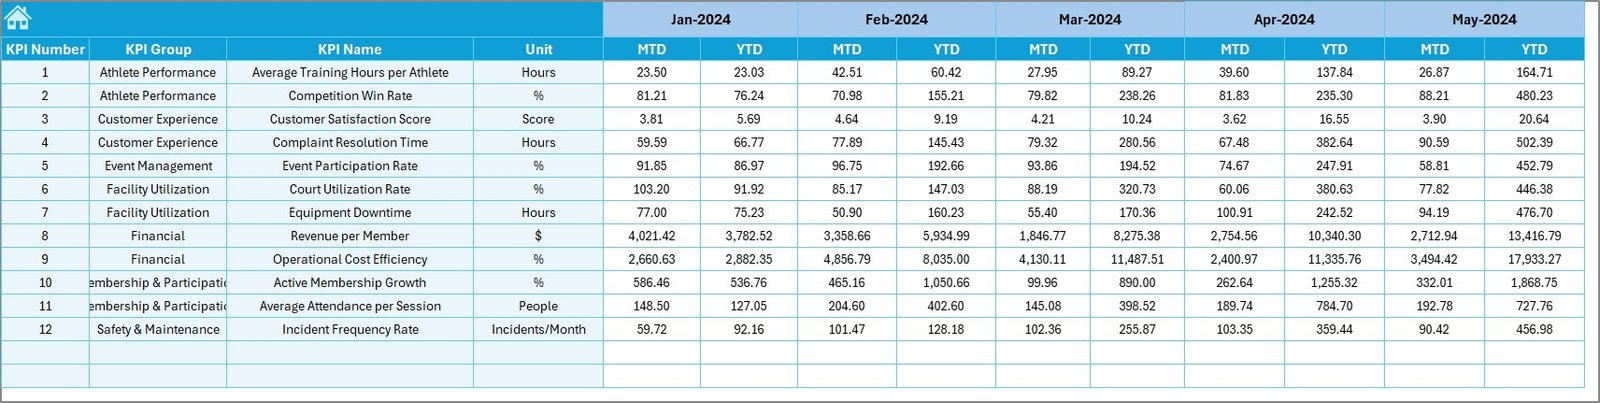
📈 Real-Time Insights: View Month-to-Date (MTD) and Year-to-Date (YTD) results for Actual, Target, and Previous Year data.
🎯 Performance Indicators: Color-coded arrows highlight growth or decline instantly.
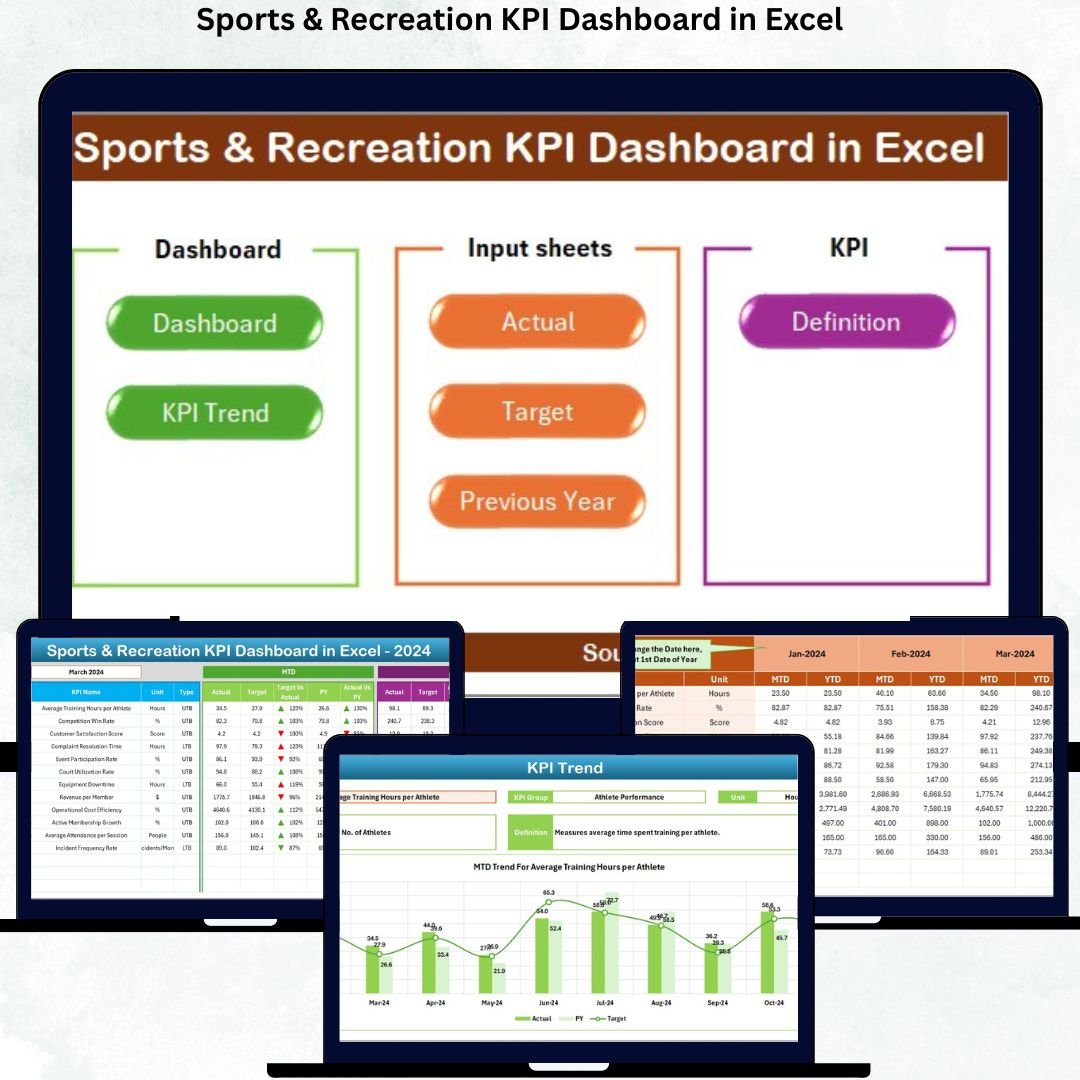
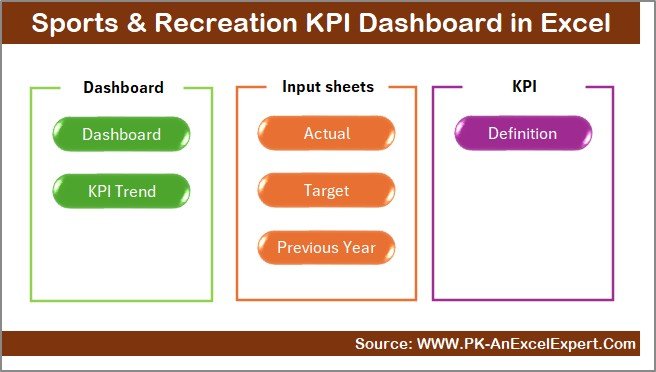
💡 Multi-Sheet System: Includes 7 structured sheets — Summary, Dashboard, Trend, Input, Target, Previous Year, and KPI Definition.
📊 KPI Tracking: Monitor metrics like Revenue, Member Retention, Facility Utilization, Profit Margin, and more.
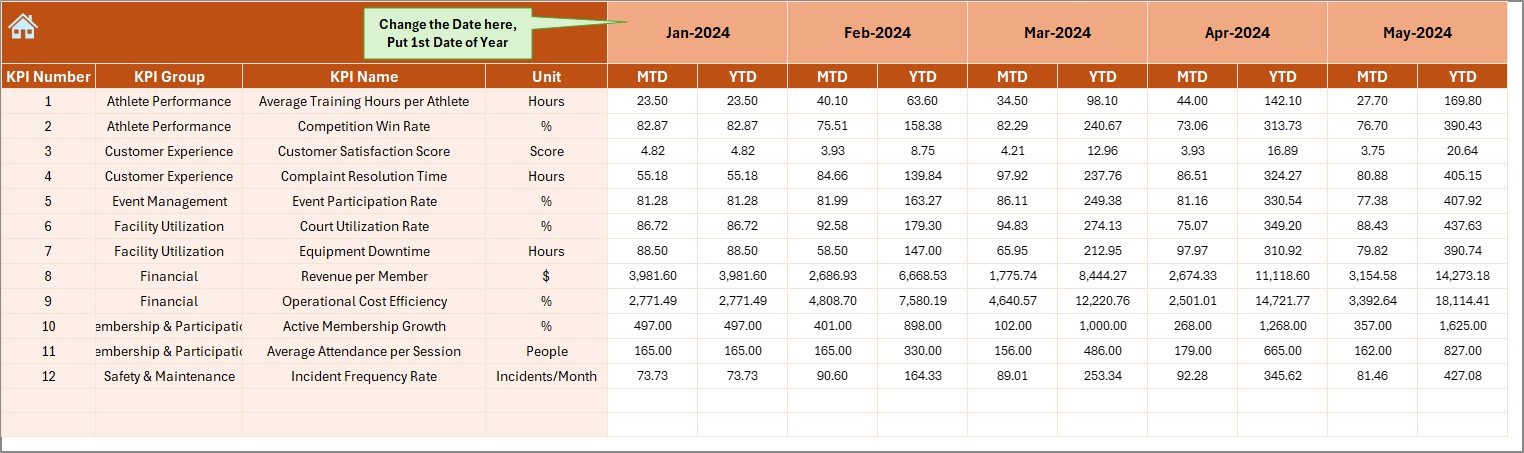
⚙️ Auto-Updating System: Change the reporting month in cell D3 — all visuals update automatically.
👨💼 Manager-Friendly Design: Designed for non-technical users with easy navigation and intuitive data entry.
💾 Completely Excel-Based: No add-ins, macros, or installations needed — works perfectly on both Windows and Mac.
📦 What’s Inside the Sports & Recreation KPI Dashboard
The dashboard contains 7 professionally designed Excel sheets, each serving a specific function:
1️⃣ Summary Page – A clean control center with navigation buttons for quick access.
2️⃣ Dashboard Sheet – Displays MTD & YTD KPI performance with conditional formatting.
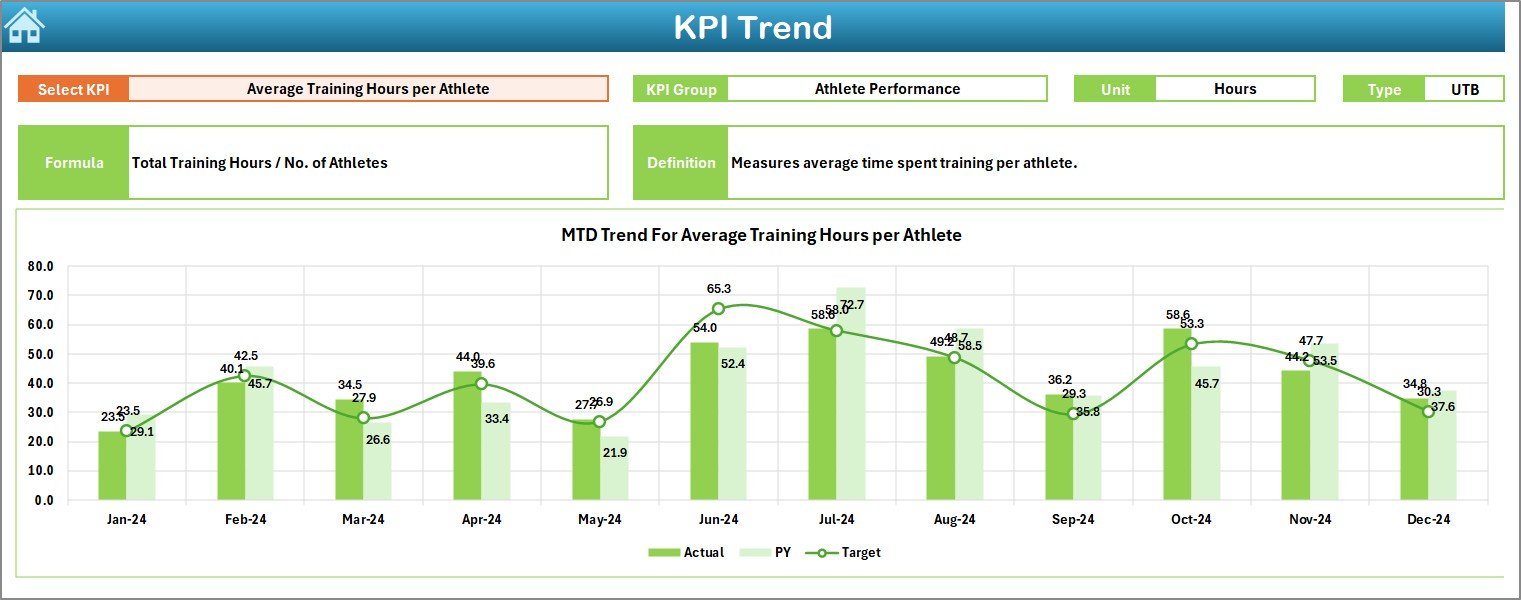
3️⃣ Trend Sheet – Provides historical performance charts to track improvement trends.
4️⃣ Actual Input Sheet – Enter monthly and yearly actual values with auto-calculation.
5️⃣ Target Sheet – Define your MTD and YTD performance benchmarks.
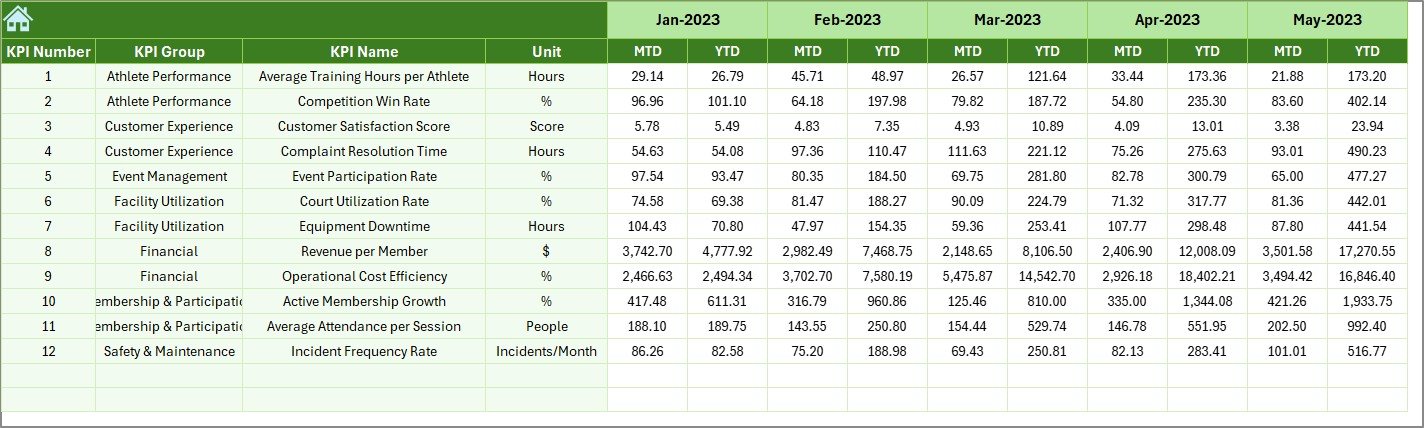
6️⃣ Previous Year Sheet – Compare results with the prior year’s performance.
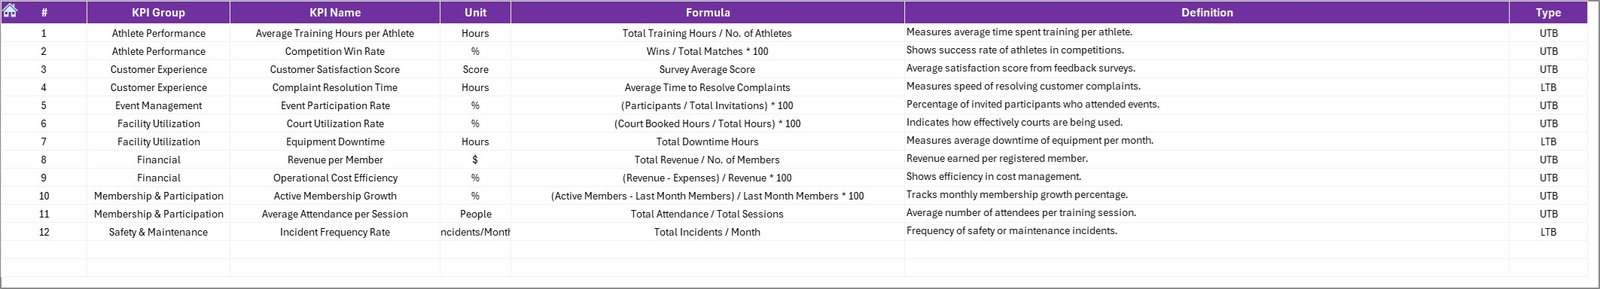
7️⃣ KPI Definition Sheet – Maintain a clear list of KPIs, their formulas, and types (UTB or LTB).
Each sheet is linked seamlessly, ensuring smooth data flow and automatic updates across the workbook.
🧠 How to Use the Sports & Recreation KPI Dashboard
Using this dashboard is as easy as 1-2-3! 🏋️♀️
1️⃣ Download the Dashboard from NextGenTemplates.com.
2️⃣ Enter your KPI Data: Fill in the Actual, Target, and Previous Year values.
3️⃣ Select Month in Cell D3: Instantly view the updated performance.
4️⃣ Analyze Results: Review charts and KPI cards for actionable insights.
5️⃣ Customize as Needed: Modify KPIs, formulas, or visuals to match your organization’s style.
That’s it — no macros, no coding, and no complications. Excel does all the heavy lifting for you!
👥 Who Can Benefit from This Dashboard
This dashboard is ideal for:
🏟️ Sports Club Managers: Track attendance, memberships, and events with precision.
💪 Fitness Center Owners: Monitor revenue, retention, and performance trends.
🎯 Recreation Department Heads: Evaluate programs and facilities for better community engagement.
📊 Academy Administrators: Analyze coaching efficiency and participant performance.
💼 Consultants & Analysts: Use it to create professional reports for clients.
🧾 Municipalities or NGOs: Oversee community programs and recreational KPIs easily.
No matter your role, this tool ensures your decisions are data-driven and effective.
📢 Why Choose This Excel Dashboard?
-
Save Time: Stop creating manual reports every month — automate everything.
-
Make Smarter Decisions: Instantly see where performance stands vs targets.
-
Boost Transparency: Share performance data across your team easily.
-
Be Budget-Friendly: No BI software cost — all within Excel!
This Excel dashboard transforms everyday management into a data-smart, insight-driven process that improves efficiency and engagement.
Click here to read the detailed blog post
Watch the step-by-step video tutorial:


Reviews
There are no reviews yet.