Managing solar park performance should not feel complicated. Yet many renewable energy organizations still rely on scattered reports, manual calculations, and disconnected spreadsheets. As solar energy production scales rapidly, operators need faster insights, accurate monitoring, and smarter decision-making tools.
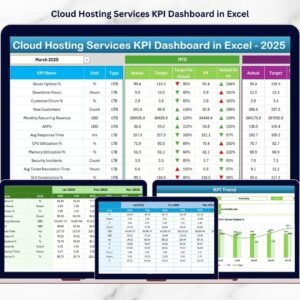
That’s why we created the Solar Parks KPI Dashboard in Excel — a powerful, ready-to-use performance monitoring solution designed specifically for solar park operations. This interactive Excel dashboard centralizes operational, technical, and financial KPIs into one easy-to-use system so you can track performance, compare targets, and improve efficiency without investing in expensive software.
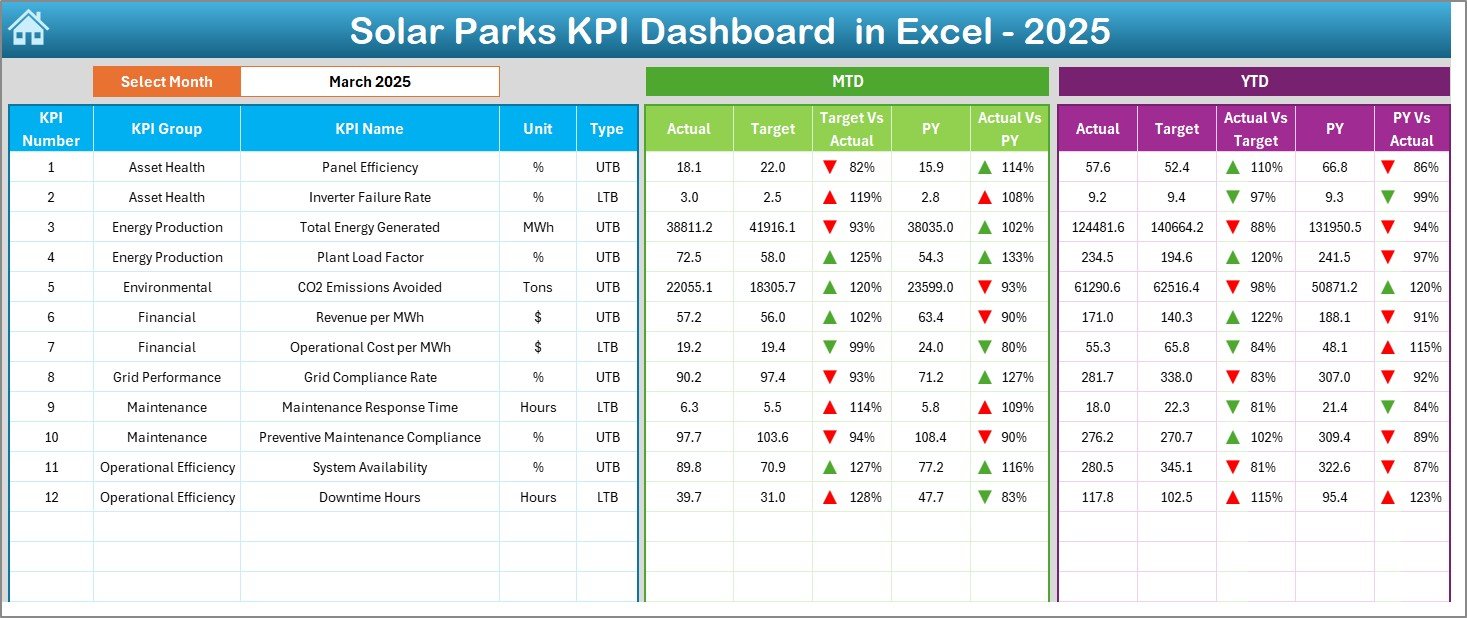
Instead of spending hours preparing reports, this dashboard transforms raw solar plant data into meaningful visual insights. With automated calculations, dynamic month selection, and performance indicators, managers instantly understand plant health and operational performance.
Whether you manage a single solar facility or multiple renewable energy assets, this dashboard helps you monitor energy production, maintenance efficiency, and financial performance in one structured environment.
🌞 Key Features of Solar Parks KPI Dashboard in Excel
✅ Interactive dashboard with dynamic month selection
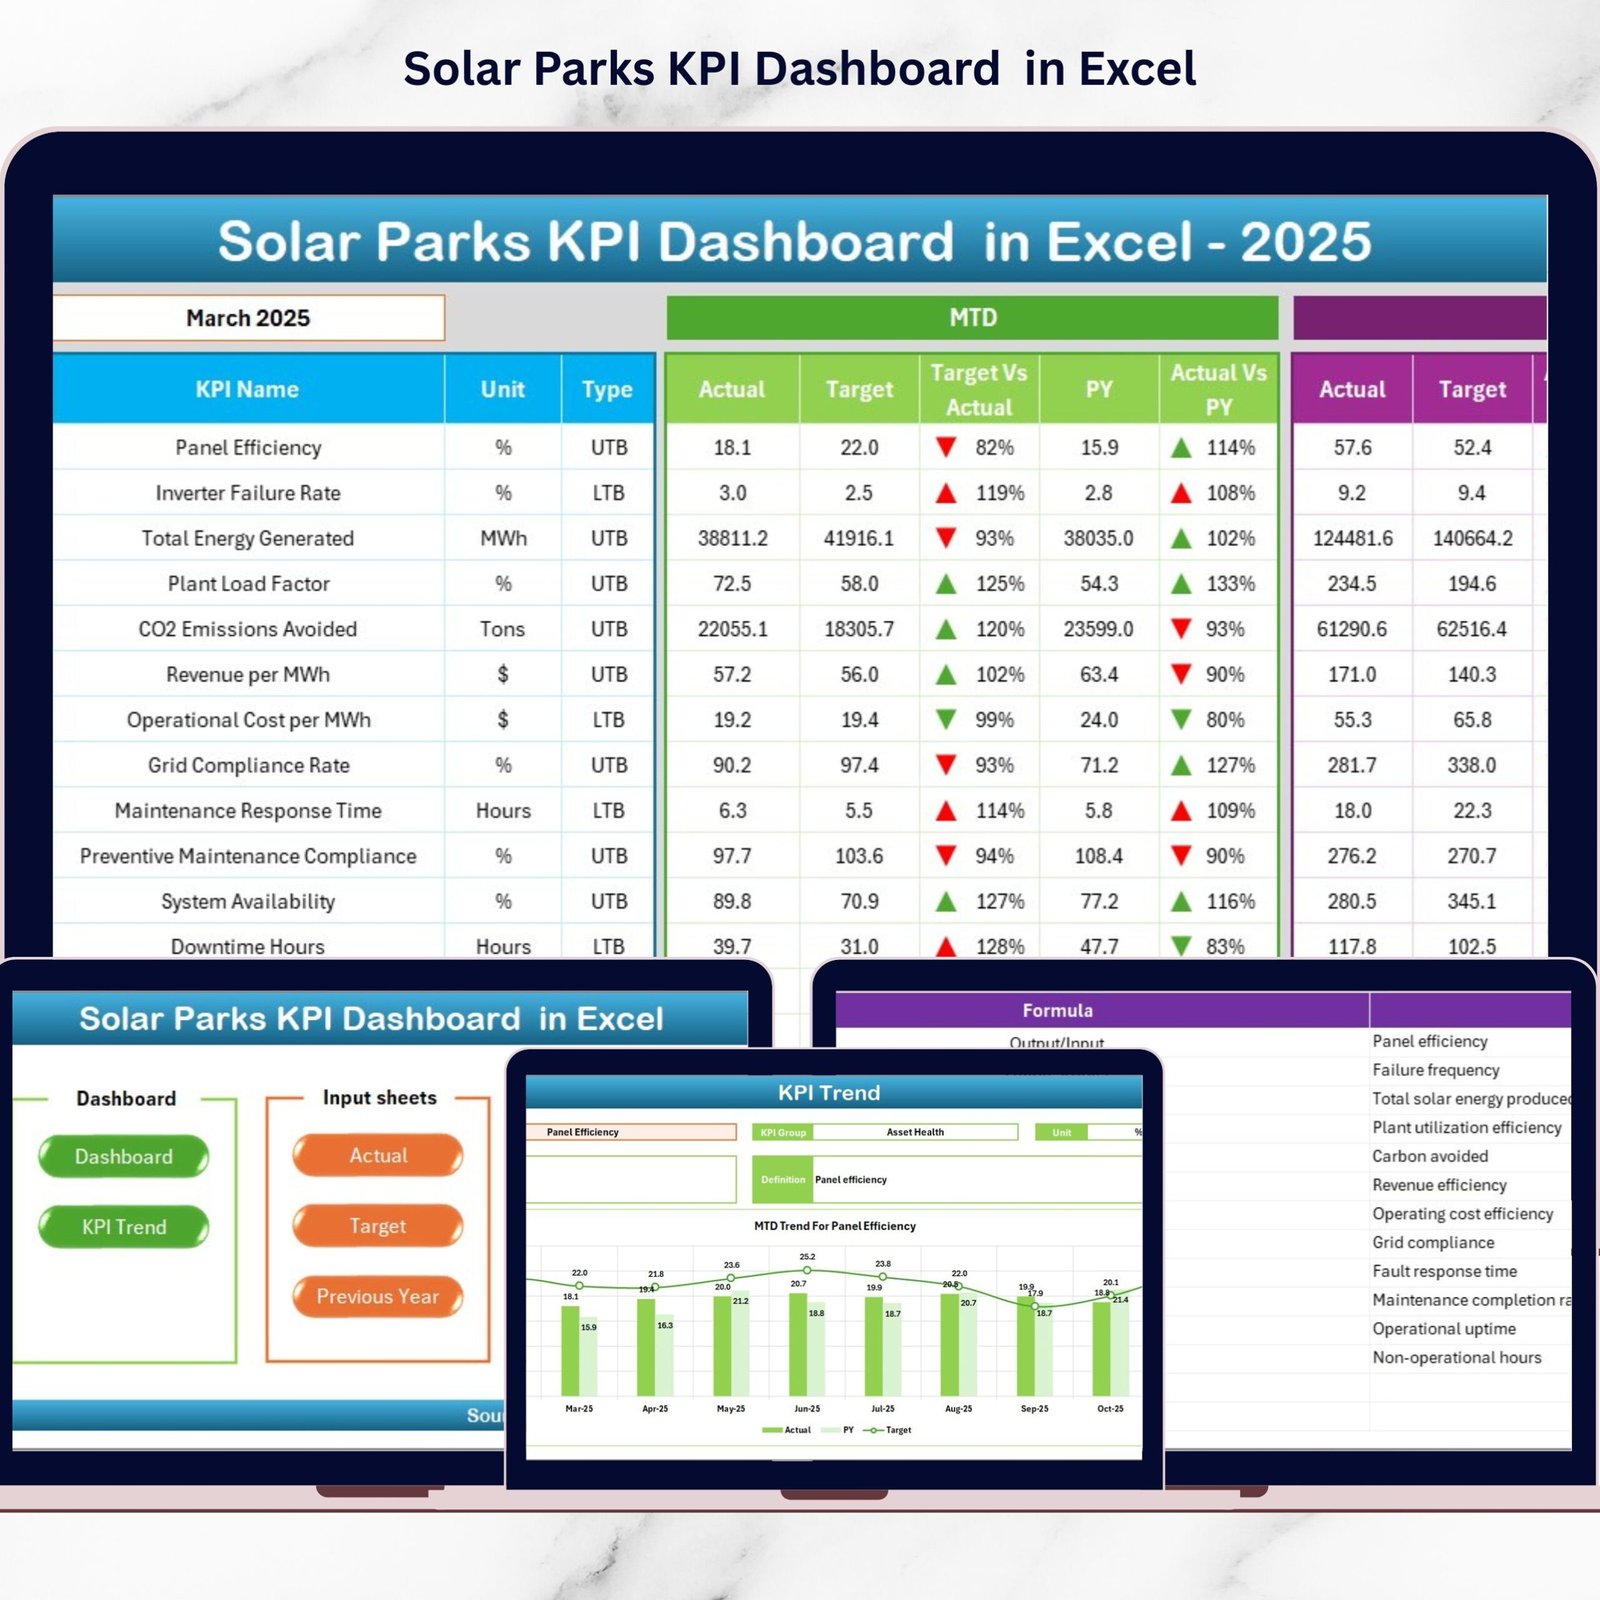
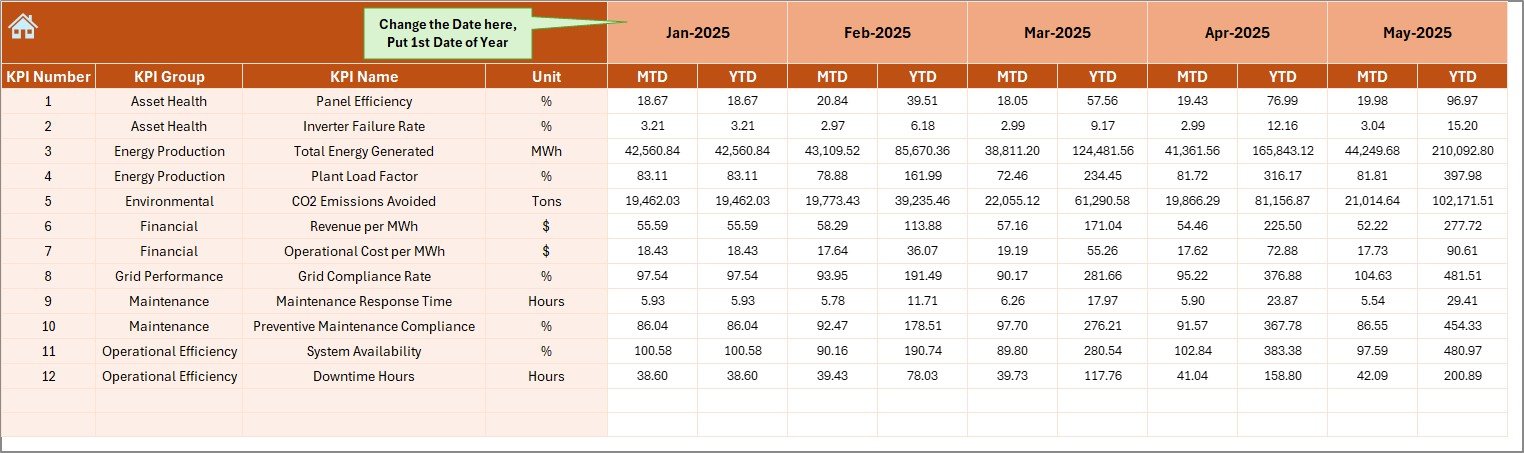
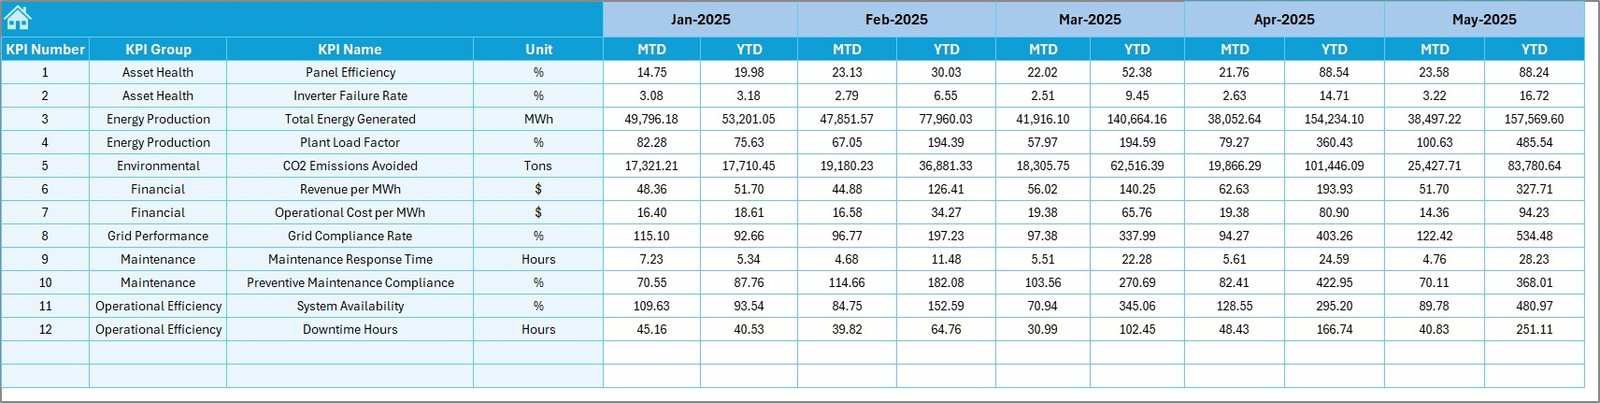
✅ MTD and YTD performance tracking in one screen
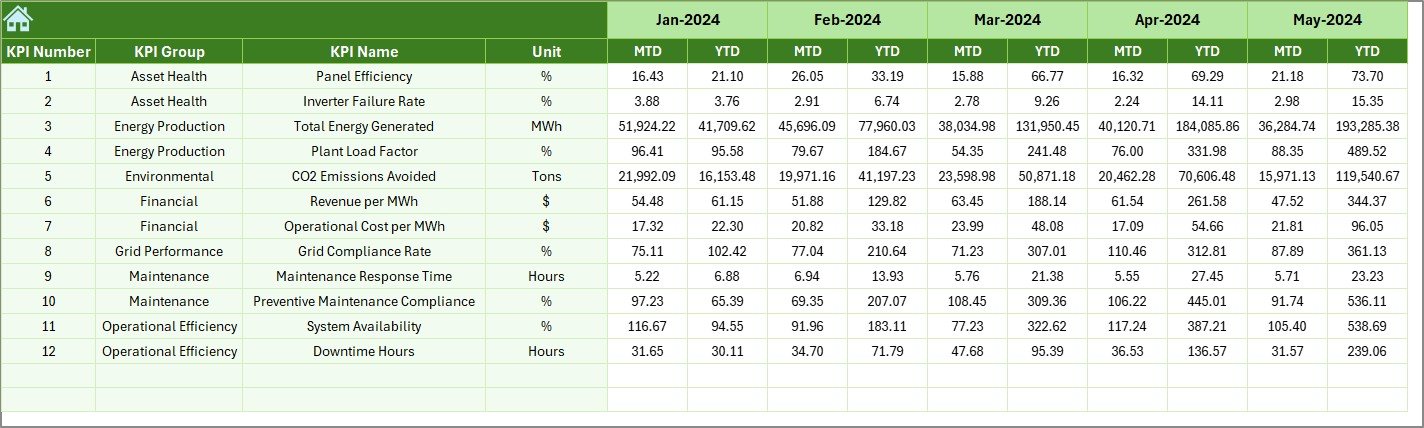
✅ Target vs Actual and Previous Year comparison
✅ Visual performance indicators with up/down arrows
✅ Automated calculations and instant dashboard updates
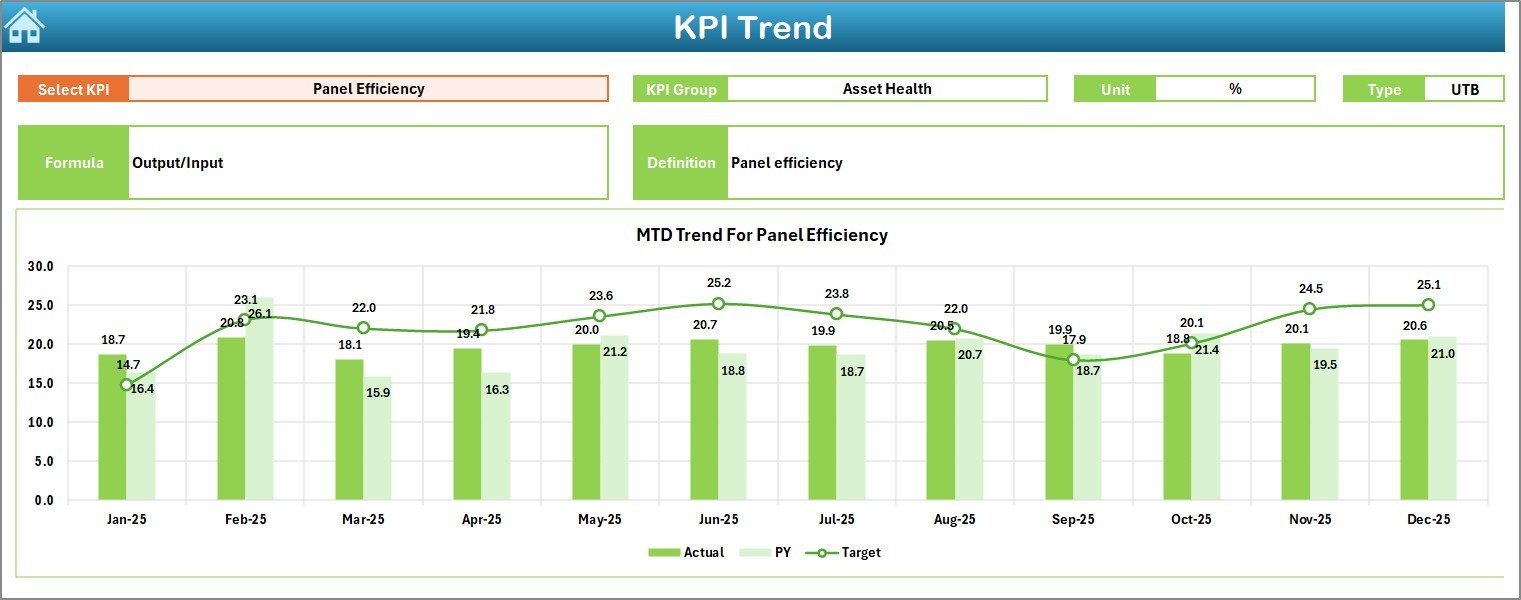
✅ KPI trend analysis with performance charts
✅ Centralized KPI definition and documentation system
✅ Easy navigation through structured worksheets
The dashboard simplifies complex solar performance monitoring into clear visuals, allowing decision-makers to act faster and smarter.
📊 What’s Inside the Solar Parks KPI Dashboard in Excel
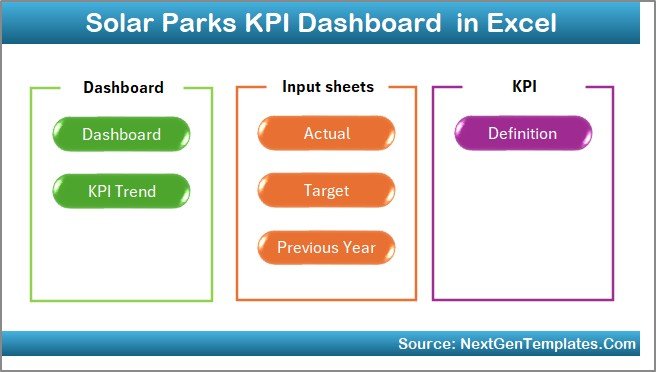
This ready-to-use Excel template includes 7 professionally structured worksheets:
-
Summary Page – Navigation hub for quick sheet access
-
Dashboard Sheet – Main KPI performance overview
-
Trend Sheet – KPI trend and comparison analysis
-
Actual Numbers Input Sheet – Centralized data entry area
-
Target Sheet – KPI goal planning and benchmarking
-
Previous Year Numbers Sheet – Historical comparison tracking
-
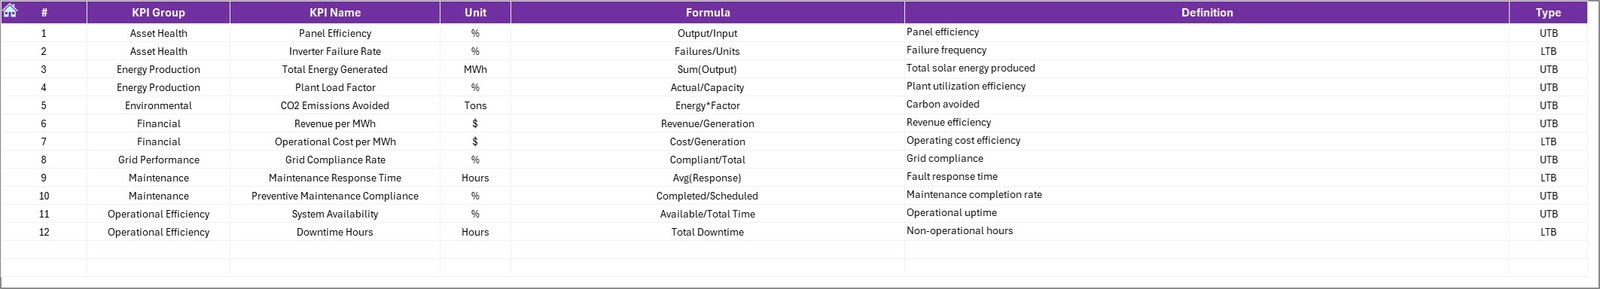
KPI Definition Sheet – KPI master database with formulas and definitions
Each sheet plays a specific role to ensure smooth workflow and organized data management.
⚙️ How to Use the Solar Parks KPI Dashboard in Excel
Using the dashboard is simple and requires no advanced Excel skills:
1️⃣ Define KPIs in the KPI Definition Sheet
2️⃣ Enter monthly and yearly targets
3️⃣ Add previous year performance data
4️⃣ Input MTD and YTD actual values
5️⃣ Select the desired month from the dashboard dropdown
6️⃣ Analyze performance trends and comparisons instantly
Once data is entered, the dashboard automatically updates visuals and performance indicators, saving time and eliminating manual reporting.
👥 Who Can Benefit from This Solar Parks KPI Dashboard?
This dashboard is designed for professionals across the renewable energy ecosystem:
🌞 Solar Park Operators monitoring energy efficiency
📈 Renewable Energy Companies tracking plant performance
⚙️ Operations Managers improving maintenance planning
💰 Financial Analysts evaluating profitability metrics
📊 Energy Consultants providing performance insights
🏢 Management Teams seeking centralized reporting
Because Excel is universally accessible, teams can implement this solution immediately without technical barriers.
The Solar Parks KPI Dashboard in Excel helps organizations move from reactive management to proactive performance optimization. Instead of guessing operational outcomes, you gain measurable insights backed by structured data.
By combining automation, visualization, and KPI standardization, this template empowers solar energy organizations to improve efficiency, reduce downtime, and maximize energy output — all within a familiar Excel environment.
If you want clearer visibility, faster reporting, and smarter operational control, this dashboard becomes your complete solar performance management solution.