In today’s mission-driven world, social service organizations must measure their impact with clarity, accuracy, and transparency. Whether you’re a non-profit, government department, or community development agency, performance tracking is key to achieving meaningful outcomes.
The Social Services KPI Scorecard in Excel provides a powerful yet simple solution for managing performance metrics, evaluating progress, and improving accountability 📊✨.
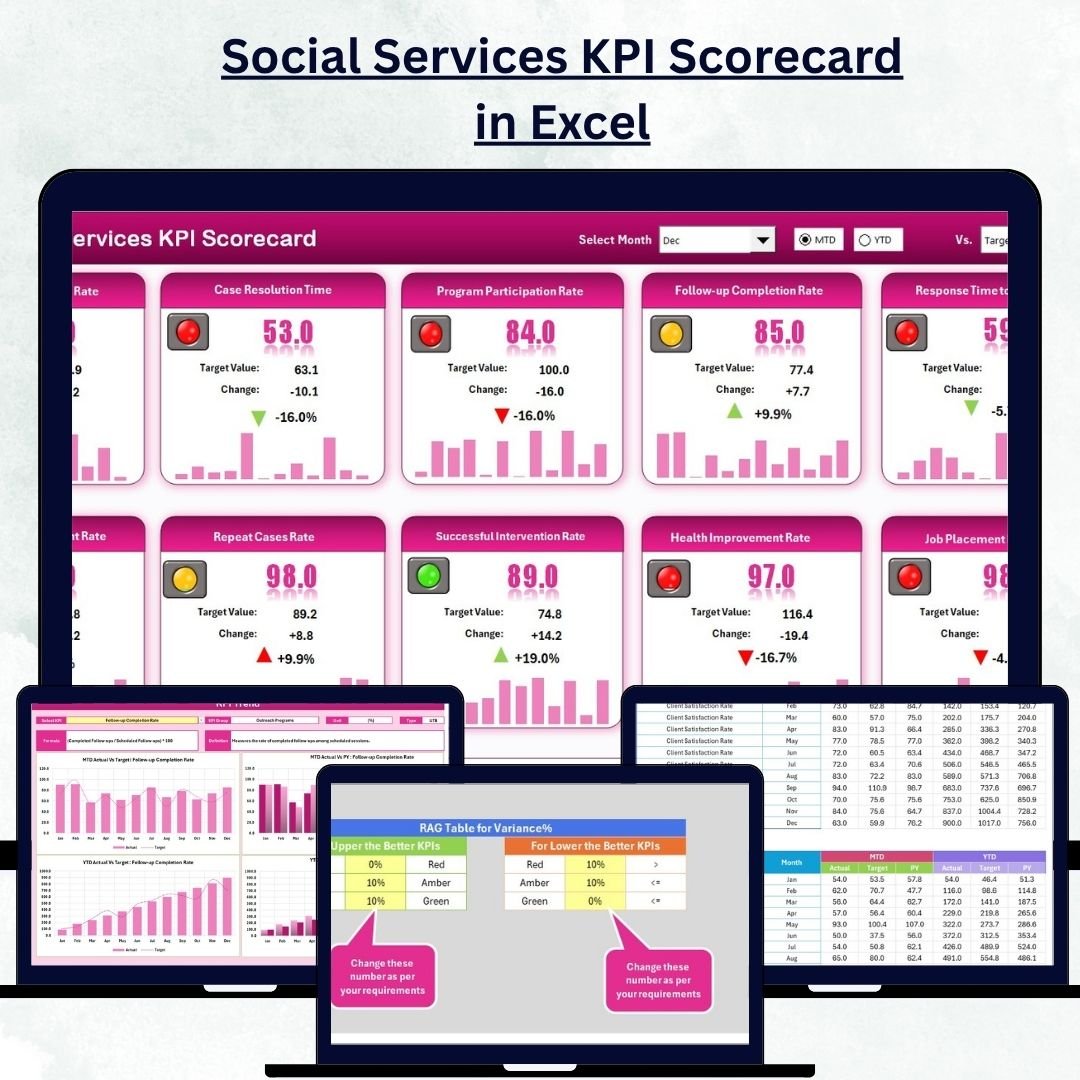
Built entirely in Microsoft Excel, this ready-to-use scorecard helps you track Month-to-Date (MTD) and Year-to-Date (YTD) results, analyze trends, and identify areas that need attention — all without complex BI tools or expensive software.
⚙️ Key Features of the Social Services KPI Scorecard in Excel
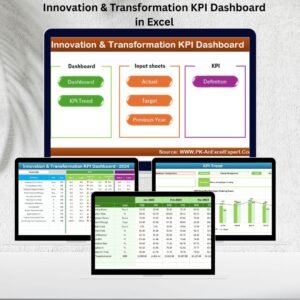
📊 4 Pre-Built Worksheets – Scorecard, KPI Trend, Input Data, and KPI Definition.
🎯 MTD & YTD Tracking – View month-to-month and cumulative annual performance.
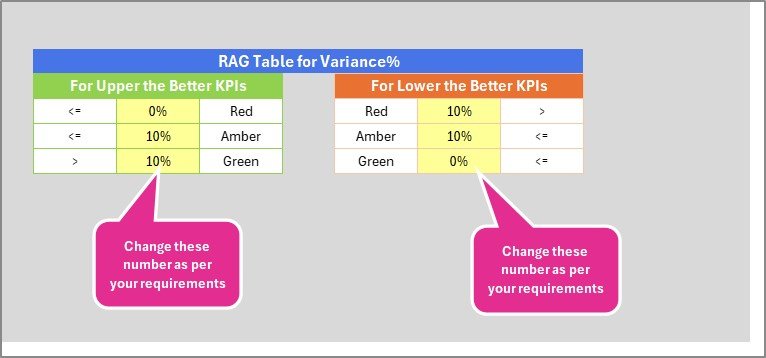
🟢 Visual Indicators – Green, yellow, and red color codes for instant insights.
📈 Trend Analysis Charts – Monitor KPI progress and identify patterns.
💡 Dynamic Dropdowns – Select any month or KPI to update visuals automatically.
🧾 KPI Metadata – Built-in details for formula, unit, and definition.
🔒 Protected Structure – Prevents accidental overwriting of formulas.
💼 Fully Customizable – Add or modify KPIs based on your organization’s needs.
💰 Affordable & Accessible – No BI tool required — runs entirely in Excel.
📦 What’s Inside the Scorecard Template
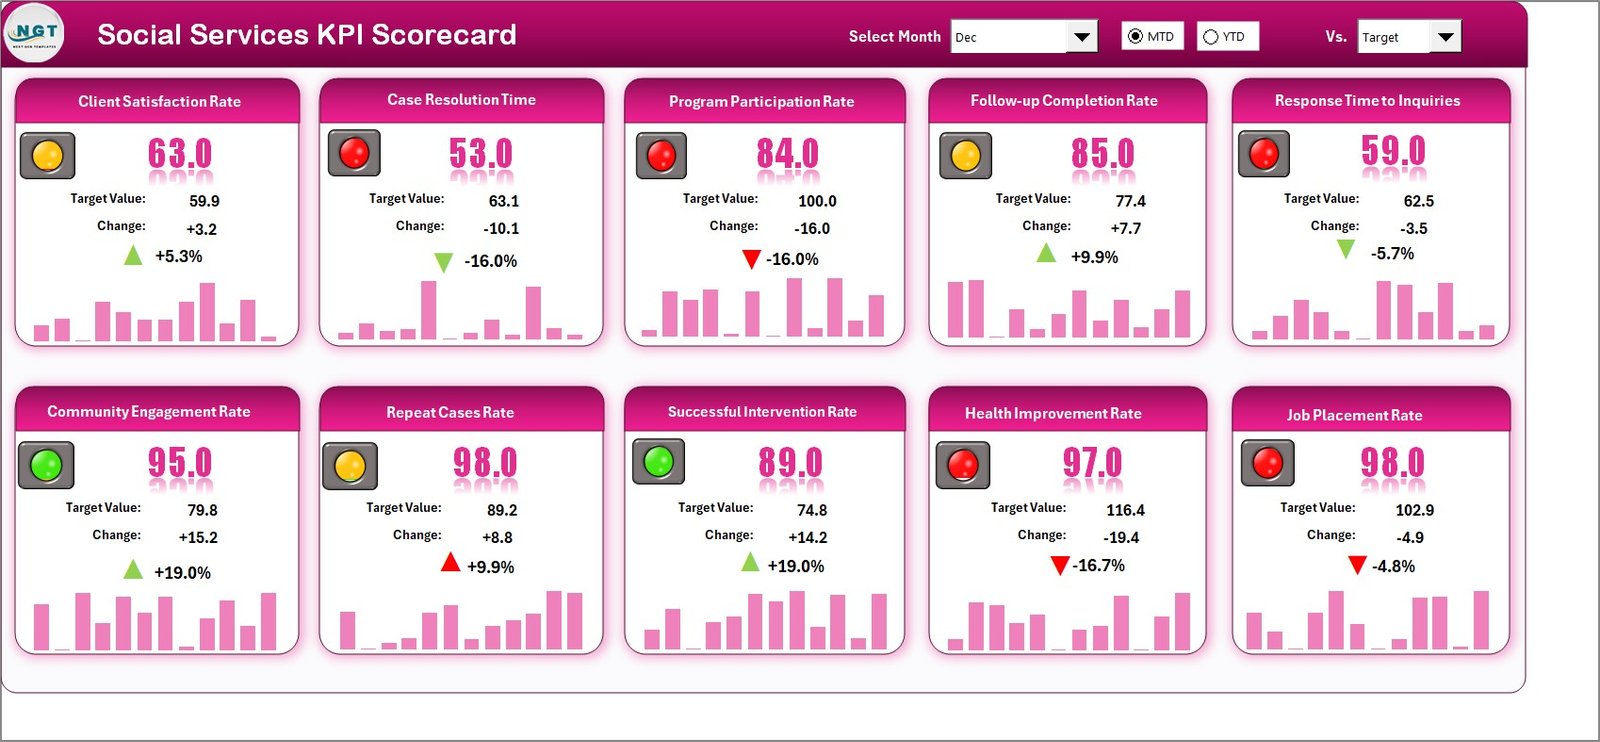
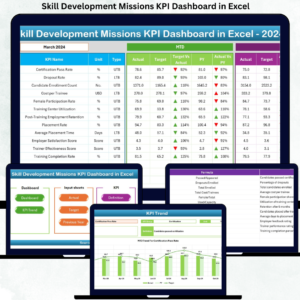
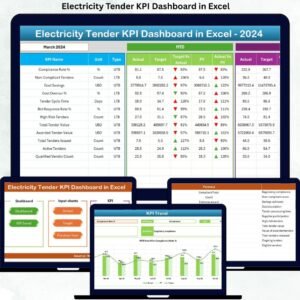
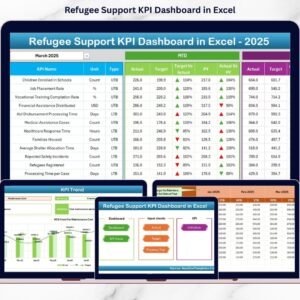
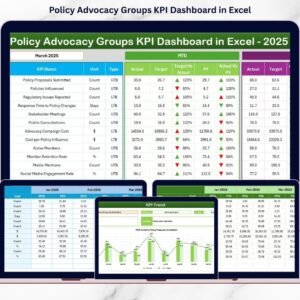
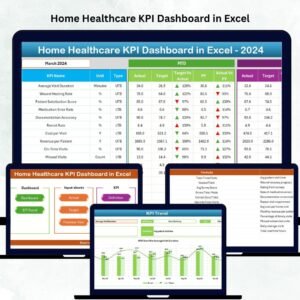
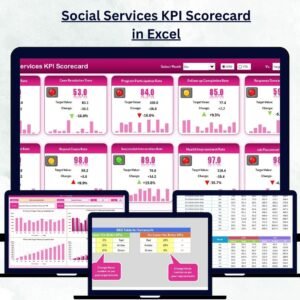
1️⃣ Scorecard Sheet – Your Main Dashboard
This is the heart of the template. It provides a bird’s-eye view of your organization’s monthly and yearly performance.
✨ Features Include:
-
Dropdown to select the desired Month and Time Period (MTD/YTD).
-
Actual vs Target columns for each KPI.
-
Color-coded indicators (🟢 🟡 🔴) showing whether KPIs are on track, at risk, or below target.
-
Comprehensive list of KPIs with quick-glance metrics.
This helps leadership teams and program managers see performance trends instantly — without manual calculations.
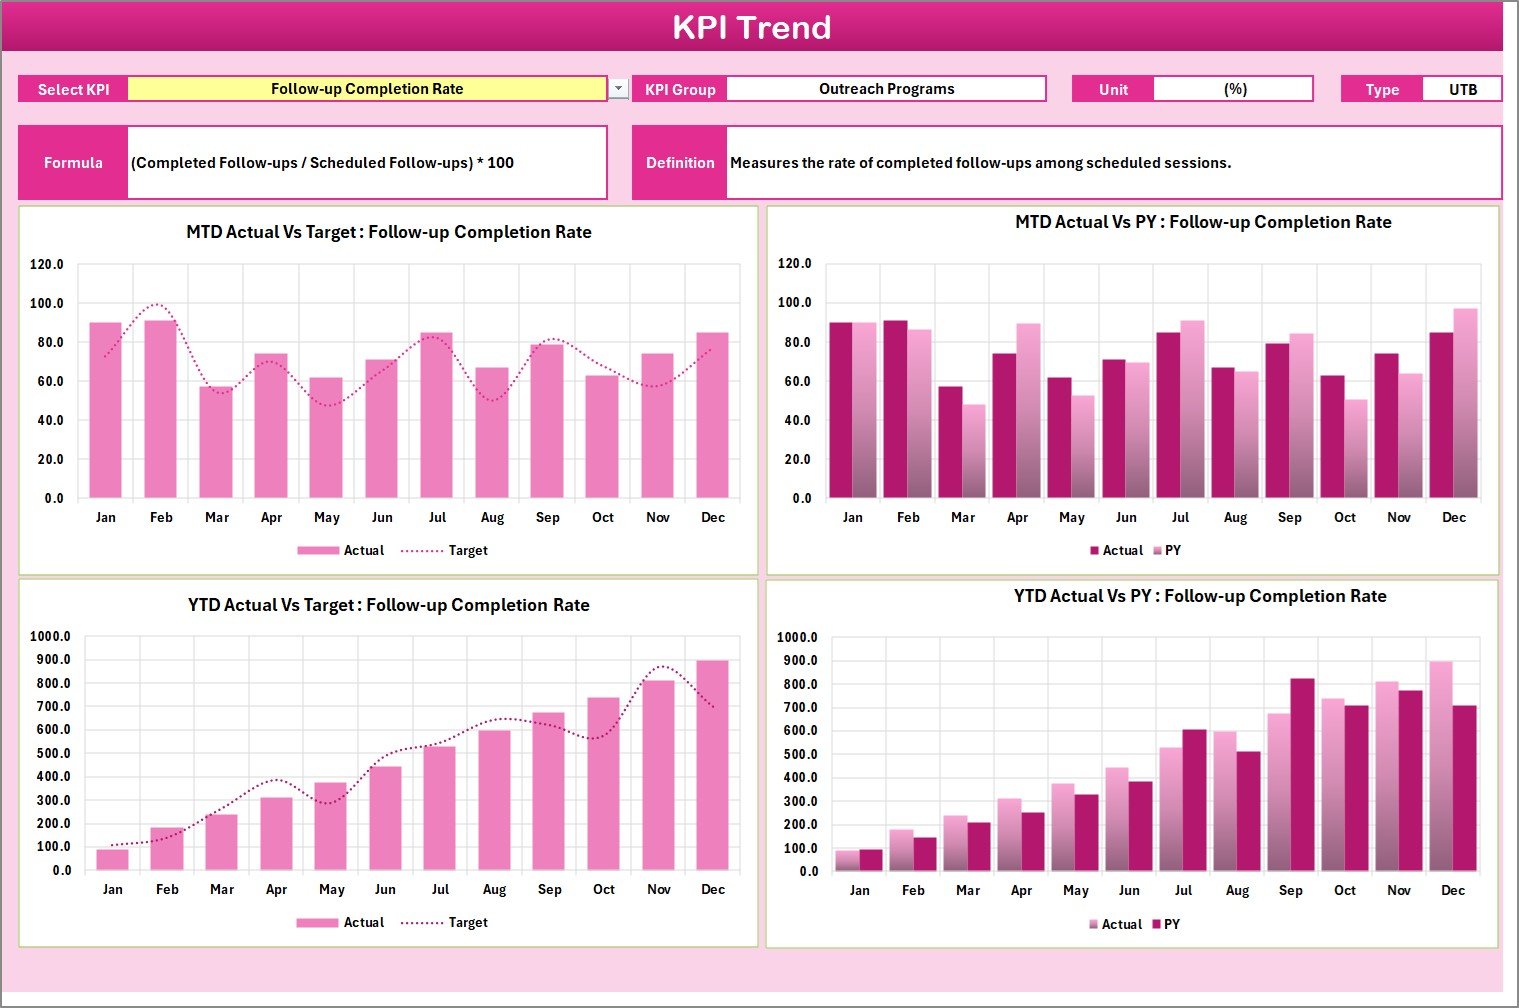
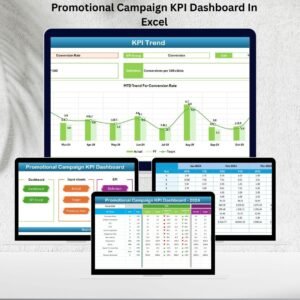
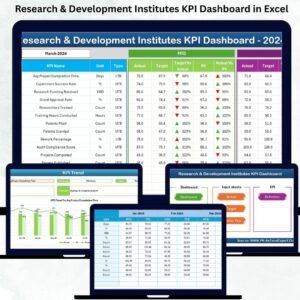
2️⃣ KPI Trend Sheet – Visualize Progress Over Time
Dive deeper into performance analysis using interactive trend charts.
💡 Features Include:
-
Dropdown (Cell C3) to select any KPI.
-
Auto-display of KPI metadata (Group, Unit, Formula, and Type).
-
MTD and YTD trend charts for Actual, Target, and Previous Year data.
-
Clear visual insights into whether performance is improving or declining.
This page makes it easy to track how funding utilization, beneficiary outreach, or community engagement changes over time.
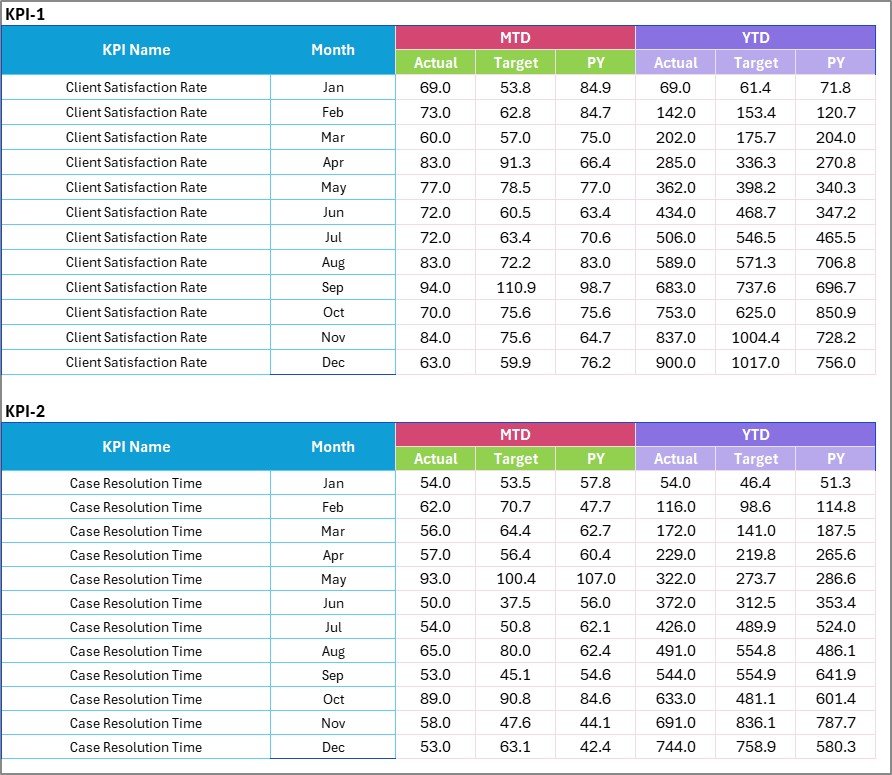
3️⃣ Input Data Sheet – Centralized Data Entry
This sheet is the backbone of your scorecard.
🧮 Features Include:
-
Enter Actual, Target, and Previous Year values monthly.
-
Automatically feeds data into Scorecard and Trend sheets.
-
Easy to expand — add more KPIs without breaking formulas.
It’s simple, reliable, and designed for users of all skill levels.
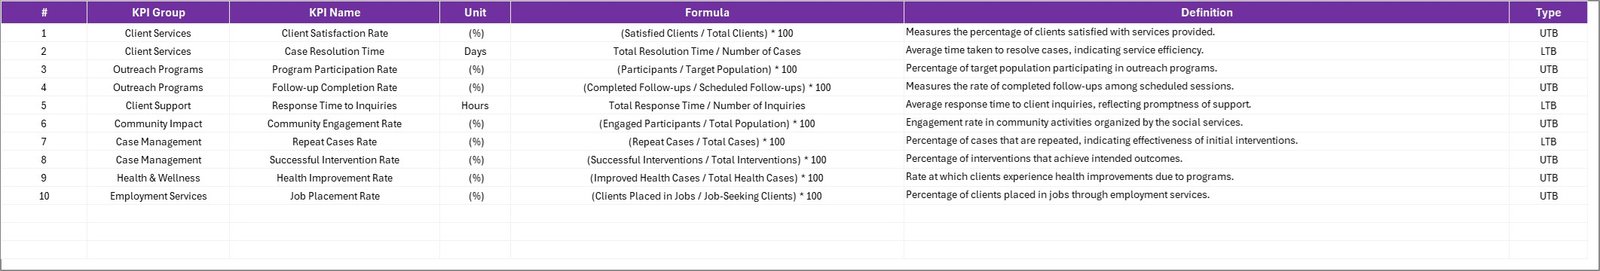
4️⃣ KPI Definition Sheet – Transparency & Clarity
A clear understanding of KPIs ensures consistent reporting across teams.
📘 Includes Columns For:
-
KPI Name
-
KPI Group (e.g., Funding, Beneficiary Support, Outreach, Operations)
-
Unit of Measurement (%, Count, USD, etc.)
-
Formula for Calculation
-
KPI Definition
This tab acts as your reference guide, helping everyone understand what each KPI represents.
💡 Why Organizations Need This Scorecard
🏢 Centralized Monitoring: Track performance across departments and programs.
🎯 Data-Driven Insights: Identify underperforming areas before they escalate.
🧾 Improved Accountability: Assign KPI ownership and measure team performance.
💬 Clear Reporting: Share easy-to-read visuals with stakeholders or funders.
⚙️ Operational Efficiency: Reduce time spent on manual reporting.
By using this scorecard, your organization gains the tools to turn data into decisions and results into measurable impact.
🌟 Advantages of the Social Services KPI Scorecard in Excel
✅ Real-Time Performance Overview: See your MTD and YTD achievements instantly.
✅ Visual Storytelling: Charts and colors make complex data intuitive.
✅ Customizable Framework: Modify KPIs, add programs, or adjust formulas.
✅ Collaboration Ready: Easily shareable with teams via cloud storage.
✅ Affordable Alternative: No BI license or technical setup required.
✅ Compliance & Transparency: Keep stakeholders informed with evidence-backed reporting.
🧭 How to Use the Scorecard Effectively
1️⃣ Update KPI Definitions: Add your organization’s key indicators.
2️⃣ Enter Monthly Data: Fill in Actual, Target, and Previous Year values.
3️⃣ Select Month & Period: Choose MTD or YTD view in the Scorecard sheet.
4️⃣ Analyze Performance: Use color cues and charts to interpret results.
5️⃣ Review Trends: Track improvements using the KPI Trend sheet.
In just a few minutes, you’ll have a full performance dashboard ready for review meetings or donor reports.
👥 Who Can Benefit from This Template
-
Non-Profit Organizations 🫶
-
Government Departments 🏛️
-
Community Welfare Programs 🤝
-
Educational & Healthcare NGOs 🏥
-
Social Development Projects 🌍
No matter your mission, this tool empowers teams to measure impact, track progress, and enhance accountability.
🧠 Conclusion
The Social Services KPI Scorecard in Excel is more than a reporting tool — it’s a performance management framework that keeps your organization goal-focused and data-driven.
By using this template, you’ll gain full visibility into operations, improve efficiency, and demonstrate results with confidence.
Start tracking your organization’s impact today — and take the next step toward measurable social success 💙📊.


Reviews
There are no reviews yet.