Smart Parking Systems KPI Dashboard face increasing parking challenges as vehicle numbers continue to rise. Drivers often spend valuable time searching for available parking spaces, which leads to traffic congestion, increased fuel consumption, and frustration. Because of this growing challenge, city authorities and parking management companies must implement smart monitoring systems to manage parking infrastructure efficiently.
However, many organizations still rely on manual reports and scattered spreadsheets to track parking performance. As a result, decision-makers struggle to analyze parking utilization, revenue performance, and operational efficiency.
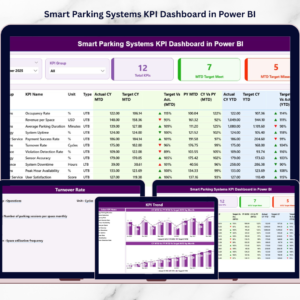
This is where the Smart Parking Systems KPI Dashboard in Power BI becomes a powerful solution.
This ready-to-use Power BI dashboard allows parking operators, transportation authorities, and smart city planners to monitor parking system performance using interactive visual analytics. By combining Excel data sources with Power BI visualization, the dashboard transforms raw parking data into clear performance insights.
With dynamic charts, KPI indicators, and trend analysis, organizations can easily evaluate parking utilization, monitor revenue trends, and track operational efficiency.
If your organization wants to improve parking management, reduce congestion, and enhance urban mobility, this dashboard provides a highly effective analytical solution.
🚗 Key Feature of Smart Parking Systems KPI Dashboard in Power BI
This Power BI dashboard includes powerful analytics features designed to monitor smart parking system performance efficiently.
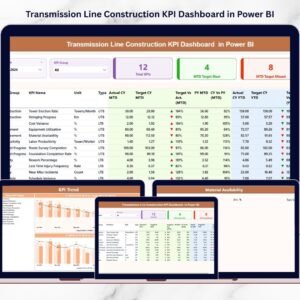
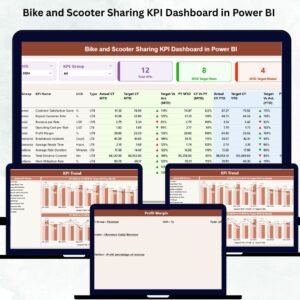
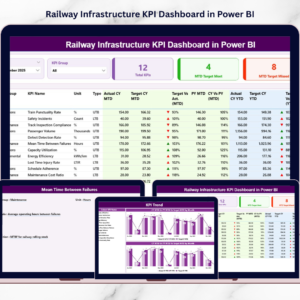
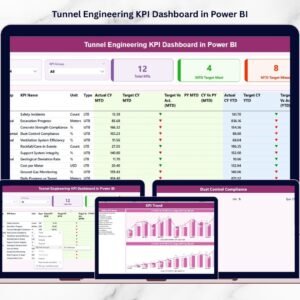
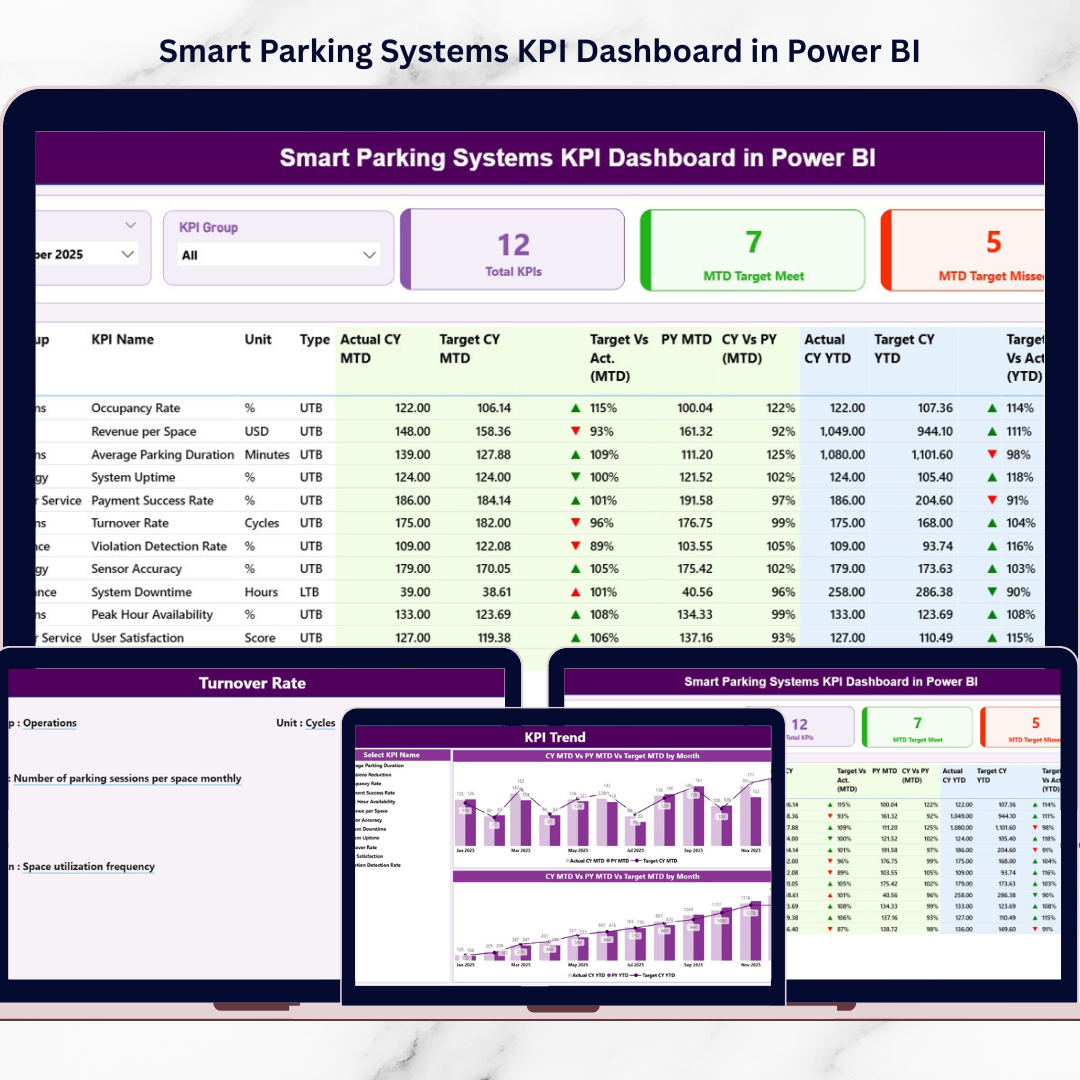
📊 Centralized KPI Monitoring Dashboard – Track all parking performance indicators in one interactive interface.
📅 Month-Based Data Filtering – Use the month slicer to analyze parking performance for specific time periods.
📈 KPI Group Filtering – Analyze KPIs by operational categories such as revenue, system performance, or parking operations.
🎯 KPI Target Achievement Monitoring – Instantly identify KPIs that meet or miss targets.
📉 Actual vs Target KPI Analysis – Compare real performance with planned targets.
📊 Previous Year Performance Comparison – Evaluate year-over-year performance improvements.
📈 MTD and YTD KPI Monitoring – Track both monthly and cumulative performance trends.
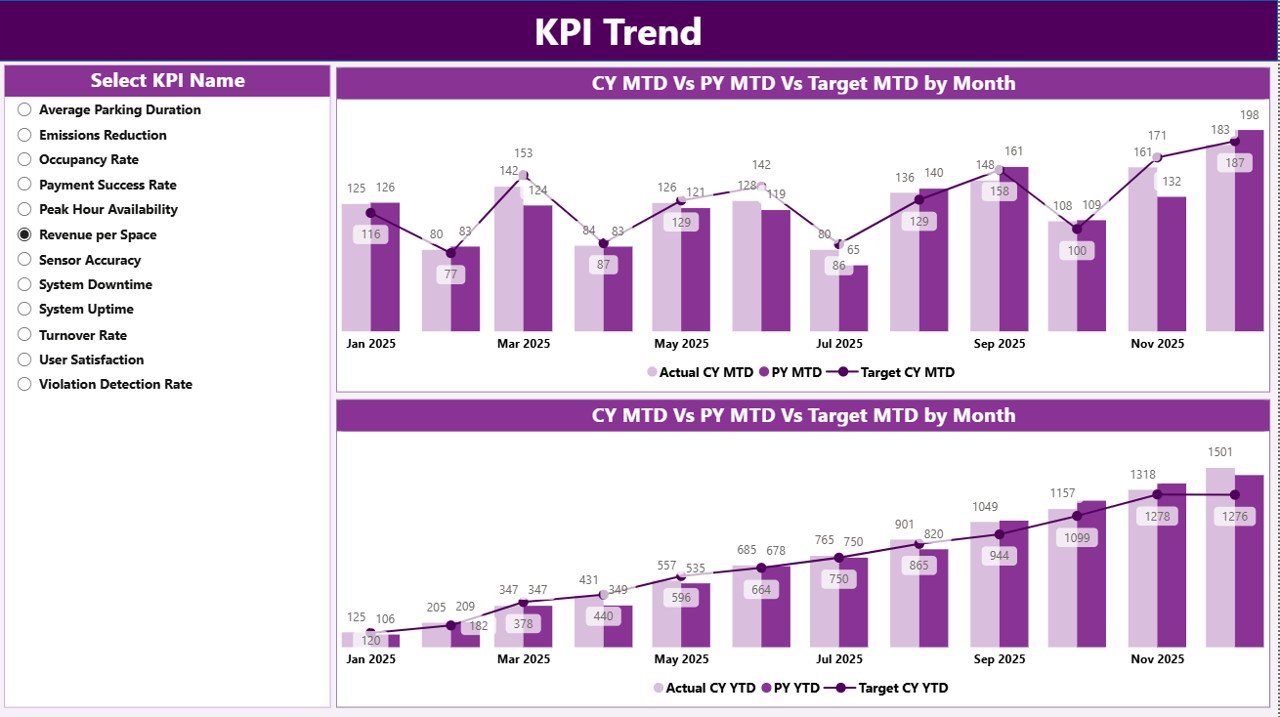
📉 Interactive KPI Trend Analysis Charts – Visual charts help analyze KPI behavior over time.
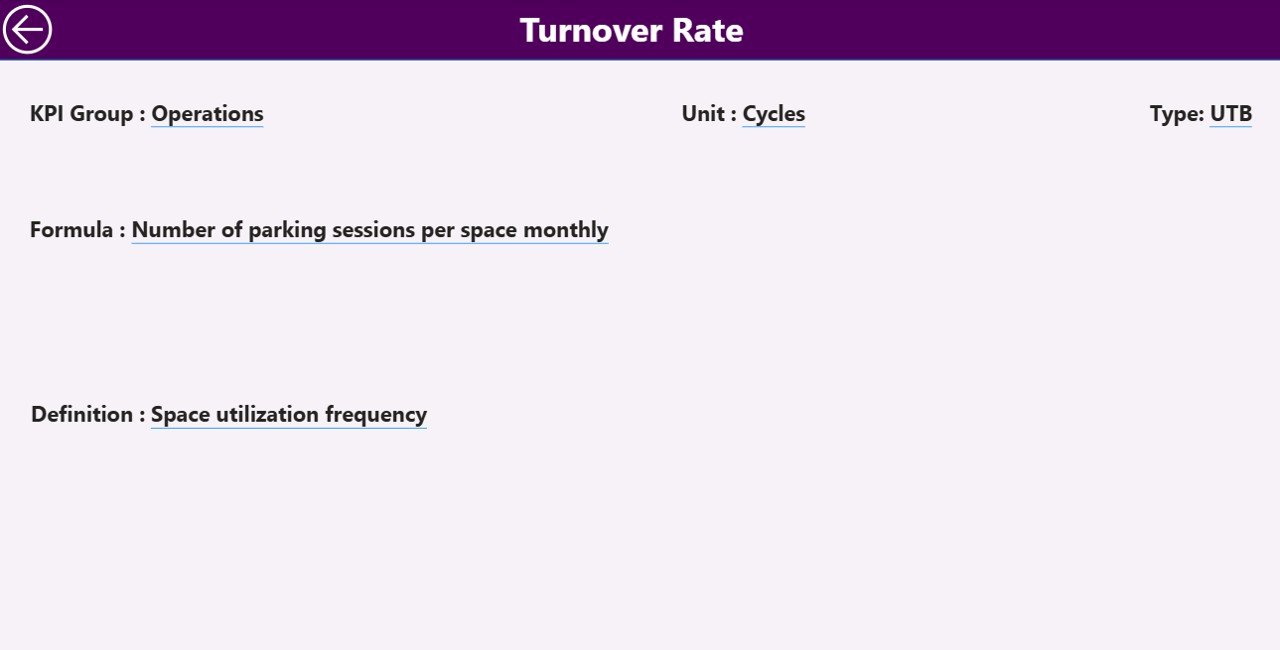
📚 Drill-Through KPI Definition Page – View detailed explanations, formulas, and definitions of each KPI.
Because of these features, city authorities and parking operators gain complete visibility into parking system performance.
📦 What’s Inside the Smart Parking Systems KPI Dashboard in Power BI
This smart parking dashboard is designed using Power BI for visualization and Excel as the data source.
Inside the Power BI file you will find:
✅ Summary Page – Main KPI monitoring dashboard

✅ KPI Trend Page – Trend analysis for selected KPIs
✅ KPI Definition Page – Detailed KPI explanations and formulas
✅ Interactive KPI Cards – Highlight KPI performance status
✅ Dynamic Filters & Slicers – Flexible performance analysis
The dashboard tracks important smart parking metrics such as:
Parking Occupancy Rate
Parking Utilization Percentage
Parking Revenue Trends
Parking Duration Metrics
Parking Space Availability
Traffic Congestion Indicators
System Uptime
Customer Usage Patterns
Because the dashboard organizes these metrics visually, managers can analyze parking performance quickly and identify improvement opportunities.
⚙️ How to Use the Smart Parking Systems KPI Dashboard in Power BI
Using this dashboard is simple and efficient.
1️⃣ Enter parking performance data into the Excel input file.
2️⃣ Update the Input_Actual sheet with current performance data.
3️⃣ Add KPI target values in the Input_Target sheet.
4️⃣ Maintain KPI formulas and definitions in the KPI Definition sheet.
5️⃣ Refresh the Power BI dashboard to update all visuals.
Once refreshed, the dashboard automatically updates charts, KPI indicators, and trend analysis.
Within seconds, managers can evaluate parking system performance and identify operational issues.
👥 Who Can Benefit from This Smart Parking KPI Dashboard
This dashboard is ideal for professionals responsible for managing parking infrastructure and urban mobility systems.
It is especially useful for:
🏙 City Transportation Authorities
🚗 Parking Management Companies
🏗 Infrastructure Managers
📊 Smart City Analysts
🚦 Traffic Management Authorities
🏢 Urban Planning Departments
Because the dashboard combines operational and financial KPIs, multiple departments can use it simultaneously.
💡 Why Organizations Use Smart Parking KPI Dashboards
✔ Centralized parking system performance monitoring
✔ Faster identification of operational inefficiencies
✔ Improved parking space utilization analysis
✔ Better parking revenue monitoring
✔ Data-driven urban mobility planning
✔ Clear KPI performance comparison
✔ Improved smart city infrastructure management
✔ Enhanced parking system transparency
Instead of relying on scattered reports, organizations can manage parking operations using structured analytics and visual insights.
This dashboard transforms parking data into actionable intelligence that helps cities and operators improve parking efficiency and urban mobility.
### Click here to read the Detailed blog post
Visit our YouTube channel to learn step-by-step video tutorials
Youtube.com/@PKAnExcelExpert