Smart Parking Systems KPI Dashboard are facing increasing parking challenges as the number of vehicles continues to grow. Drivers often spend valuable time searching for parking spaces, which leads to traffic congestion, fuel wastage, and frustration. Because of these issues, cities and parking management companies must implement smarter solutions to monitor parking operations efficiently.
However, many organizations still rely on scattered spreadsheets and manual reports to track parking utilization and revenue. As a result, managers struggle to evaluate operational performance and identify improvement opportunities.
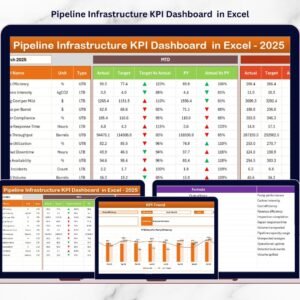
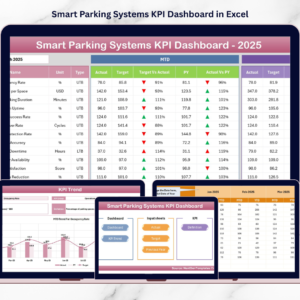
This is where the Smart Parking Systems KPI Dashboard in Excel becomes a powerful management tool.
This ready-to-use Excel dashboard helps organizations monitor parking performance indicators, analyze revenue trends, and evaluate operational efficiency from one centralized platform. Instead of reviewing multiple reports, managers can analyze parking data through visual charts, KPI indicators, and trend analysis.
Because the dashboard uses dynamic Excel formulas, drop-down selections, and automated calculations, parking operators can monitor performance quickly and make smarter decisions.
If you want to improve parking management, optimize revenue, and monitor system efficiency, this dashboard provides a practical and effective solution.
🚗 Key Feature of Smart Parking Systems KPI Dashboard in Excel
This Smart Parking KPI Dashboard includes powerful features designed to monitor parking system performance effectively.
📊 Centralized KPI Dashboard – Monitor all parking performance indicators in one interactive view.
📅 Dynamic Month Selection – Select any month from the dropdown to update the entire dashboard instantly.
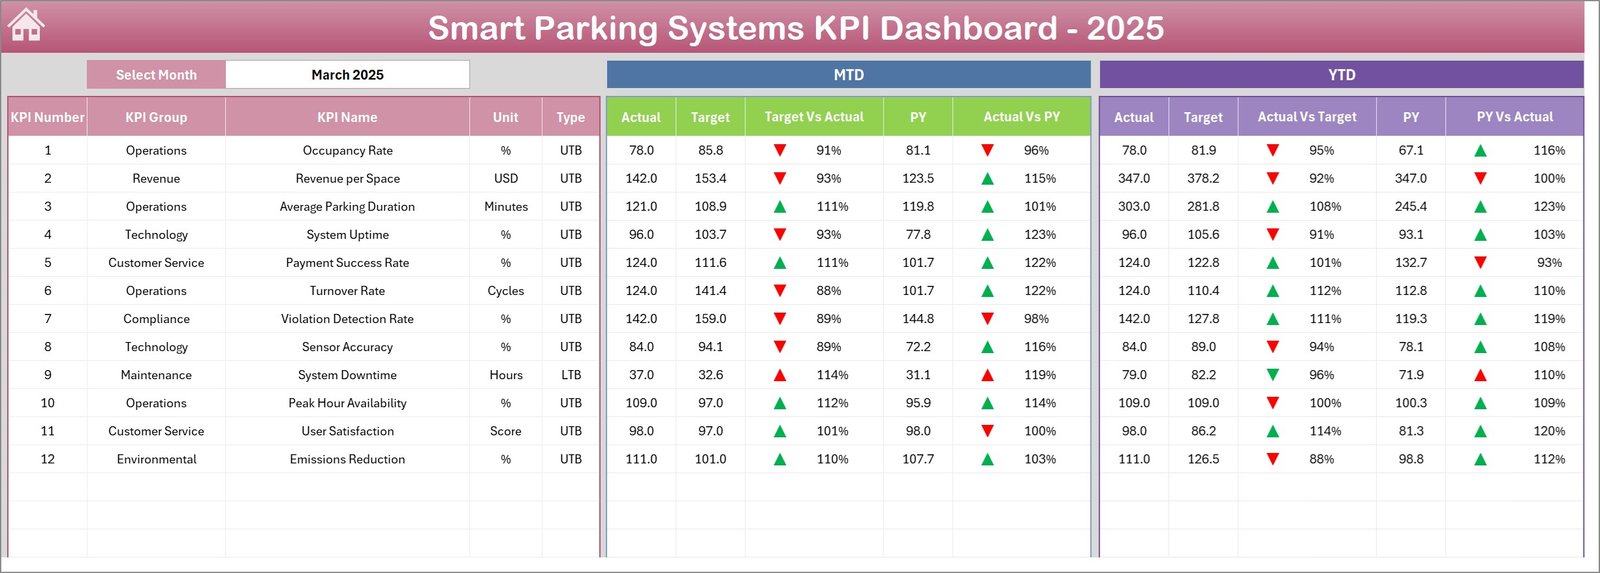
📈 MTD Performance Tracking – Analyze Month-To-Date performance for each parking KPI.
🎯 Target vs Actual Comparison – Evaluate whether parking operations meet performance targets.
📉 Previous Year Comparison – Compare current performance with historical parking data.
📊 YTD Performance Monitoring – Track Year-To-Date performance trends.
🔺 Conditional Formatting Indicators – Green and red arrows quickly show performance improvements or declines.
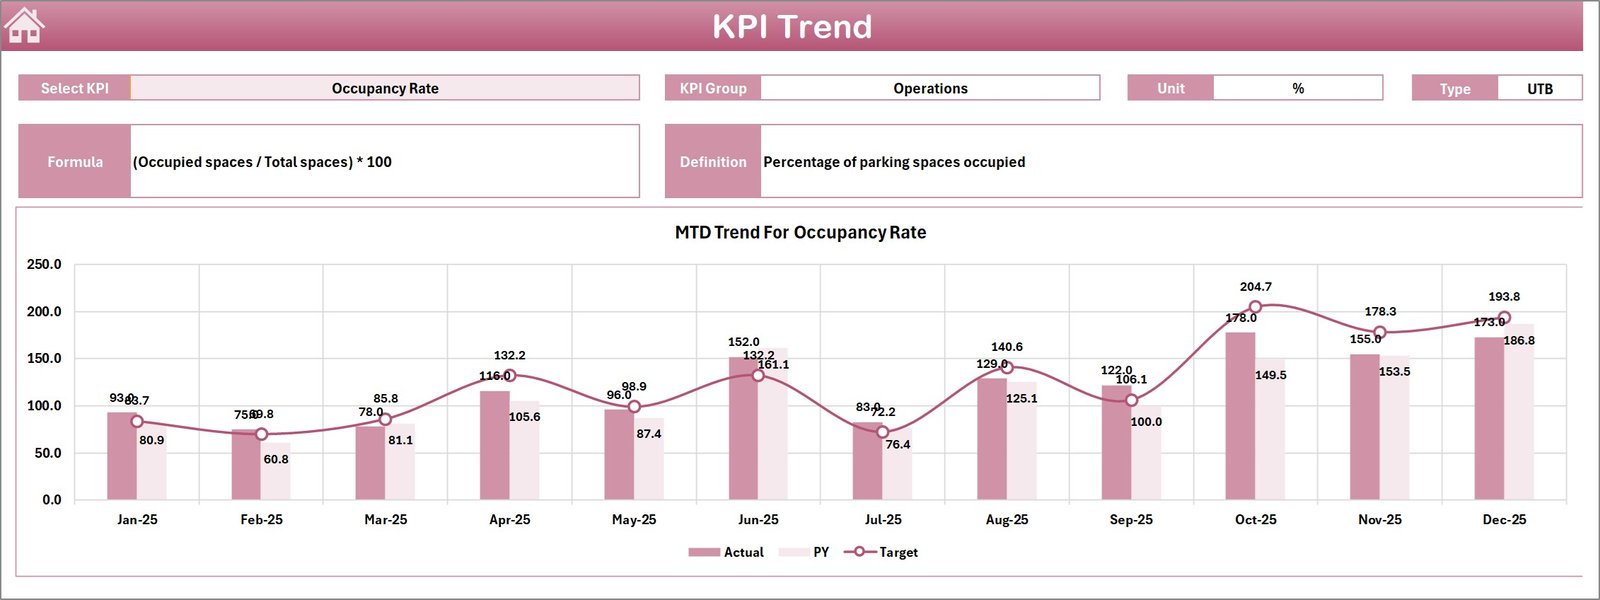
📉 KPI Trend Analysis – Visual trend charts help analyze parking KPIs over time.
📚 KPI Documentation System – Clearly defined KPI formulas and definitions ensure data transparency.
Because of these features, parking operators gain complete visibility into parking system performance.
📦 What’s Inside the Smart Parking Systems KPI Dashboard in Excel
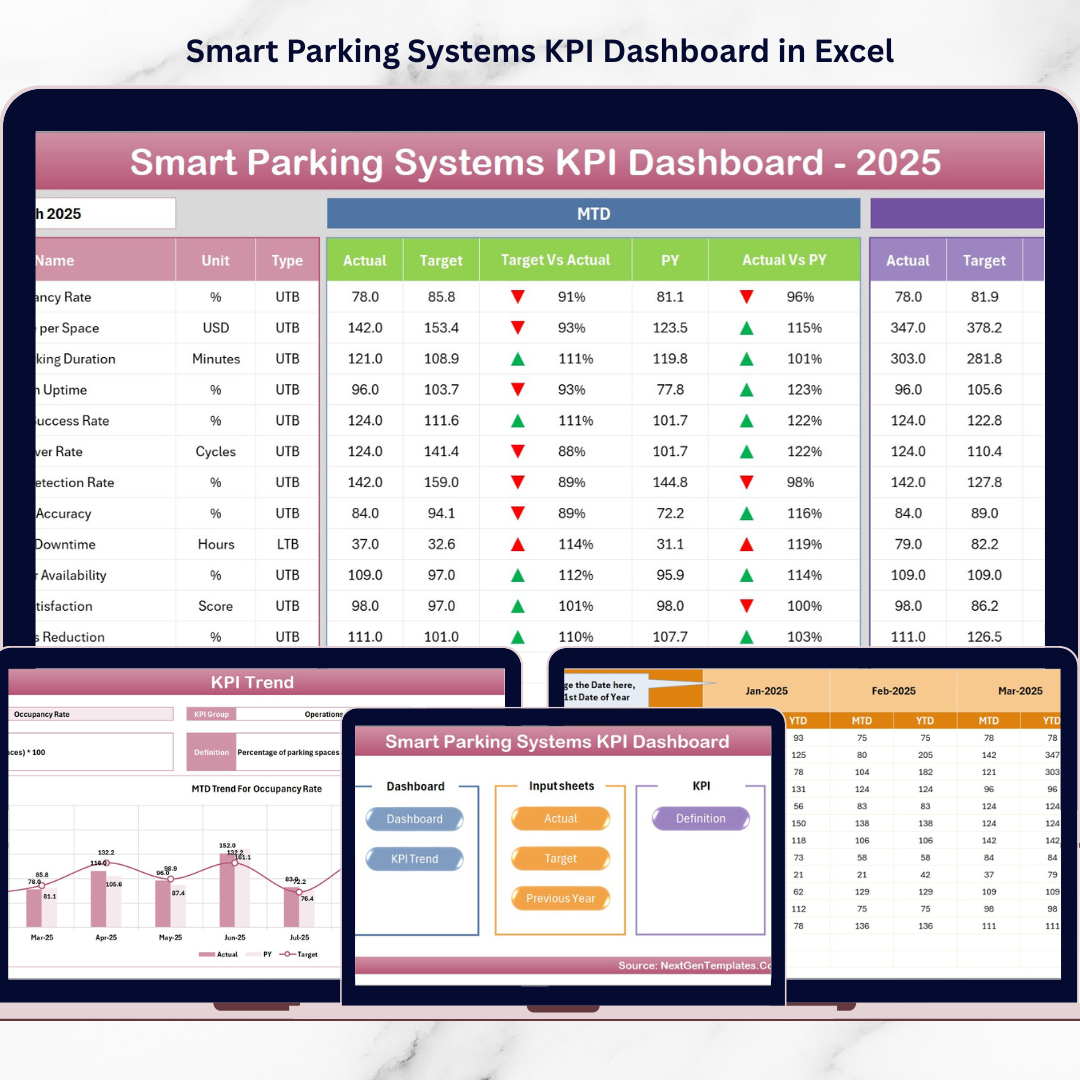
This ready-to-use Excel template includes seven structured worksheets that organize data and analytics efficiently.
Inside the dashboard you will find:
✅ Home Sheet – Navigation center with buttons to access dashboard sections
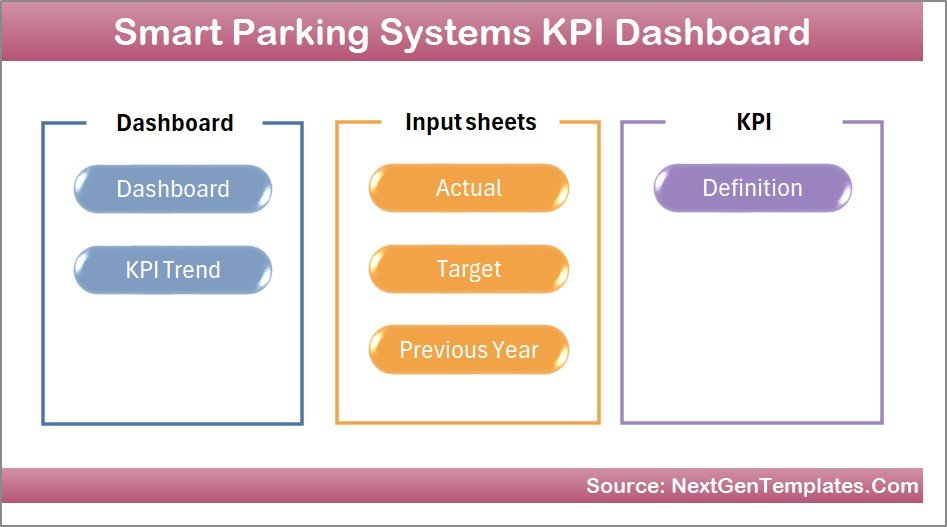
✅ Dashboard Sheet – Main KPI monitoring page with performance metrics
✅ KPI Trend Sheet – Trend analysis for selected KPIs
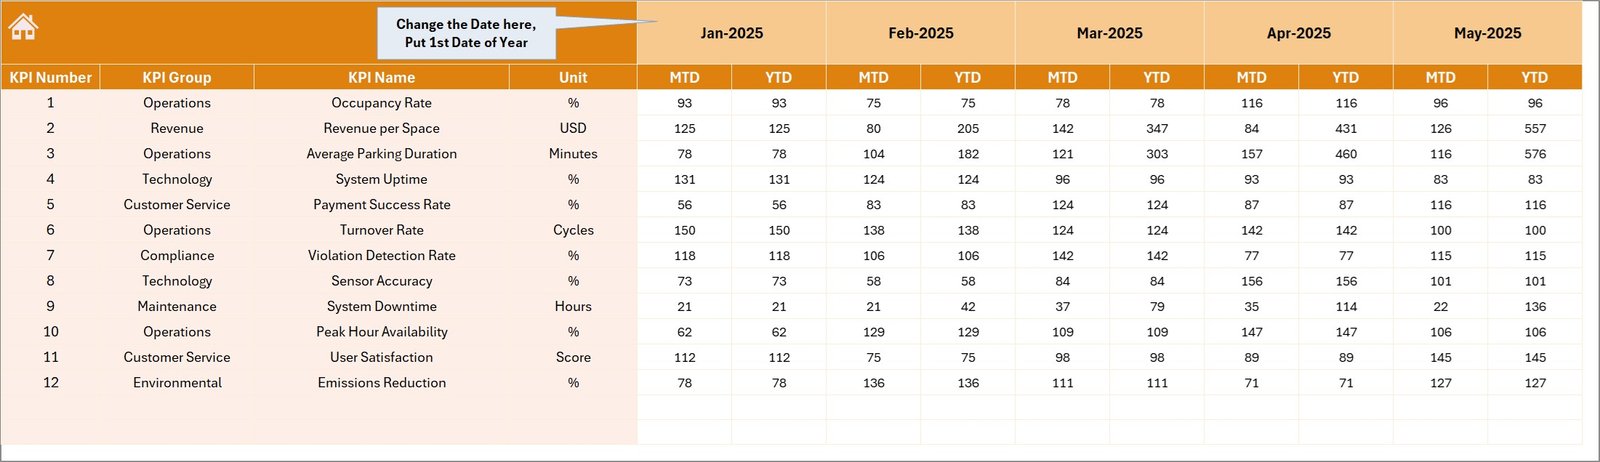
✅ Actual Numbers Input Sheet – Data entry for current performance numbers
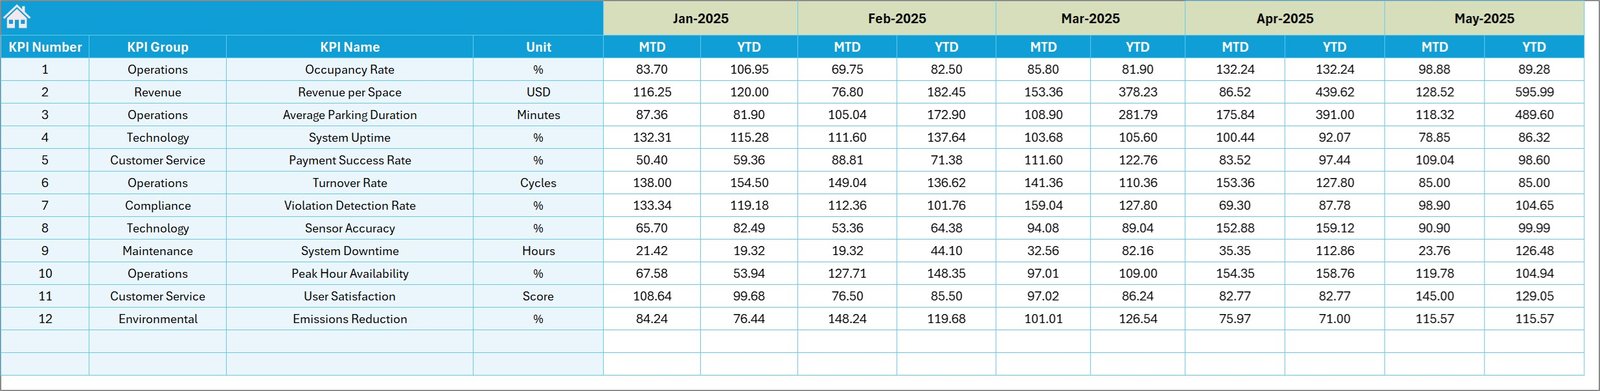
✅ Target Sheet – Monthly KPI performance targets
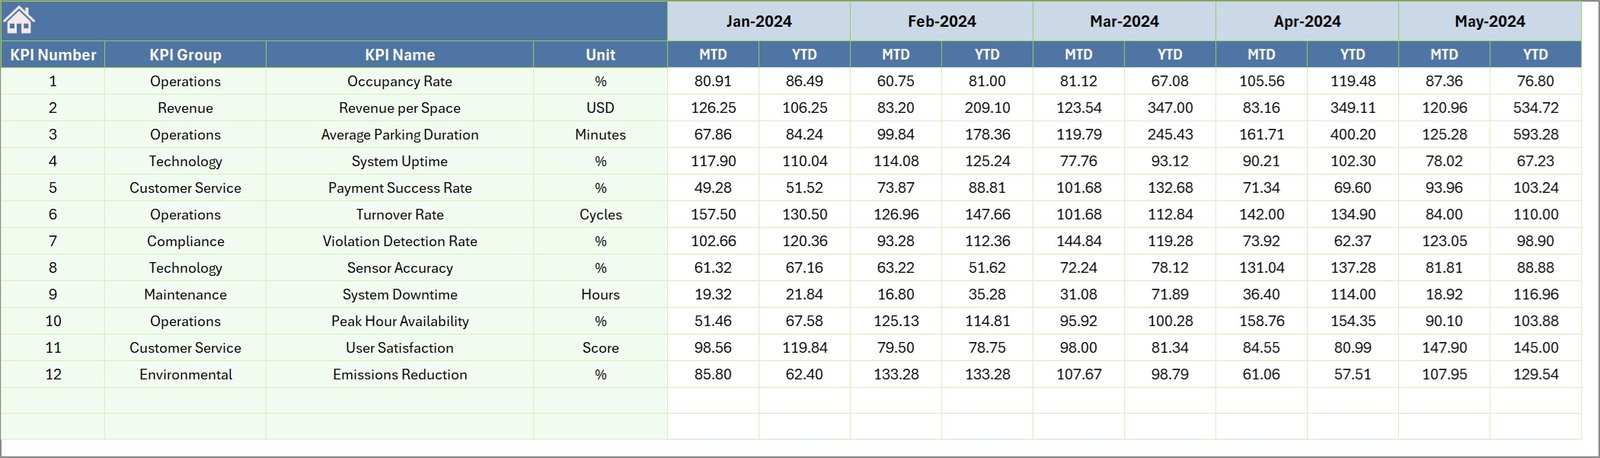
✅ Previous Year Numbers Sheet – Historical KPI data for comparison
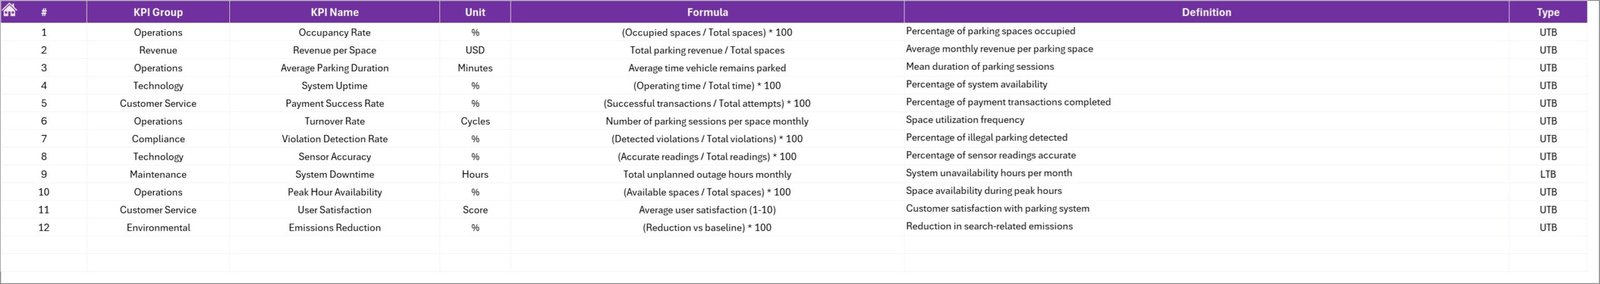
✅ KPI Definition Sheet – Documentation of KPI names, formulas, and definitions
The dashboard tracks several important smart parking metrics such as:
Parking Occupancy Rate
Parking Revenue per Space
Vehicle Turnover Rate
Average Parking Duration
Parking Slot Availability
Parking Violation Rate
Customer Satisfaction Score
Sensor Uptime Percentage
Peak Hour Utilization
Because the dashboard organizes these metrics visually, managers can analyze parking performance quickly.
⚙️ How to Use the Smart Parking Systems KPI Dashboard in Excel
Using this dashboard is simple and efficient.
1️⃣ Open the Excel dashboard template.
2️⃣ Enter the starting month in the Actual Numbers Input sheet.
3️⃣ Input monthly KPI values such as occupancy rate, revenue, and parking utilization.
4️⃣ Enter target performance values in the Target sheet.
5️⃣ Add historical values in the Previous Year sheet.
6️⃣ Use the Dashboard sheet to monitor KPI performance.
Once data is entered, Excel automatically updates the dashboard charts and KPI indicators.
Within seconds, managers can evaluate parking system performance and identify operational issues.
👥 Who Can Benefit from This Smart Parking Systems KPI Dashboard
This dashboard is ideal for professionals responsible for parking infrastructure and urban mobility management.
It is particularly useful for:
🚗 Parking Management Companies
🏙 City Transportation Authorities
🏗 Infrastructure Managers
📊 Urban Mobility Analysts
🏢 Smart City Planners
🚦 Traffic Management Authorities
Because the dashboard combines operational, financial, and performance metrics, multiple departments can use it simultaneously.
💡 Why Organizations Use Smart Parking KPI Dashboards
✔ Centralized monitoring of parking infrastructure performance
✔ Better parking space utilization analysis
✔ Improved parking revenue tracking
✔ Faster identification of operational inefficiencies
✔ Data-driven decision-making for urban mobility planning
✔ Clear historical performance comparison
✔ Enhanced smart city infrastructure management
✔ Improved driver parking experience
Instead of relying on manual reports, organizations can analyze parking operations using visual and structured insights.
This dashboard transforms parking system data into actionable intelligence that helps cities and parking operators improve efficiency.
### Click here to read the Detailed blog post
Visit our YouTube channel to learn step-by-step video tutorials
Youtube.com/@PKAnExcelExpert