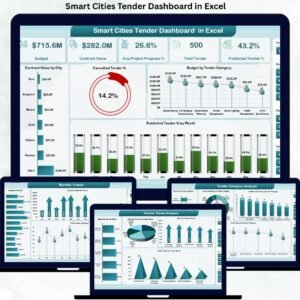
Smart city initiatives are expanding rapidly across the globe. Governments and urban authorities now manage hundreds of tenders related to transportation, energy, IT infrastructure, water management, public safety, and digital services. Smart Cities Tender Dashboard in Excel Because these projects involve large public budgets and strict accountability, tracking tender performance accurately is no longer optional.
However, when smart city tender data is scattered across spreadsheets, emails, and manual reports, visibility drops. As a result, budget overruns increase, tender cancellations rise, and project progress becomes difficult to track.
Smart Cities Tender Dashboard in Excel That is exactly why the Smart Cities Tender Dashboard in Excel becomes a powerful and practical solution.
This ready-to-use Excel dashboard converts complex smart city tender data into clear KPIs, interactive charts, and actionable trends. Instead of manually reviewing raw tender lists, authorities gain instant visibility into budgets, contract values, tender status, city-wise performance, vendor efficiency, and monthly trends—all within a single Excel file.
Because it is built entirely in Microsoft Excel, this dashboard is easy to use, cost-effective, and fully customizable, without requiring Power BI or any advanced tools.
🔑 Key Features of Smart Cities Tender Dashboard in Excel
📊 Centralized Smart City Tender Monitoring
Track all smart city tenders in one structured Excel dashboard.
💰 Budget & Contract Value Transparency
Instant visibility into allocated budgets and awarded contract values.
📈 Tender Status & Publishing Performance Tracking
Monitor published, cancelled, and total tenders clearly.
🏙️ City-Wise Tender Performance Analysis
Compare budgets, tender volume, and project progress across cities.
🏢 Vendor Performance & ROI Analysis
Evaluate vendors based on budget handled, contract value, ROI, and workload.
📅 Monthly Trend Analysis
Identify publishing patterns, budget trends, and workload changes over time.
🧭 Page Navigator for Easy Navigation
Move seamlessly between dashboard pages without searching sheets.
⚙️ 100% Excel-Based & Customizable
No macros, no BI tools—easy to edit, expand, and maintain.
📦 What’s Inside the Smart Cities Tender Dashboard in Excel
This professionally designed dashboard contains five powerful analytical pages, supported by structured backend sheets.
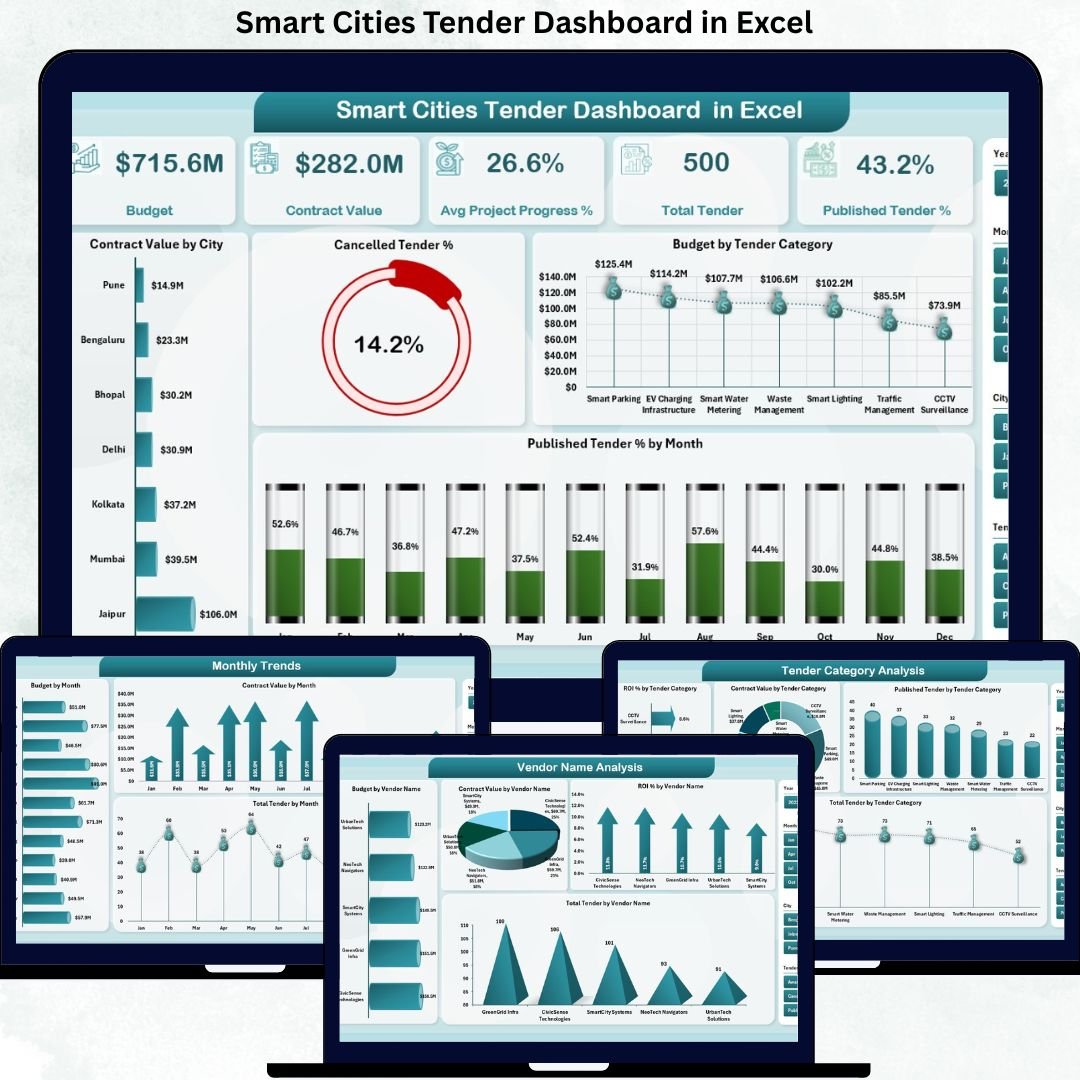
📊 Overview Page – Smart Cities Tender Performance Snapshot
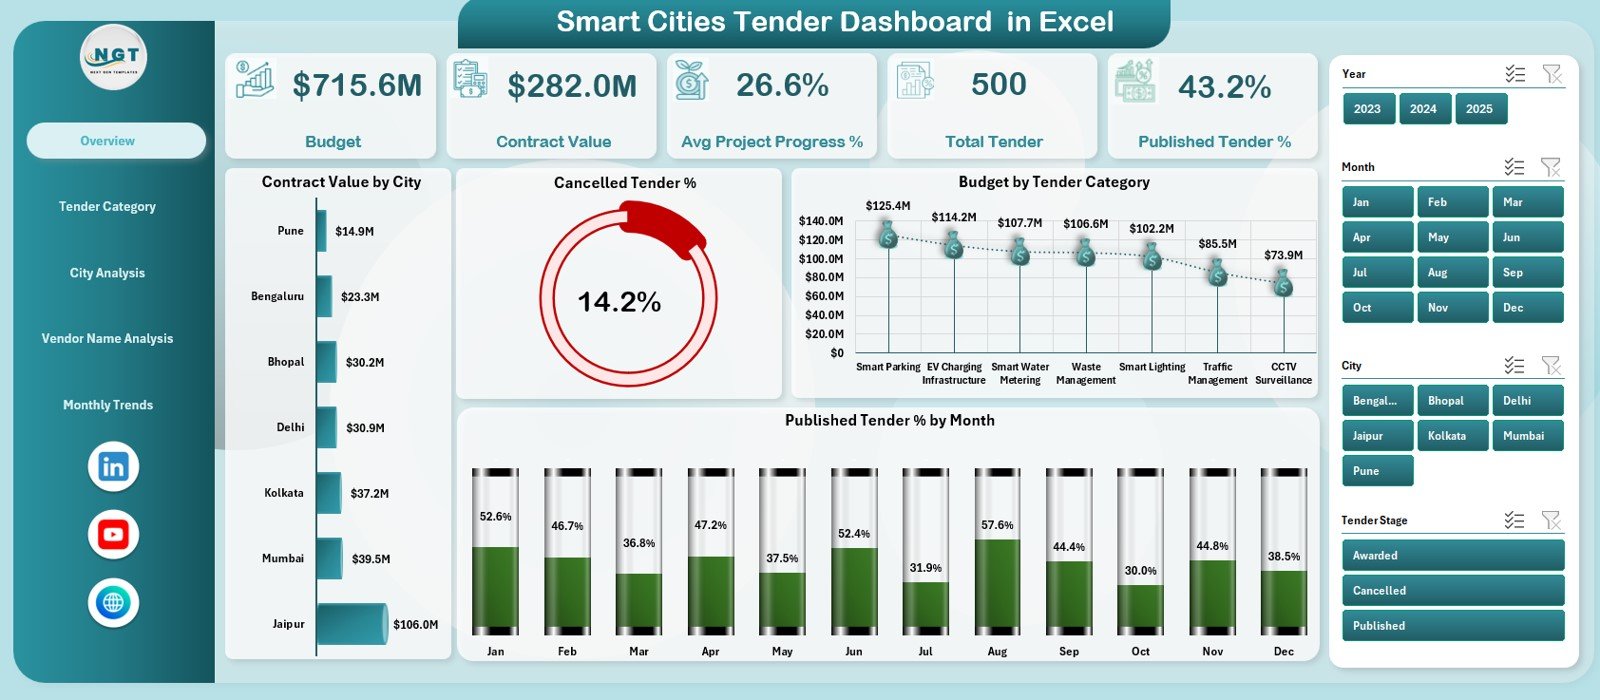
The Overview Page acts as the executive control panel.
KPI Cards Display:
-
Budget
-
Contract Value
-
Average Project Progress %
-
Total Tenders
-
Published Tender %
Charts Included:
-
Contract Value by City
-
Cancelled Tender %
-
Budget by Tender Category
-
Published Tender % by Month
This page instantly explains overall tender health and risk areas.
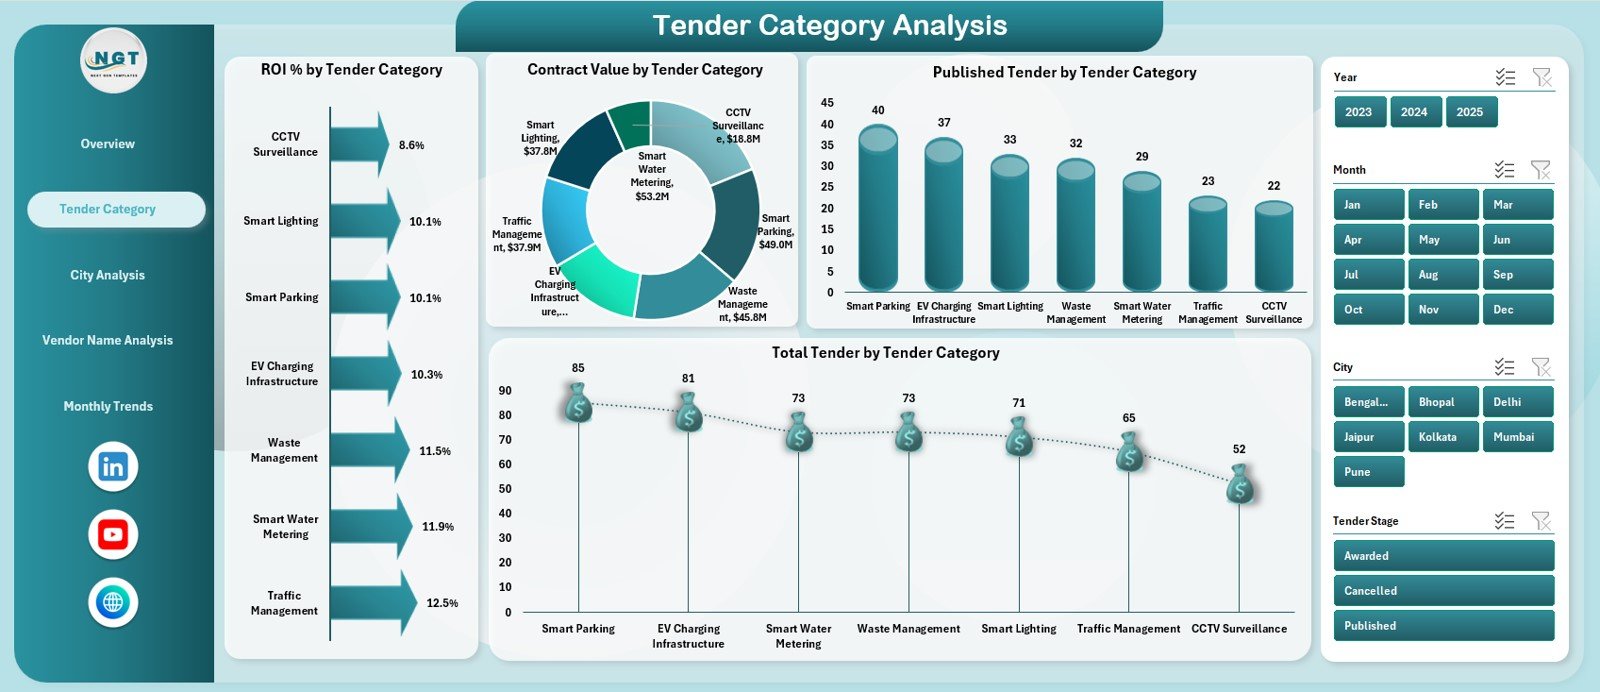
🏗️ Tender Category Analysis Page
Analyze performance across smart city categories such as transport, energy, IT, water, and public services.
Charts Included:
-
ROI % by Tender Category
-
Contract Value by Tender Category
-
Published Tenders by Category
-
Total Tenders by Category
This helps authorities prioritize high-impact categories.
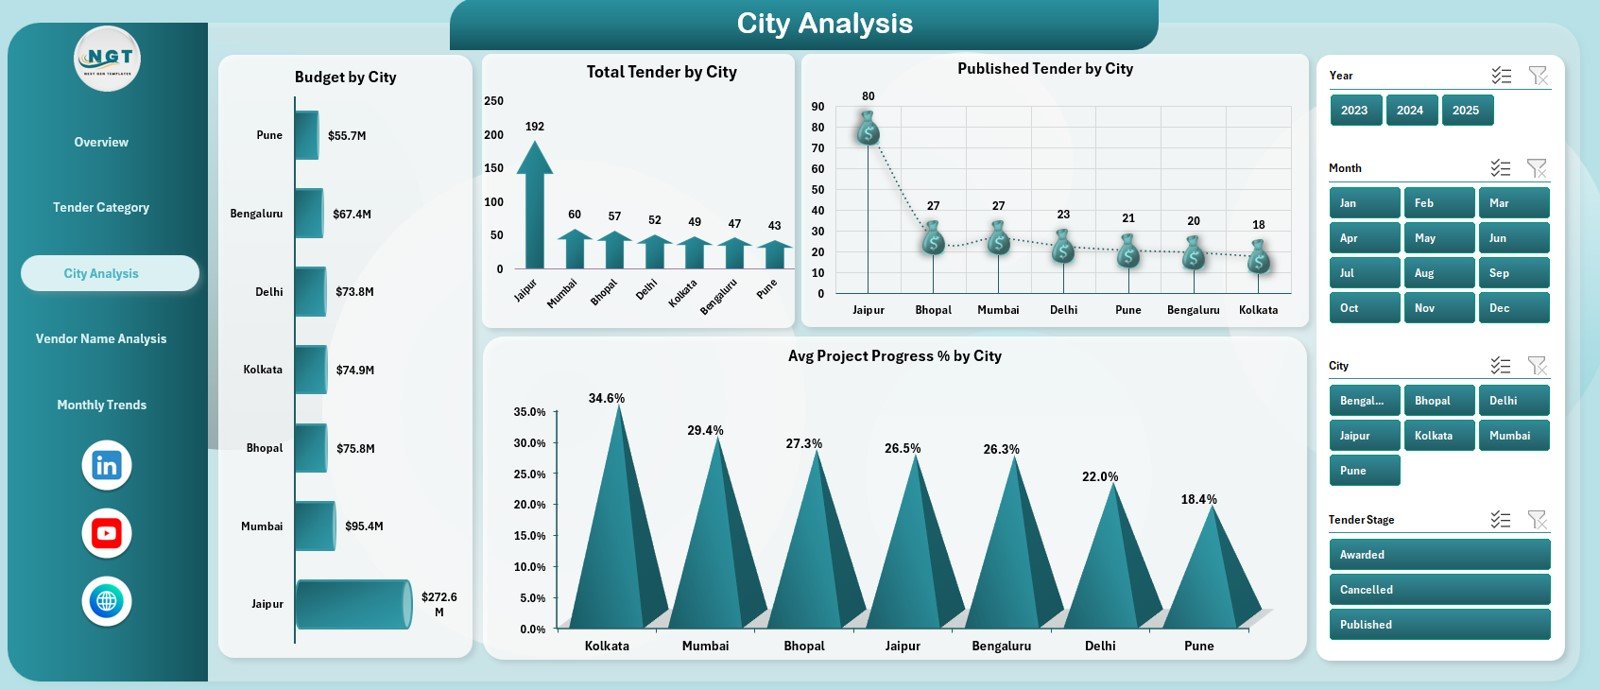
🏙️ City Analysis Page
Evaluate tender performance city by city.
Charts Included:
-
Budget by City
-
Total Tenders by City
-
Published Tenders by City
-
Average Project Progress % by City
This page helps identify underperforming cities early.
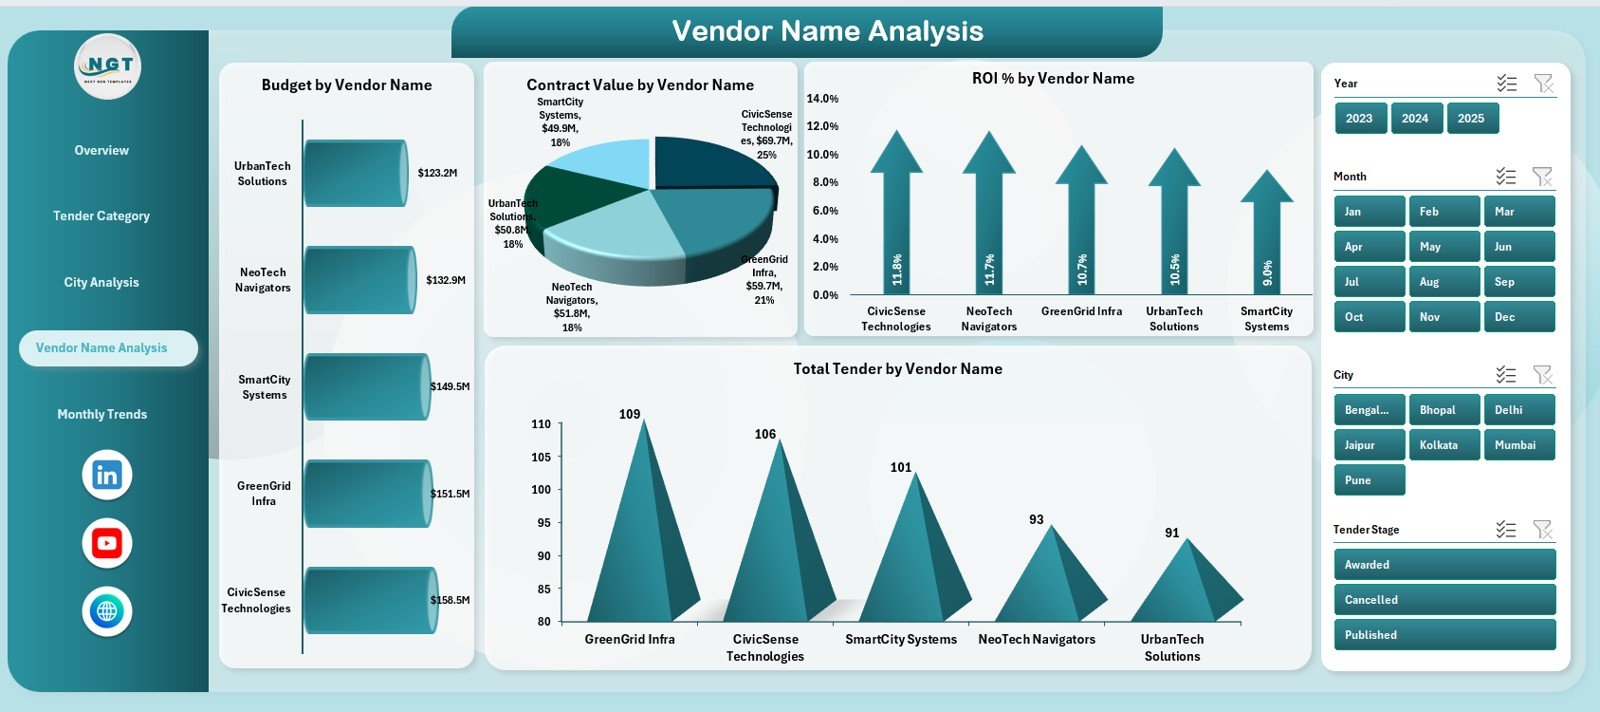
🏢 Vendor Name Analysis Page
Vendor performance directly impacts project success.
Charts Included:
-
Budget by Vendor Name
-
Contract Value by Vendor Name
-
ROI % by Vendor Name
-
Total Tenders by Vendor Name
Supports vendor evaluation and selection decisions.
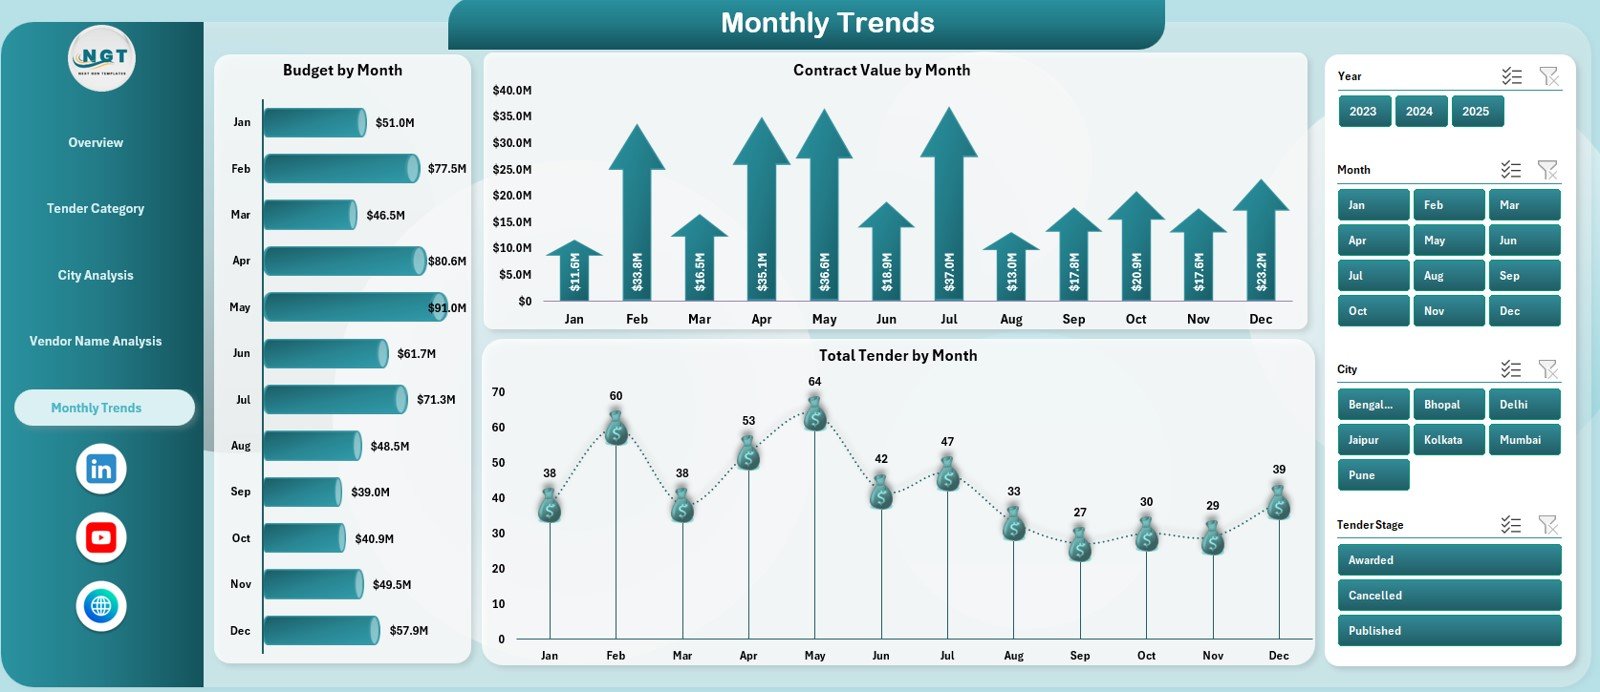
📅 Monthly Trends Page
Track how smart city tenders evolve over time.
Charts Included:
-
Budget by Month
-
Contract Value by Month
-
Total Tenders by Month
Ideal for forecasting, planning, and workload balancing.
🗂️ Data Sheet & Support Sheet
-
Data Sheet stores raw tender data (city, category, vendor, budget, contract value, progress, status).
-
Support Sheet manages calculations, helper columns, and formulas.
This structure ensures accuracy, scalability, and easy updates.
▶️ How to Use the Smart Cities Tender Dashboard in Excel
1️⃣ Enter or update tender data in the Data Sheet
2️⃣ Maintain consistent city, category, and vendor names
3️⃣ Review KPIs on the Overview Page
4️⃣ Analyze cities, vendors, and tender categories
5️⃣ Monitor publishing efficiency and progress %
6️⃣ Track monthly trends for planning
7️⃣ Make faster, transparent, data-driven decisions
No advanced Excel skills required.
🎯 Who Can Benefit from This Dashboard
🏛️ Smart City Authorities & Urban Planners
📑 Government Procurement Teams
📊 Project Management Offices (PMO)
💰 Finance & Audit Departments
🏢 Vendor Management Teams
👔 Senior Government Officials
Perfect for organizations aiming to improve transparency, accountability, and performance in smart city tenders.
👉 Click here to read the Detailed Blog Post
🔔 Visit our YouTube channel for step-by-step Excel dashboard tutorials
👉 https://www.youtube.com/@PKAnExcelExpert


Reviews
There are no reviews yet.