
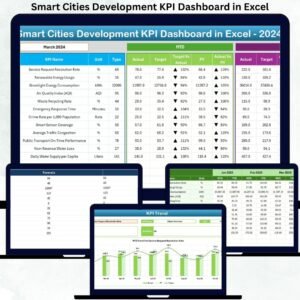
Smart Cities Development KPI Dashboard in Excel is a powerful, ready-to-use reporting system designed to help government bodies, urban planners, and smart city mission teams monitor development KPIs with clarity and speed. As cities grow rapidly, tracking performance across multiple domains—mobility, water, energy, waste, digital services, environment, and safety—becomes crucial. This dashboard simplifies complex reporting, transforms raw numbers into meaningful insights, and empowers teams to make fast, data-driven decisions.
This template is built for professionals who need a clean, structured, and fully automated reporting tool. You simply update the monthly inputs, select the desired month, and the dashboard refreshes instantly. No formulas to adjust, no complex setup, and no special software required. Everything works seamlessly within Excel.
⚙️ Key Features of Smart Cities Development KPI Dashboard in Excel
This dashboard is packed with user-friendly features that make smart city performance tracking simple, visual, and effective:
🔹 7-Sheet Structured Dashboard System
Includes Summary, Dashboard, Trend Analysis, Actual Inputs, Target Inputs, Previous Year Data, and KPI Definition sheets for smooth navigation.
🔹 MTD & YTD Performance Tracking
Track current month and year-to-date performance of all KPIs with a single click using the month selector.
🔹 Actual vs Target vs Previous Year Comparison
Smart conditional formatting arrows instantly show if performance is improving or declining.
🔹 Interactive Trend Charts
Visualize KPI progress with MTD and YTD trend charts for better planning and forecasting.
🔹 Easy Data Input System
Simple sheets for entering actual values, targets, and previous-year numbers—ideal for monthly reporting cycles.
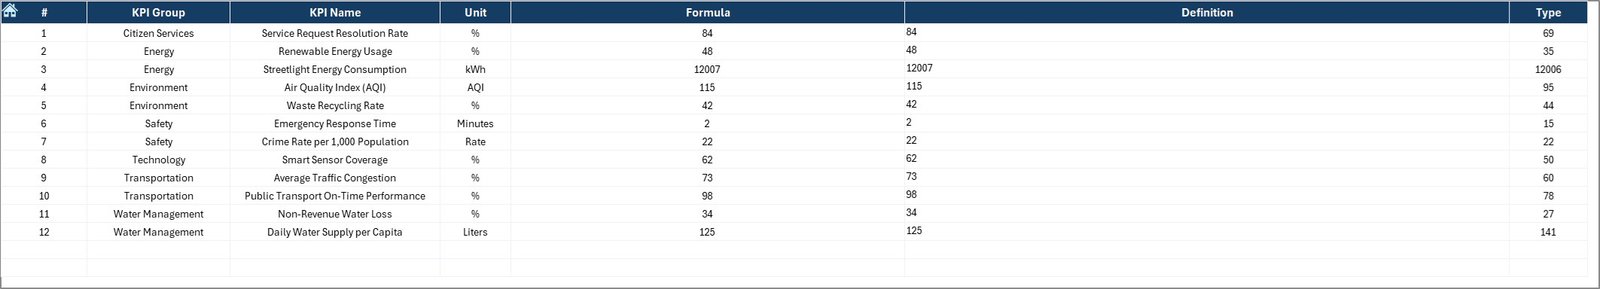
🔹 Full KPI Dictionary
Includes KPI Group, Unit, Type (UTB / LTB), Formula, and Definition for complete clarity.
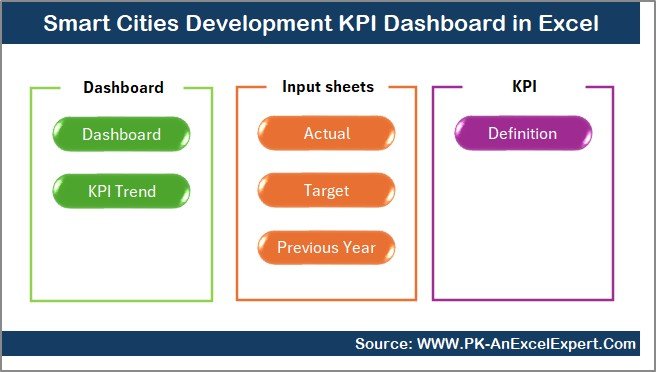
📦 What’s Inside the Smart Cities Development KPI Dashboard
This product comes with everything required for fast, accurate performance tracking:
✅ Summary Page
A clean navigation hub with quick-access buttons to every major sheet.
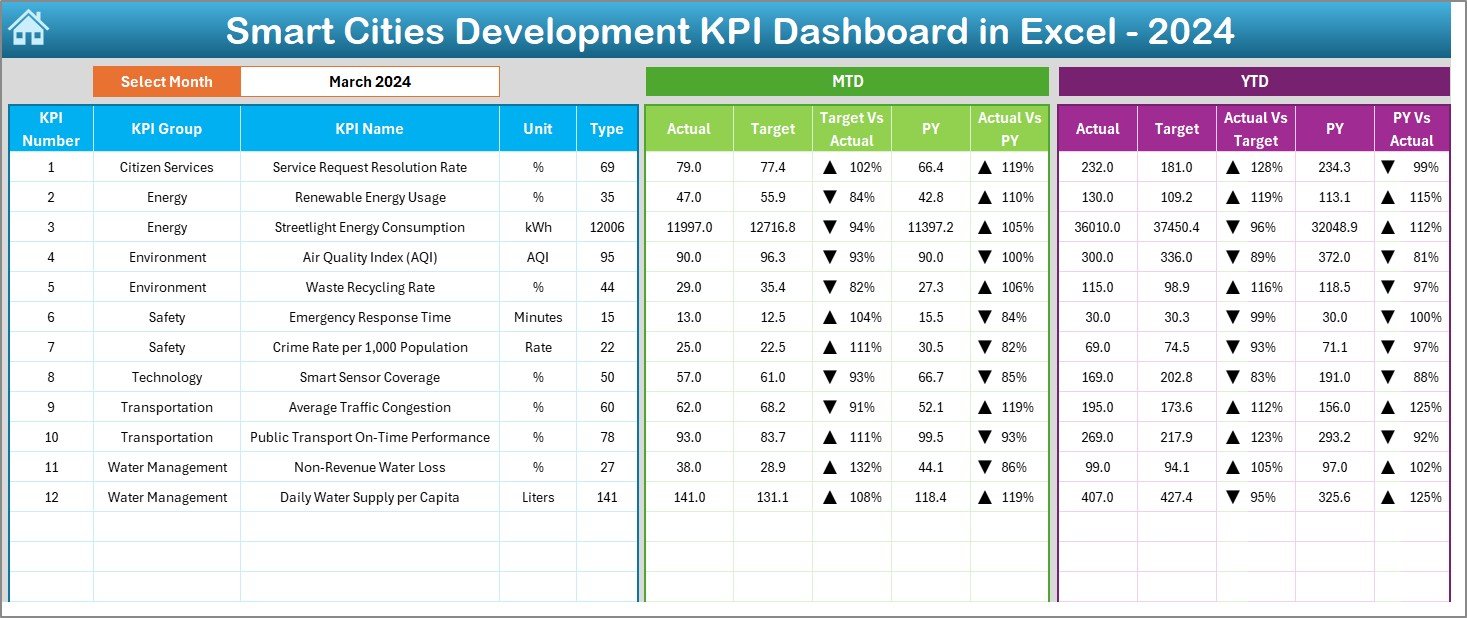
✅ Dashboard Page
Your main reporting interface showing:
-
MTD Actual, Target & PY
-
YTD Actual, Target & PY
-
Performance arrows (Up/Down)
-
Auto-updating charts and comparisons
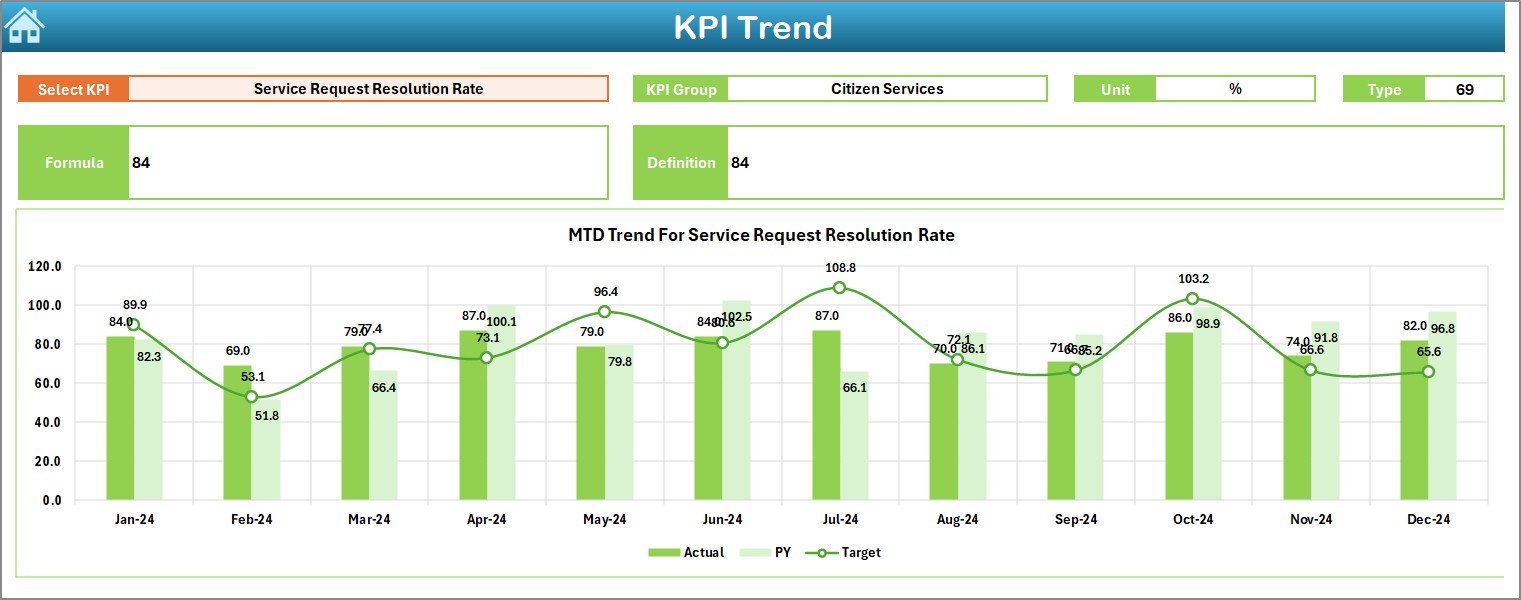
✅ Trend Page
Select any KPI and analyze:
-
KPI Group
-
Unit
-
Type (Upper/Lower the Better)
-
Formula
-
Definition
-
MTD & YTD Trend Charts
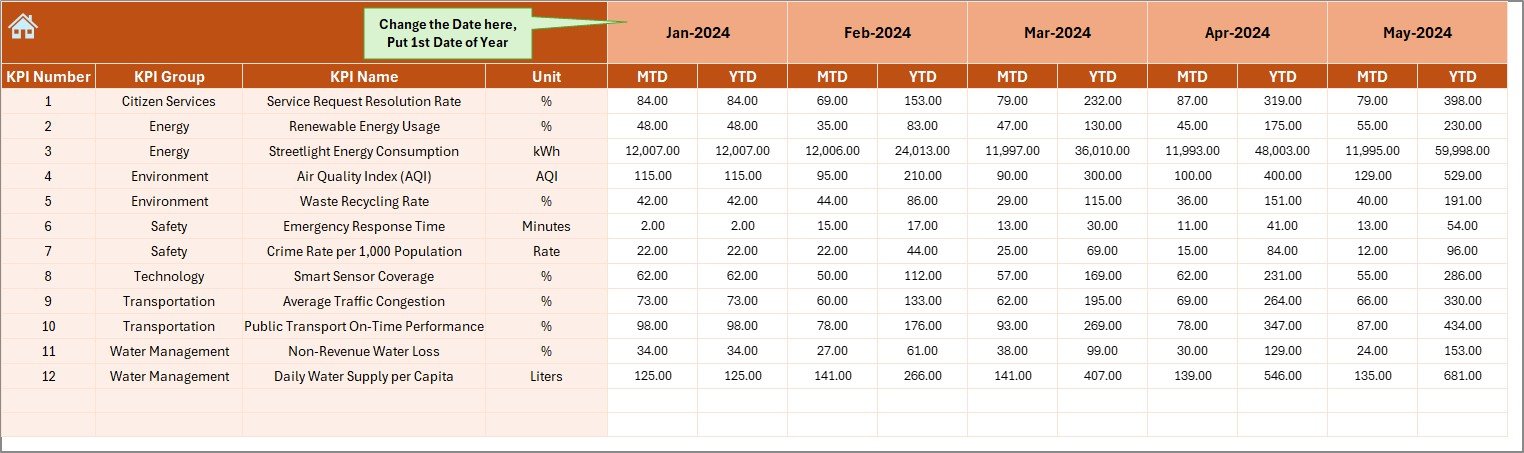
✅ Actual Input Sheet
Enter monthly performance numbers with a flexible year-start selector.
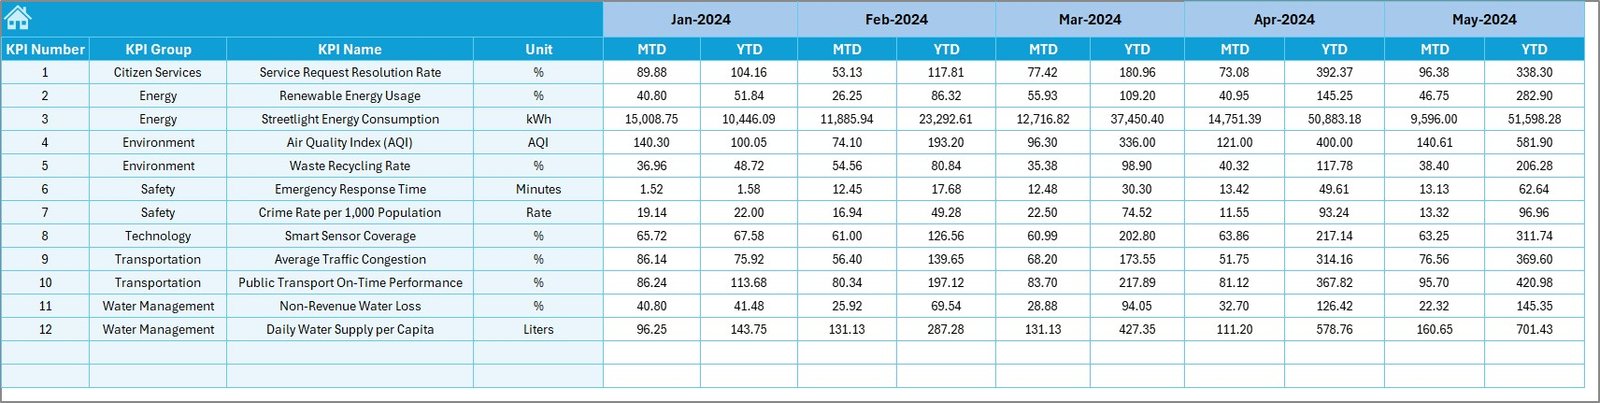
✅ Target Input Sheet
Add MTD/YTD targets for every KPI to maintain accurate comparisons.
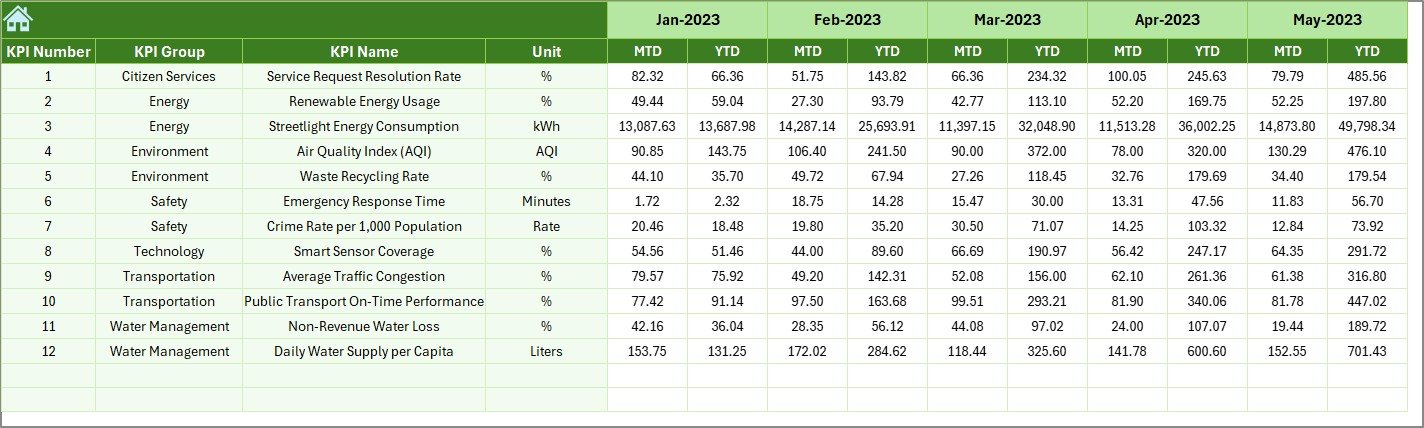
✅ Previous Year Sheet
Store last year’s actual performance for year-over-year insights.
✅ KPI Definition Sheet
Acts as your reference guide for all KPIs.
🧭 How to Use the Smart Cities Development KPI Dashboard
Using this dashboard is extremely simple—even for non-technical users:
-
Enter actual numbers in the Actual Input sheet.
-
Fill monthly targets in the Target sheet.
-
Add previous-year data in the PY sheet.
-
Select the month from the dropdown on the Dashboard page.
-
View auto-updated charts and KPIs instantly.
-
Use the Trend sheet to study performance patterns and improvement areas.
You can update all KPIs monthly and generate professional, presentation-ready reports in minutes.
👥 Who Can Benefit from This Dashboard
This Smart City KPI Dashboard is perfect for:
🏙️ Smart City Mission Teams
Track development goals with clarity and accountability.
🧭 Urban Planners & Municipal Corporations
Monitor multiple service areas like mobility, waste, energy, and governance.
📊 Project Management Units (PMUs)
Ensure projects are progressing as per targets.
🌱 Environmental & Water Departments
Track sustainability, AQI, water quality, and more.
🚌 Urban Transport Authorities
Analyze congestion, ridership, efficiency, and charging infrastructure.
🧑💻 Digital Governance Teams
Monitor citizen service performance and digital adoption.
🧠 Consultants & Analysts
Use clean visuals to create impactful presentations and reports.
Whether you’re managing infrastructure, public services, environmental health, or digital governance, this dashboard gives you a reliable system for accurate performance tracking.
### 📘 Click here to read the Detailed blog post
Watch the step-by-step video tutorial:


Reviews
There are no reviews yet.