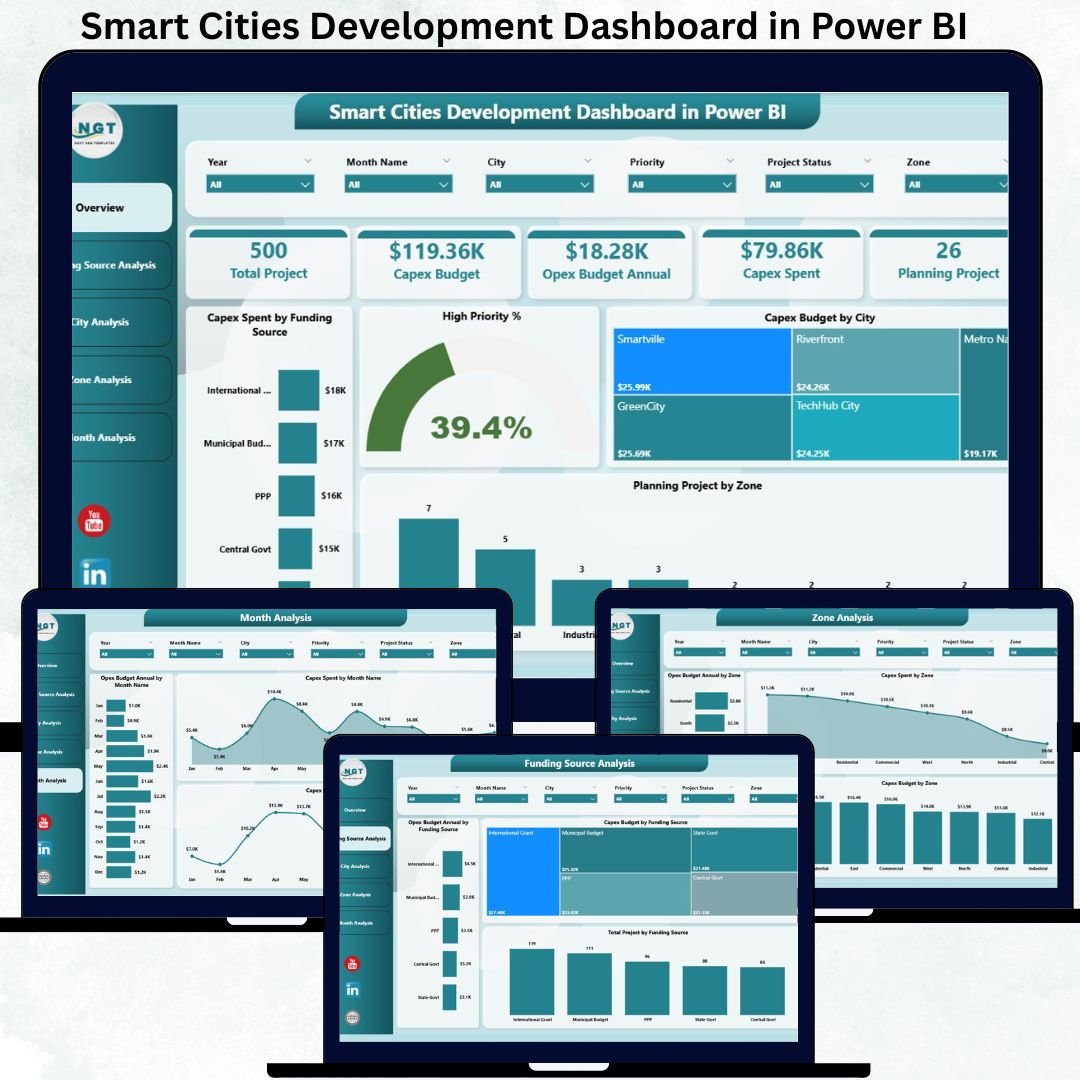


Smart city initiatives involve massive investments, multiple stakeholders, and long-term planning. However, when Capex, OpEx, funding sources, and project priorities are tracked through disconnected reports and static spreadsheets, visibility disappears and decision-making slows down. That is exactly why the Smart Cities Development Dashboard in Power BI becomes an essential tool for modern urban governance.
This ready-to-use Power BI dashboard transforms complex smart city data into a clear, interactive, and decision-ready analytics platform. Instead of manually consolidating reports, city administrators and planners can instantly monitor Capex spending, OpEx budgets, funding sources, high-priority projects, city-wise performance, zone-wise allocation, and monthly trends—all in one place.
Because the dashboard is built in Power BI, users can apply slicers, drill down into details, and compare performance across cities and zones within seconds. As a result, governments gain better control, higher transparency, and faster execution of smart city programs.
🚀 Key Features of the Smart Cities Development Dashboard in Power BI
This dashboard is designed specifically for large-scale urban development programs.
🏗 Capex & OpEx Performance Tracking
Monitor capital expenditure and operational budgets in real time.
💰 Funding Source Visibility
Analyze how different funding sources contribute to smart city projects.
📍 City-Wise & Zone-Wise Analysis
Compare development performance across cities and planning zones.
⚠ High Priority Project Monitoring
Track the percentage and distribution of high-priority projects.
📊 Interactive KPI Cards & Charts
Get instant insights through clean visuals and summary cards.
🎛 Dynamic Filters & Drill-Downs
Slice data by city, zone, funding source, and time period.
📦 What’s Inside the Smart Cities Development Dashboard
The dashboard contains five professionally designed analytical pages, each answering a critical planning and financial question.
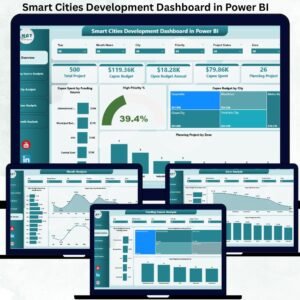
🌐 Overview Page – Overall Smart City Performance
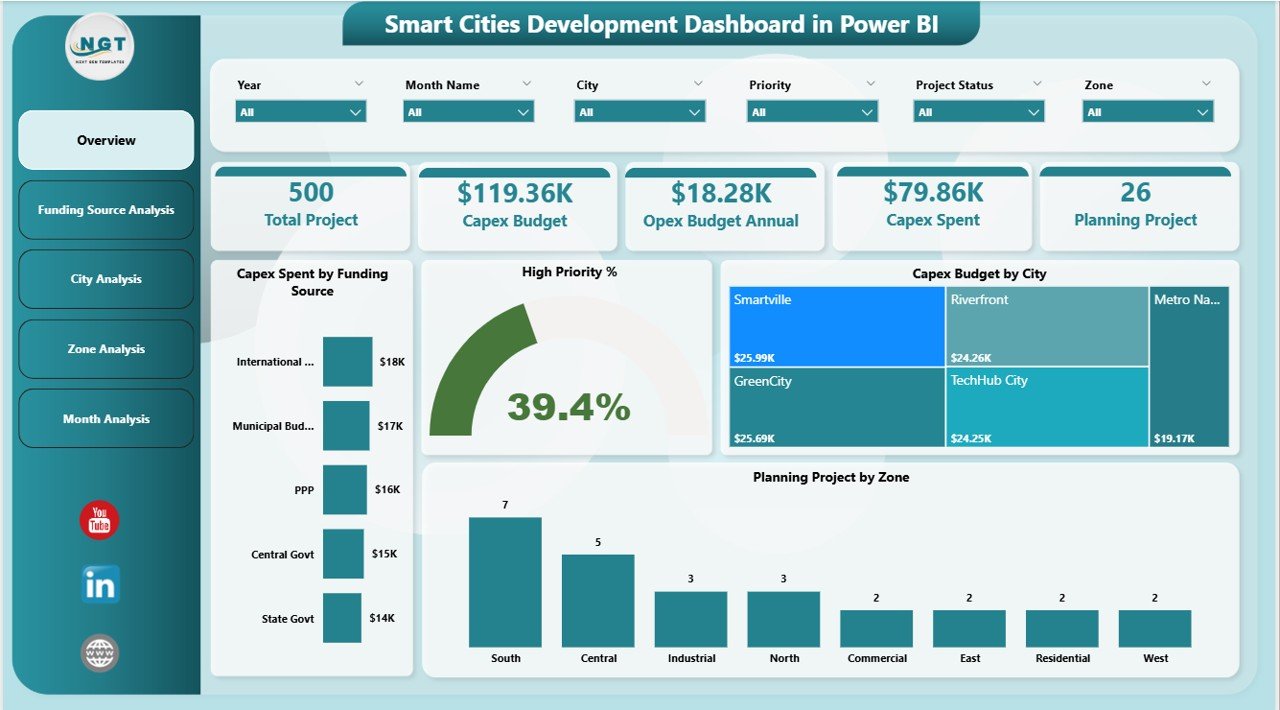
This is the main landing page of the dashboard.
KPI Cards Included
-
Total Capex Spend
-
Total Capex Budget
-
High Priority Project %
-
Total Projects Count
Key Charts
-
Capex Spend by Funding Source
-
High Priority %
-
Capex Budget by City
-
Planning Project by Zone
This page gives leadership an instant snapshot of spending efficiency, priority focus, and regional distribution.
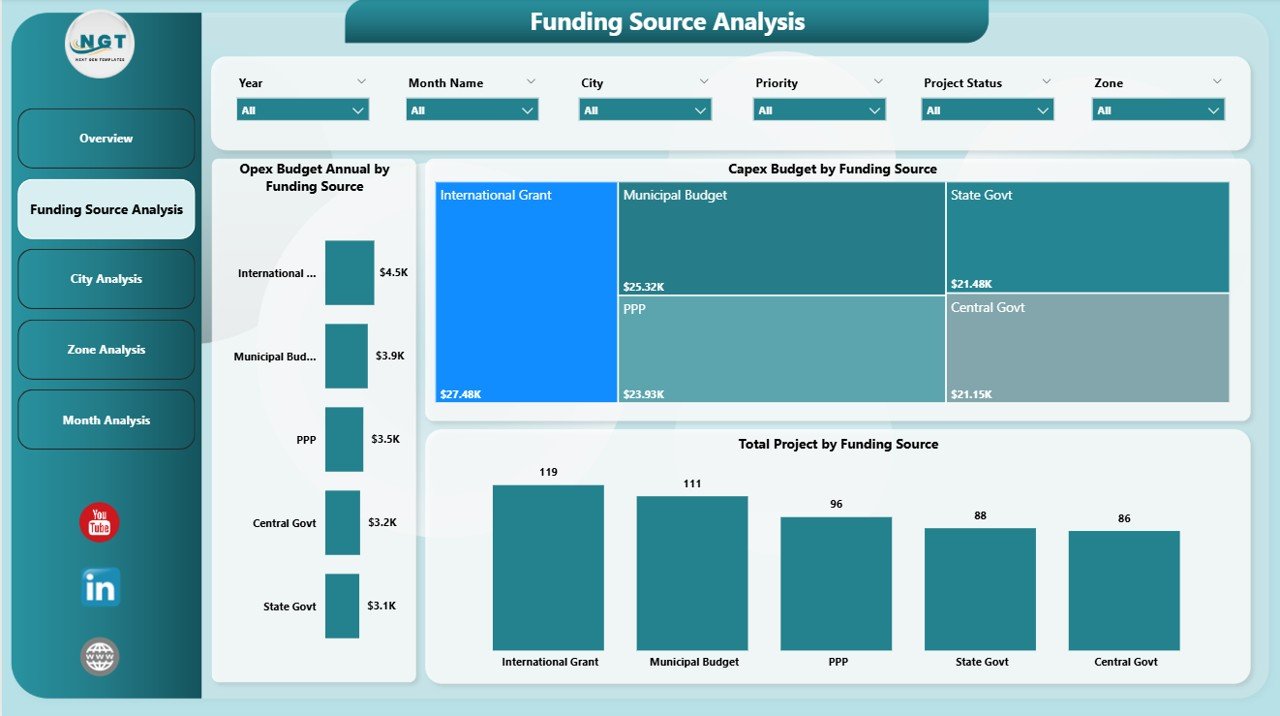
💼 Funding Source Analysis – Funding Strategy Insights
This page evaluates the role of different funding sources.
Charts Included
-
Annual OpEx Budget by Funding Source
-
Capex Budget by Funding Source
-
Total Projects by Funding Source
With this analysis, finance teams can optimize funding mix, reduce dependency risks, and align OpEx with sustainability goals.
🏙 City Analysis – City-Wise Development Comparison
The City Analysis page compares smart city investments across cities.
Charts Included
-
Annual OpEx Budget by City
-
Capex Budget by City
-
High Priority Projects by City
This view helps governments ensure balanced growth, fair allocation, and targeted investment.
🗺 Zone Analysis – Micro-Level Urban Planning
Urban zones often have different development needs. This page focuses on zone-level insights.
Charts Included
-
Annual OpEx Budget by Zone
-
Capex Spend by Zone
-
Capex Budget by Zone
Zone analysis supports granular planning and prevents budget misallocation.
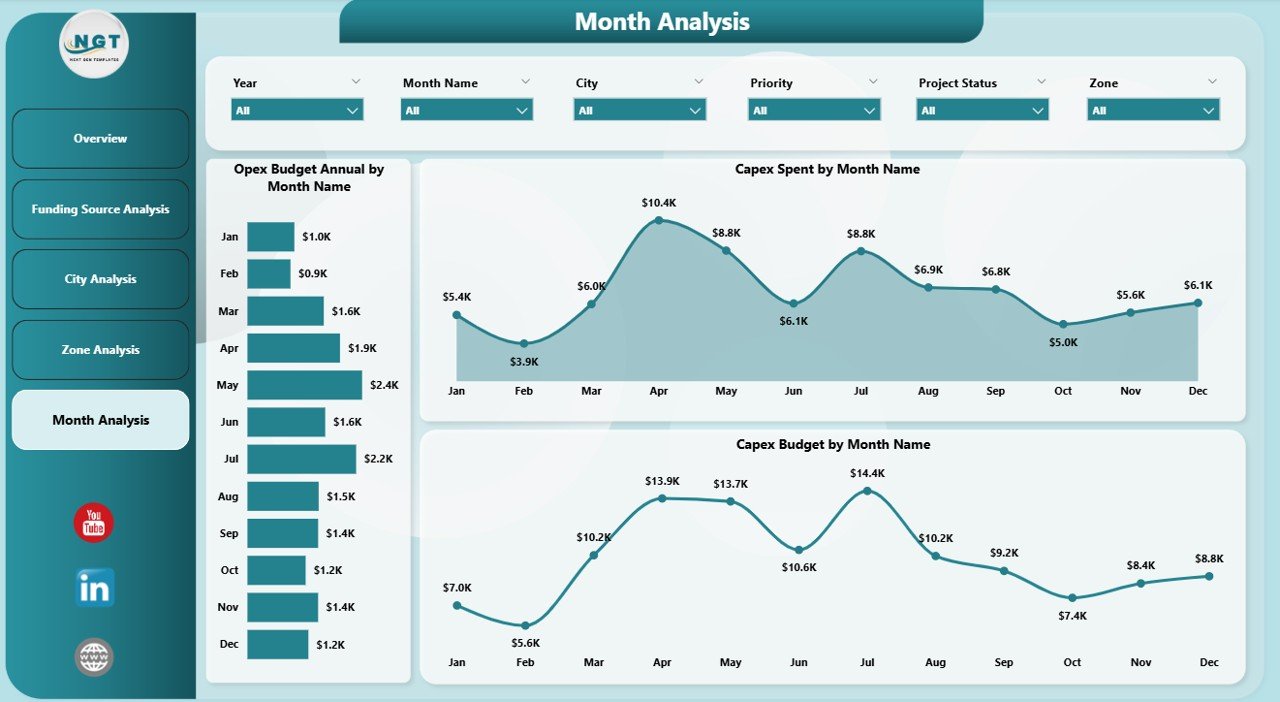
📅 Monthly Trends – Time-Based Budget Monitoring
The Monthly Trends page tracks how budgets and spending evolve over time.
Charts Included
-
Annual OpEx Budget by Month
-
Capex Spend by Month
-
Capex Budget by Month
Trend analysis helps planners forecast funding needs and detect delays early.
⚙️ How to Use the Smart Cities Development Dashboard
1️⃣ Update smart city project data (Capex, OpEx, priorities)
2️⃣ Refresh the Power BI dataset
3️⃣ Use slicers to filter by city, zone, funding source, or time
4️⃣ Review KPI cards and charts
5️⃣ Identify gaps, delays, and priority areas
6️⃣ Make faster, data-driven planning decisions
No complex setup. No manual consolidation.
👥 Who Can Benefit from This Dashboard?
This dashboard is ideal for:
-
🏛 Government Authorities
-
🌆 Urban & City Planners
-
💼 Smart City Mission Teams
-
💰 Finance & Budget Departments
-
🏗 Infrastructure Agencies
-
📊 Policy Analysts & Consultants
Anyone involved in urban development and public infrastructure planning will benefit immediately.
### Click here to read the Detailed blog post
Visit our YouTube channel to learn step-by-step video tutorials
👉 Youtube.com/@PKAnExcelExpert


Reviews
There are no reviews yet.