Smart cities run on hundreds of contracts across infrastructure, IT systems, utilities, transportation, and public services. However, when contract data remains scattered across spreadsheets, ERP exports, and manual reports, cities lose visibility. As a result, cost overruns increase, delays go unnoticed, and decision-making becomes reactive.
That is exactly why the Smart Cities Contract Management Dashboard in Power BI becomes a game-changing solution. 🚀
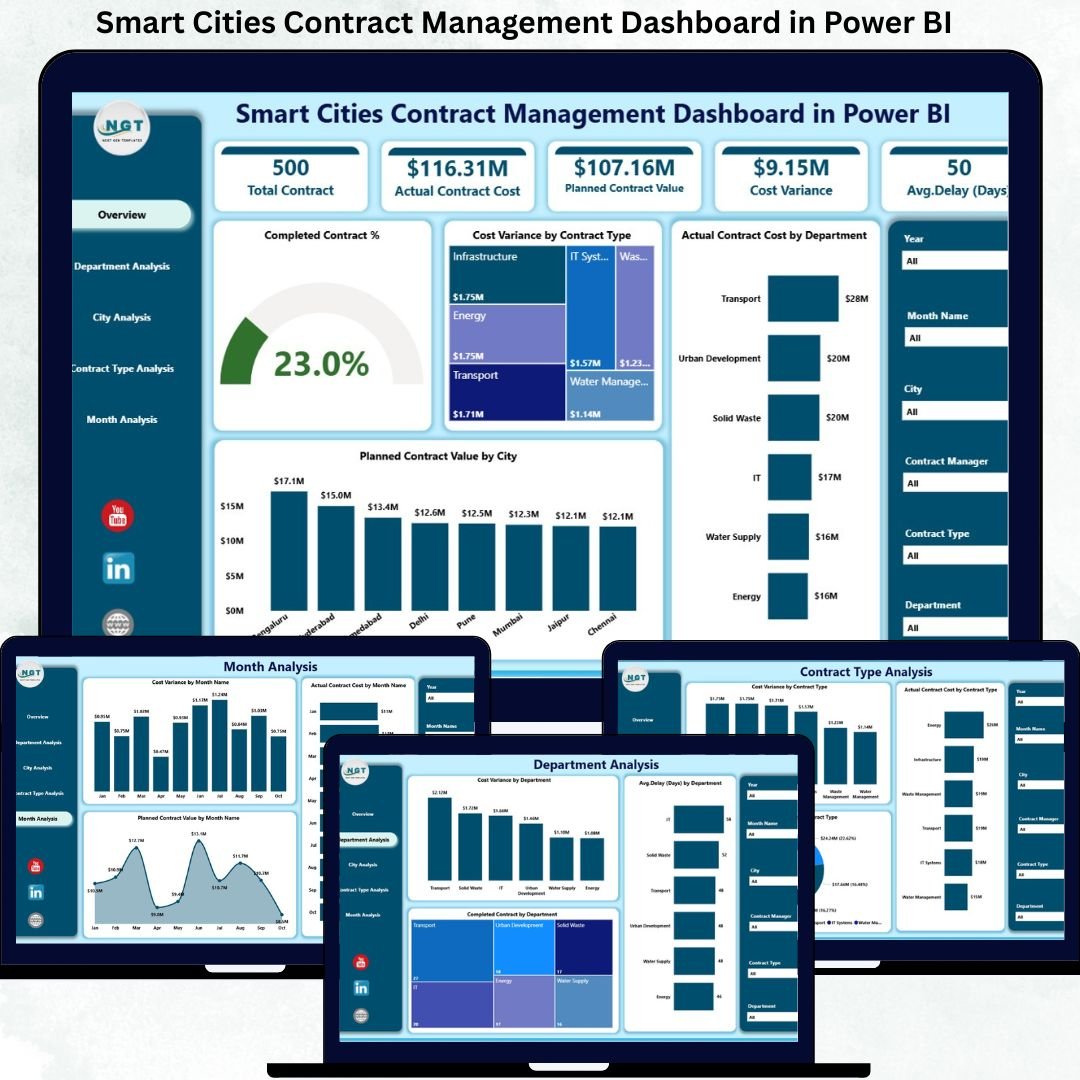
This professionally designed Power BI dashboard transforms raw contract data into clear KPIs, interactive visuals, and actionable insights. As a result, city authorities, planners, and finance teams gain full control over contract costs, completion rates, delays, and variances—across departments, cities, and contract types.
Built for modern smart city governance, this dashboard replaces manual tracking with real-time intelligence, transparency, and confidence.
Key Features of Smart Cities Contract Management Dashboard in Power BI 🔑
📊 Centralized Contract Visibility
Track all smart city contracts in one unified Power BI dashboard.
📈 Planned vs Actual Cost Control
Monitor actual contract costs, planned values, and total cost variance instantly.
🏙️ City-Wise & Department-Wise Analysis
Compare contract performance across cities and departments effortlessly.
⏱️ Delay & Completion Monitoring
Identify delayed contracts early and track completion percentages.
🧭 Interactive Slicers & Drill-Downs
Filter data by city, department, contract type, or month in seconds.
📅 Monthly Trend Analysis
Understand cost and variance patterns over time for proactive planning.
⚡ Faster Decision-Making
Visual insights eliminate manual reporting delays and guesswork.
What’s Inside the Smart Cities Contract Management Dashboard in Power BI 📁
This ready-to-use Power BI solution includes five powerful analytical pages, each designed to answer a specific contract management question.
📄 Overview Page
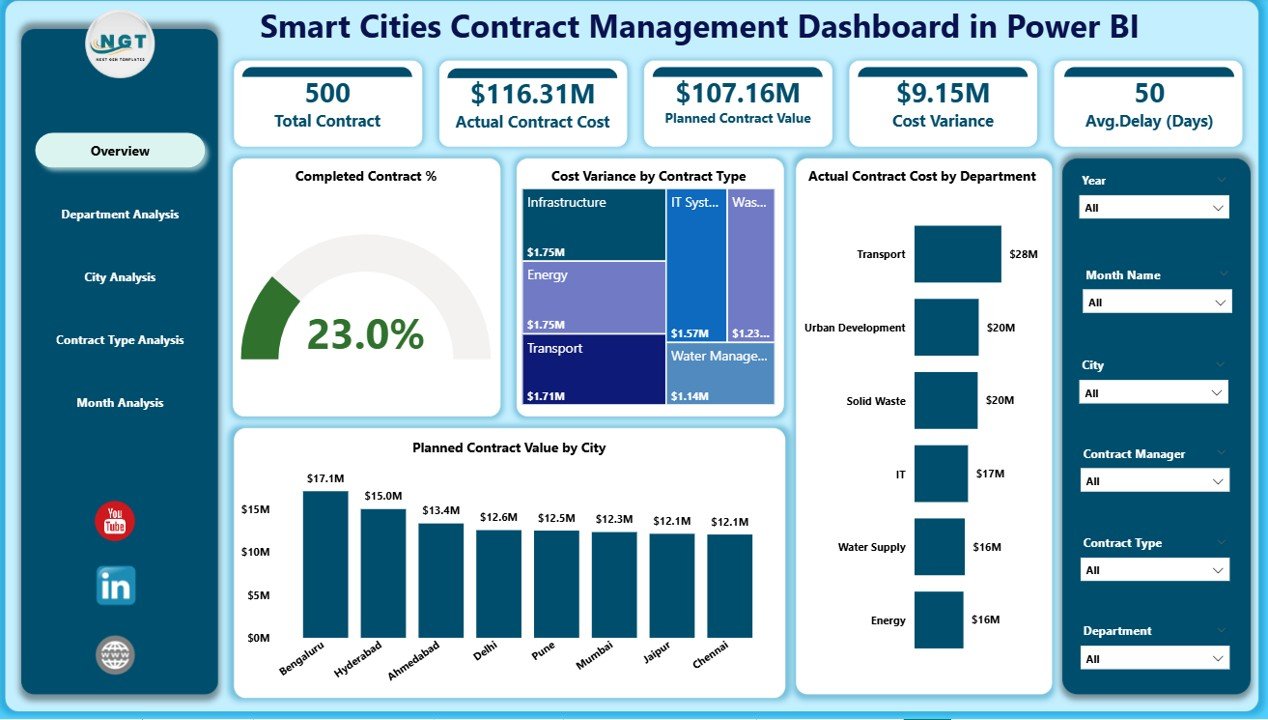
The executive snapshot that delivers instant clarity on overall contract health.
Includes:
-
KPI Cards: Completed Contract %, Total Cost Variance, Actual Contract Cost, Planned Contract Value
-
Completed Contract %
-
Cost Variance by Contract Type
-
Actual Contract Cost by Department
-
Planned Contract Value by City
This page allows leadership to identify risks and opportunities within seconds.
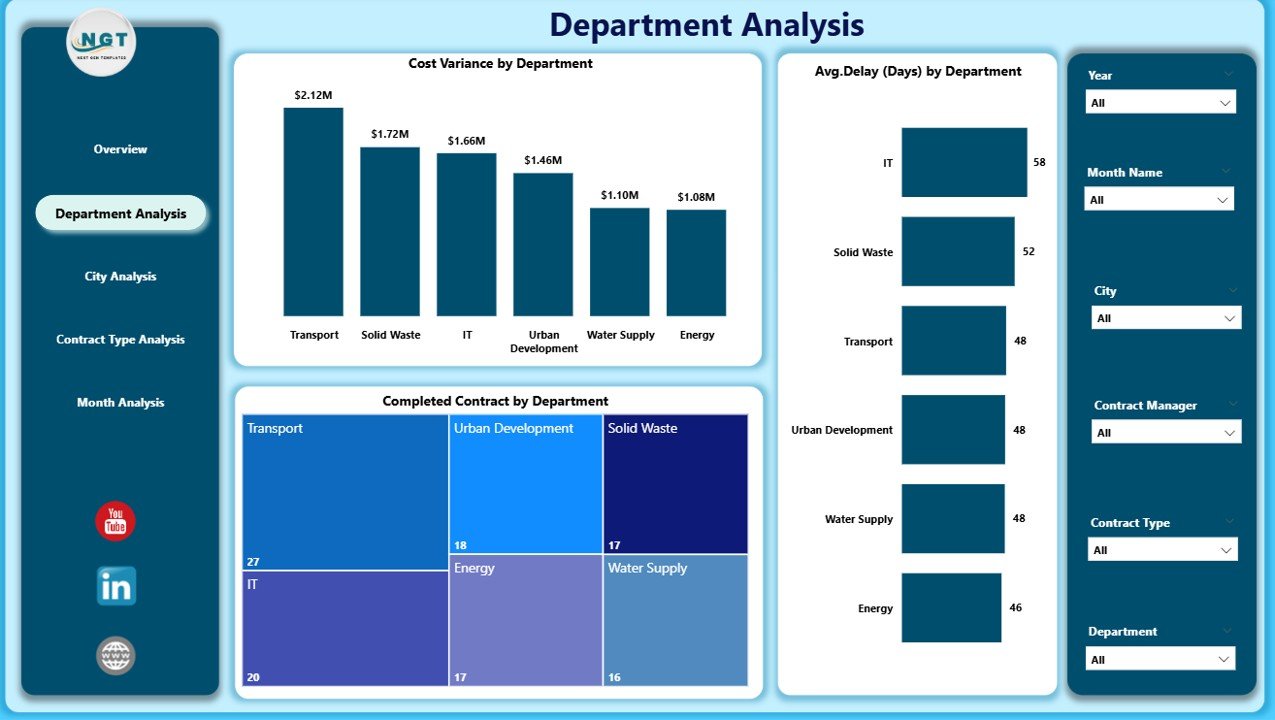
📄 Department Analysis Page
Focuses on department-level accountability and efficiency.
Includes:
-
Cost Variance by Department
-
Average Delay by Department
-
Completed Contract % by Department
Helps identify departments causing delays or cost overruns and supports corrective actions.
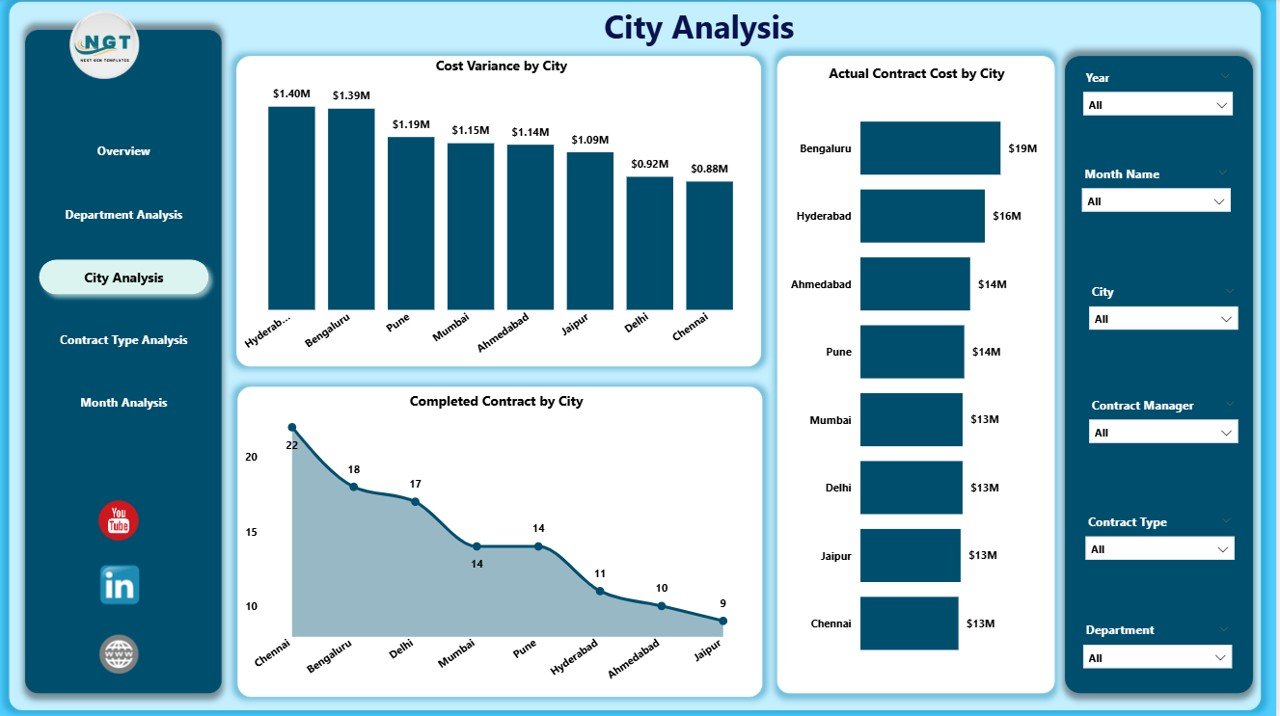
📄 City Analysis Page
Provides city-wise contract insights for multi-city smart initiatives.
Includes:
-
Cost Variance by City
-
Actual Contract Cost by City
-
Completed Contract % by City
Enables benchmarking between cities and highlights locations needing attention.
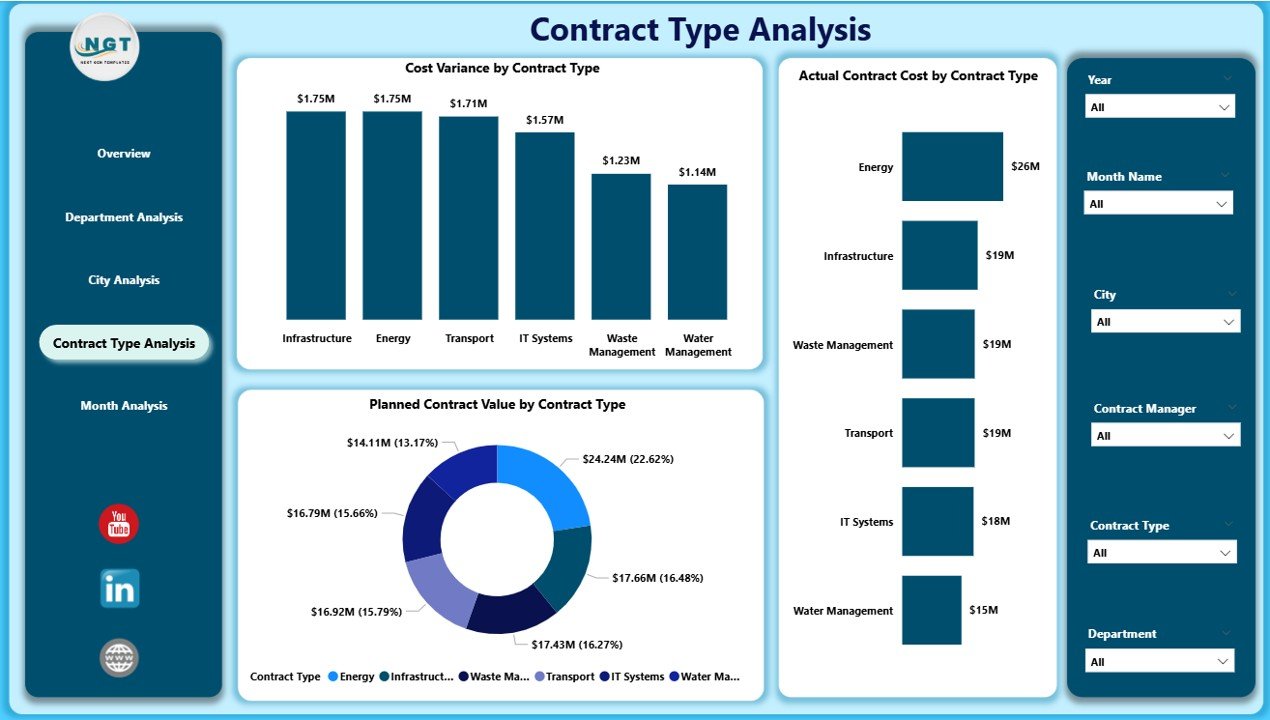
📄 Contract Type Analysis Page
Analyzes contract behavior by category.
Includes:
-
Cost Variance by Contract Type
-
Actual Contract Cost by Contract Type
-
Planned Contract Value by Contract Type
Supports smarter contract planning and negotiation strategies.
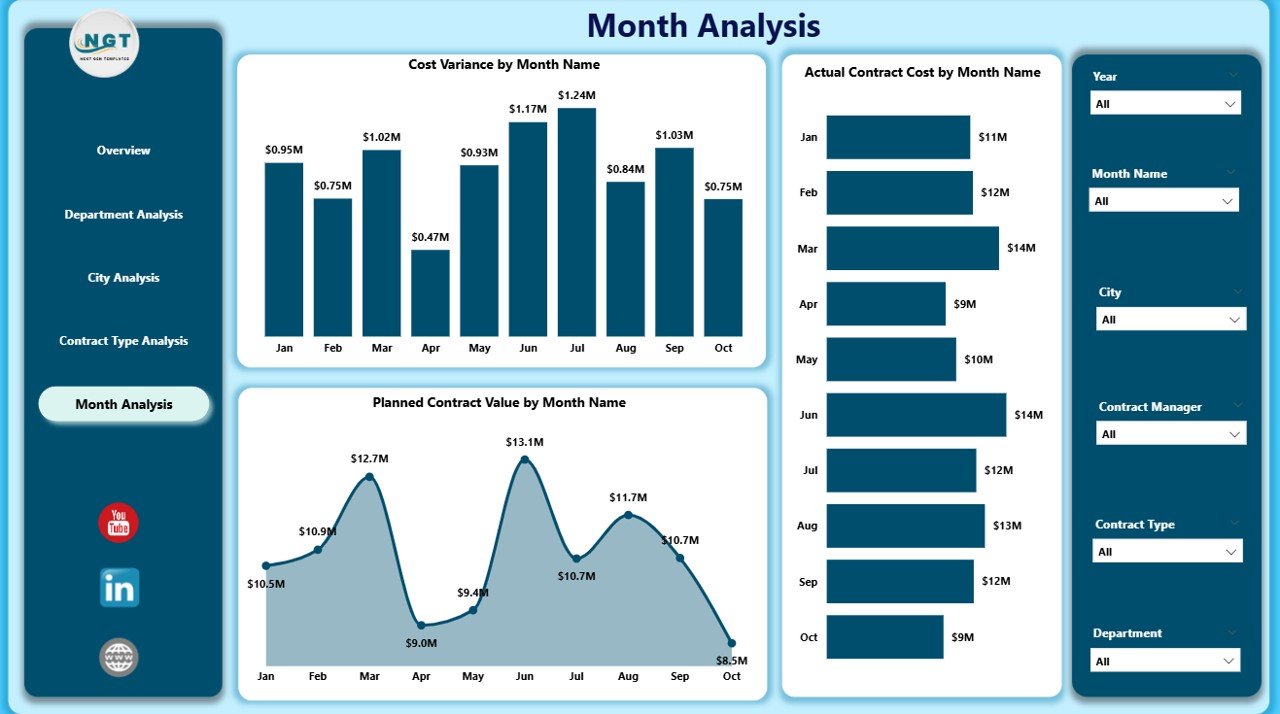
📄 Monthly Trends Page
Tracks contract performance over time.
Includes:
-
Cost Variance by Month
-
Actual Contract Cost by Month
-
Planned Contract Value by Month
Helps forecast future risks, spending patterns, and budget requirements.
How to Use the Smart Cities Contract Management Dashboard in Power BI 🛠️
1️⃣ Connect contract data from Excel, ERP, or databases
2️⃣ Refresh the Power BI dashboard
3️⃣ Use slicers to filter by city, department, contract type, or time
4️⃣ Review KPIs, cost variance, and completion status
5️⃣ Use insights for governance, reviews, and planning
No advanced technical skills are required. The dashboard is intuitive and interactive.
Who Can Benefit from This Smart Cities Contract Dashboard 👥
🏙️ Smart City Authorities & Administrators – Monitor contract governance
🏛️ Urban Planning Teams – Track multi-city initiatives
💼 Contract & Procurement Managers – Control cost and delays
💰 Finance & Budget Teams – Improve financial oversight
📊 Infrastructure & Program Managers – Support data-driven execution
Ideal for both small smart city programs and large, multi-city deployments.


Reviews
There are no reviews yet.