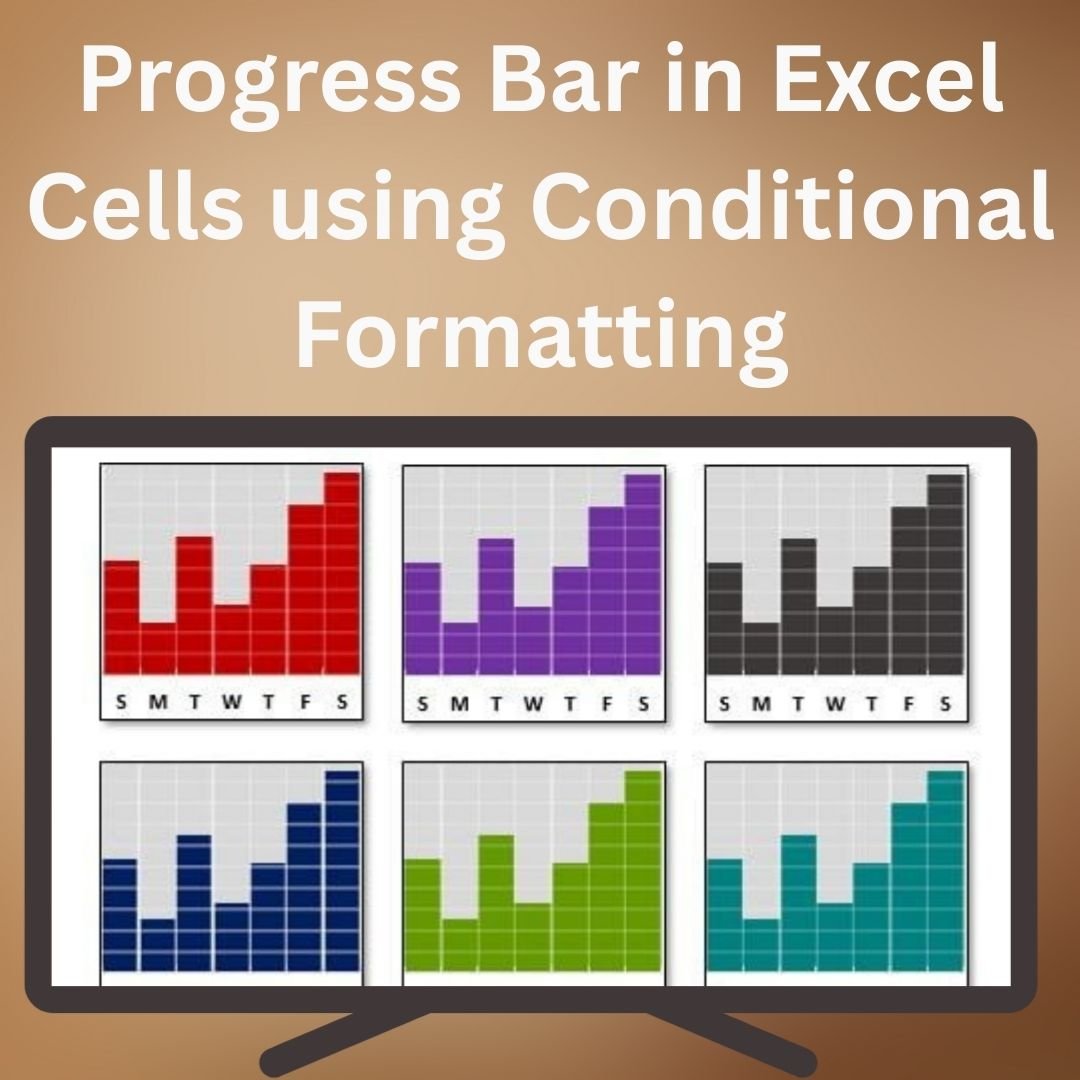
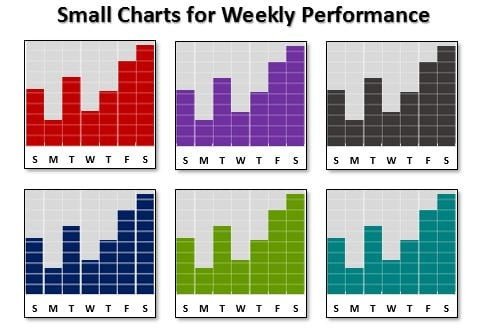
The Small Charts for Weekly Performance in Excel offer a quick and effective way to track and analyze weekly performance data. These compact yet informative charts are perfect for those who need to present data in a simplified and visually appealing format. Whether you are tracking sales, employee performance, project progress, or any other metric, these small charts help you visualize trends and make data-driven decisions.
These charts are designed to be simple and easy to integrate into your existing reports or dashboards. With their clear design and automatic updates, the Small Charts for Weekly Performance make performance analysis more accessible and easier to interpret. They are customizable, so you can adjust the design to match your business’s branding or reporting style.
Key Features of the Small Charts for Weekly Performance
📌 Compact and Effective Data Visualization
These small charts pack a lot of power in a compact format. They offer an efficient way to display weekly performance data without taking up too much space on your dashboard or report. Use them to highlight key metrics, track trends, and make quick decisions based on performance data.
🛠 Customizable Chart Types
Choose from a variety of chart types that best suit your data, including bar charts, line charts, or sparkline-style charts. You can easily switch between different chart styles to find the one that works best for your performance metrics.
💡 Clear and Concise Data Presentation
The small chart format provides a clean and easy-to-understand way to present performance trends. With minimal design, these charts focus purely on the data, ensuring that your audience can quickly grasp key insights.
🔢 Weekly Data Tracking
These charts are specifically designed for weekly performance tracking, allowing you to input weekly data and visualize performance trends over time. They automatically update based on the data entered, making it easy to monitor progress and identify issues.
🚀 Real-Time Data Updates
As your weekly performance data changes, the charts automatically update, providing real-time tracking and analysis. This ensures that you always have the most up-to-date information at your fingertips.
📊 Ideal for Dashboards and Reports
These Small Charts are perfect for dashboards, performance reviews, or any report where you need to track weekly progress without cluttering your space. They add visual clarity to your reports while keeping the focus on the key performance indicators (KPIs).
⚙ Easy Setup and Customization
Setting up the Small Charts for Weekly Performance is quick and easy. With clear instructions and a simple interface, you can customize the charts in just a few steps to suit your specific needs and metrics.
🚀 Why You’ll Love the Small Charts for Weekly Performance
✅ Compact and Efficient – Track weekly performance without taking up too much space. ✅ Customizable Design – Choose from various chart types and customize colors, labels, and styles. ✅ Real-Time Data Updates – Automatically update as your data changes. ✅ Perfect for Dashboards – Ideal for clear, concise performance tracking in dashboards and reports. ✅ Simple and Easy to Use – Quick setup and easy customization.
📂 What’s Inside the Small Charts for Weekly Performance?
- Compact Charts: Small, effective charts for tracking weekly data.
- Multiple Chart Styles: Bar, line, and sparkline-style charts to suit your needs.
- Customizable Layout: Adjust chart types, colors, and data labels.
- Clear Setup Instructions: Step-by-step guide to help you set up the charts.
🔍 How to Use the Small Charts for Weekly Performance
1️⃣ Download the Template – Instant access to the Excel file upon purchase. 2️⃣ Input Your Weekly Data – Enter your performance data into the provided fields. 3️⃣ Select Your Chart Type – Choose from bar, line, or sparkline charts based on your data. 4️⃣ Customize the Chart – Adjust the design to fit your branding or reporting style. 5️⃣ Track and Analyze Performance – Use the charts to monitor performance trends over time.
🎯 Who Can Benefit from the Small Charts for Weekly Performance? 🔹 Sales Teams
🔹 Project Managers
🔹 Business Analysts
🔹 HR and Operations Managers
🔹 Anyone needing to track and visualize weekly performance metrics
Track weekly performance with ease using the Small Charts for Weekly Performance in Excel. This efficient tool helps you visualize data trends and monitor progress, allowing for quick analysis and informed decision-making.
Click here to read the Detailed blog post
https://www.pk-anexcelexpert.com/small-charts-for-weekly-performance/


Reviews
There are no reviews yet.