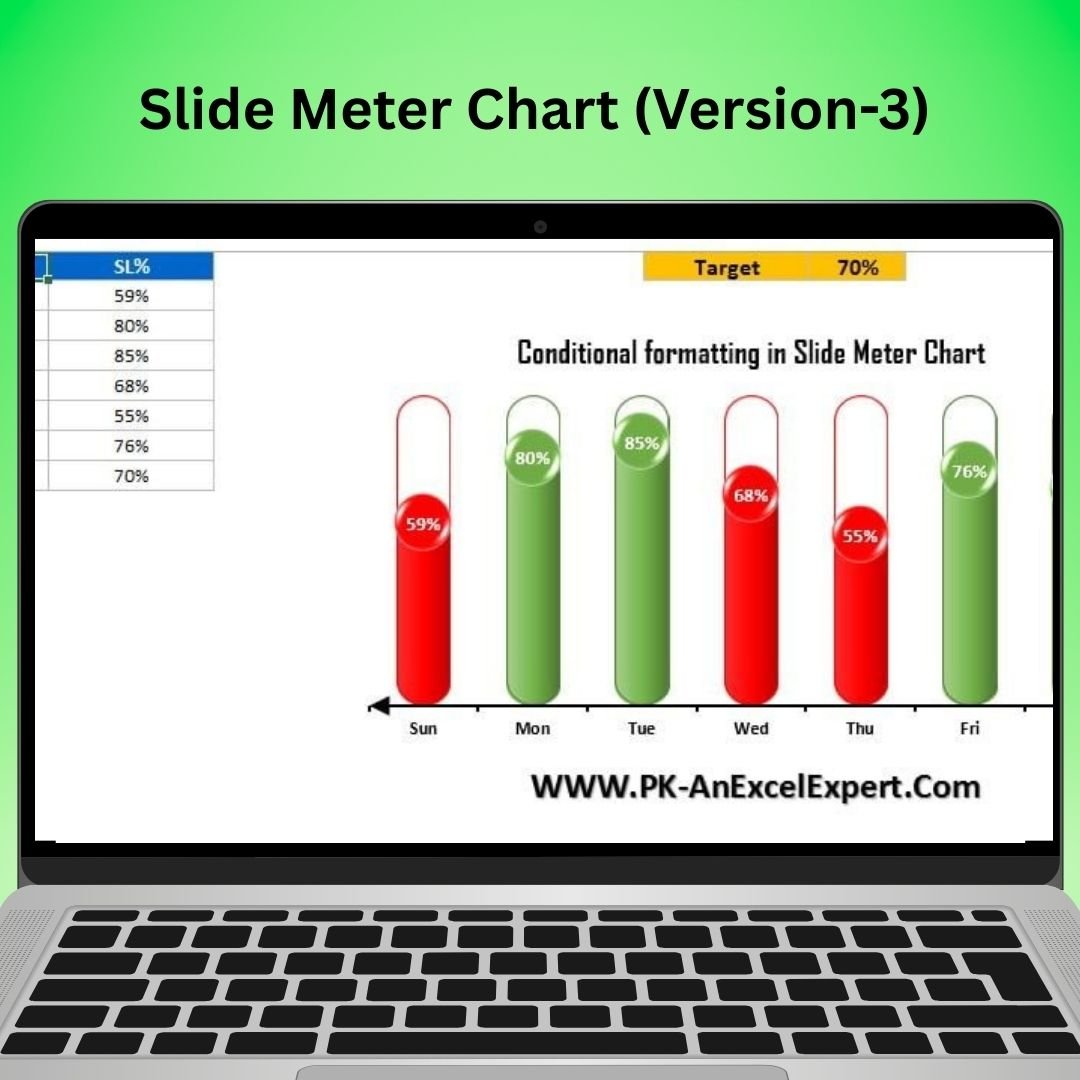
The Slide Meter Chart Version 3 in Excel is an enhanced version of the popular dynamic chart that allows you to track, visualize, and monitor performance metrics with ease. With a sleek and modern design, this chart simulates a sliding scale to represent progress toward set goals. It’s ideal for project managers, business analysts, and sales teams who need a visual tool for tracking key performance indicators (KPIs), milestone achievements, or any other goal-oriented data.
This Slide Meter Chart Version 3 allows for real-time tracking, so as your data changes, the chart dynamically updates to reflect the latest status. With customizable elements such as colors, labels, and target goals, this chart offers flexibility for a variety of use cases, from sales performance tracking to project progress monitoring. Whether you’re preparing reports, creating dashboards, or reviewing performance data, the Slide Meter Chart Version 3 will help you present your insights clearly and effectively.

Key Features of the Slide Meter Chart Version 3
📌 Enhanced Sliding Scale Design
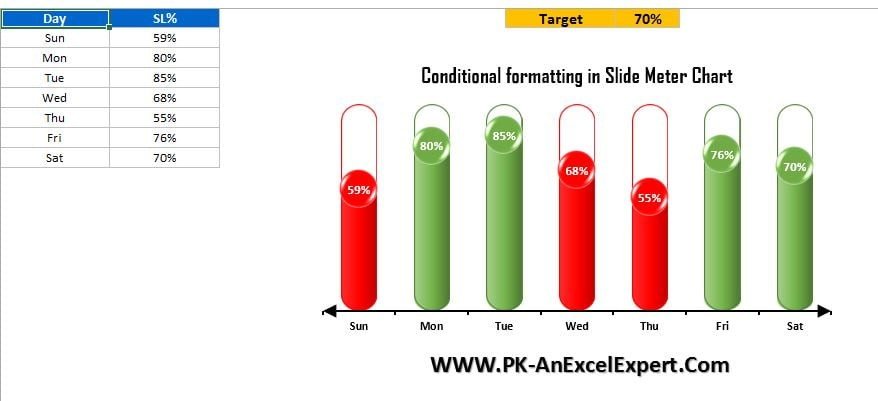
The Slide Meter Chart Version 3 features a polished and intuitive design, with a sliding scale that visually represents progress toward your goals. This makes it easy for stakeholders to quickly understand how close the data is to reaching its target.
🛠 Customizable Target and Metrics
This chart is fully customizable, allowing you to input your own metrics, set target values, and adjust the design to suit your needs. Whether tracking sales, project milestones, or other key performance indicators (KPIs), this chart adapts to your specific goals.
💡 Real-Time Progress Updates
The Slide Meter Chart Version 3 automatically adjusts as new data is entered. This dynamic feature ensures that your chart reflects real-time performance, providing up-to-date insights into progress and goal achievement.
🔢 Multiple Color Options
Choose from a variety of color schemes to visually differentiate between various stages of progress. You can use different colors to represent different performance levels, such as red for underperformance, yellow for neutral, and green for successful achievements.
🚀 Ideal for Dashboards and Reports
This chart is perfect for business dashboards, sales tracking, project monitoring, and performance reviews. Its visual appeal and ease of understanding make it an excellent addition to any report or presentation.
📊 Clear Visual Communication
With the Slide Meter Chart Version 3, you can effectively communicate progress in a clear, concise, and visually appealing manner. The sliding scale makes it easy to track goals over time, providing clear markers for each stage of achievement.
⚙ User-Friendly Setup
Despite its advanced features, the Slide Meter Chart Version 3 is easy to set up and use. With a simple interface and clear instructions, you can begin tracking your goals and metrics right away without needing advanced Excel skills.
🚀 Why You’ll Love the Slide Meter Chart Version 3
✅ Sleek Design – A modern sliding scale for visualizing performance. ✅ Customizable Metrics – Tailor the chart to your specific KPIs and goals. ✅ Real-Time Updates – Automatically adjusts as your data changes. ✅ Multiple Color Options – Choose from different color schemes to represent performance levels. ✅ Perfect for Dashboards – Ideal for reports, presentations, and dashboards. ✅ User-Friendly Interface – Easy to set up and customize.
📂 What’s Inside the Slide Meter Chart Version 3?
- Sleek Sliding Scale Design: A visually engaging sliding scale to track progress.
- Customizable Target and Metrics: Input your own data and set specific targets.
- Real-Time Data Updates: Automatic updates as you input new data.
- Multiple Color Options: Use different colors to indicate various performance levels.
- Step-by-Step Setup Instructions: Clear and easy-to-follow instructions for setup.
🔍 How to Use the Slide Meter Chart Version 3
1️⃣ Download the Template – Instant access to the Excel file upon purchase. 2️⃣ Input Your Data – Enter your data and set your targets for performance tracking. 3️⃣ Customize the Chart – Adjust the colors, labels, and other chart elements to match your needs. 4️⃣ Track Progress – Watch the chart automatically update as your data changes. 5️⃣ Share and Present – Use the chart in reports, presentations, or dashboards for clear communication.
🎯 Who Can Benefit from the Slide Meter Chart Version 3? 🔹 Business Analysts
🔹 Sales Managers
🔹 Project Managers
🔹 HR Teams
🔹 Marketing Teams
🔹 Anyone who needs to track progress toward goals or KPIs in a visual way
The Slide Meter Chart Version 3 is the perfect tool for tracking performance, setting targets, and monitoring progress. With its dynamic design and real-time updates, this tool will help you clearly communicate progress toward goals and make informed decisions based on performance data.
Click here to read the Detailed blog post
https://www.pk-anexcelexpert.com/slide-meter-chart-version-3/


Reviews
There are no reviews yet.