


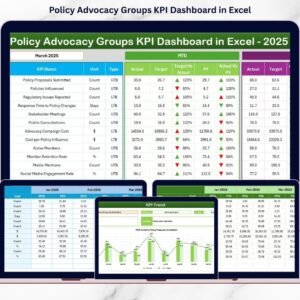
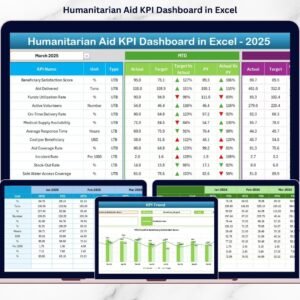
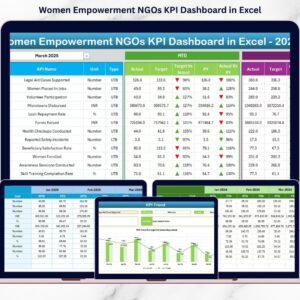
Managing ship chartering operations without clear performance visibility is risky and expensive. Charter rates fluctuate, vessel utilization shifts daily, and operating costs continue to rise. Without a structured system, decision-makers struggle to identify gaps, control margins, and act quickly. That is exactly why the Ship Chartering KPI Dashboard in Excel is a must-have performance management solution for modern maritime organizations.
This ready-to-use Excel dashboard transforms scattered chartering data into clear KPIs, comparisons, and trends. Instead of working with multiple spreadsheets and manual reports, you get one centralized, professional dashboard that shows exactly how your chartering business is performing—month by month and year to date. Best of all, it runs entirely in Microsoft Excel, so you do not need any coding, advanced tools, or expensive software.
🔑 Key Features of Ship Chartering KPI Dashboard in Excel
🚢 Centralized KPI Monitoring
Track all critical ship chartering KPIs in one structured and executive-ready dashboard.
📅 MTD & YTD Performance Tracking
Analyze Month-to-Date and Year-to-Date performance side by side for better operational and strategic decisions.
🎯 Target vs Actual Comparison
Instantly identify gaps between planned targets and actual results using variance analysis.
📊 Previous Year Comparison
Evaluate year-over-year performance trends to understand growth, seasonality, and improvement areas.
⬆⬇ Visual Performance Indicators
Conditional formatting with up and down arrows highlights performance direction instantly.
🧭 Easy Navigation with Summary Page
Jump to any worksheet using dedicated navigation buttons for faster analysis.
⚙ Fully Excel-Based & Customizable
Modify KPIs, targets, definitions, and formulas easily without technical skills.

📂 What’s Inside the Ship Chartering KPI Dashboard
This dashboard includes 7 professionally designed worksheets, each serving a clear purpose:
📌 Summary Page (Index Sheet)
Acts as the navigation hub with buttons to access all dashboard sections quickly.
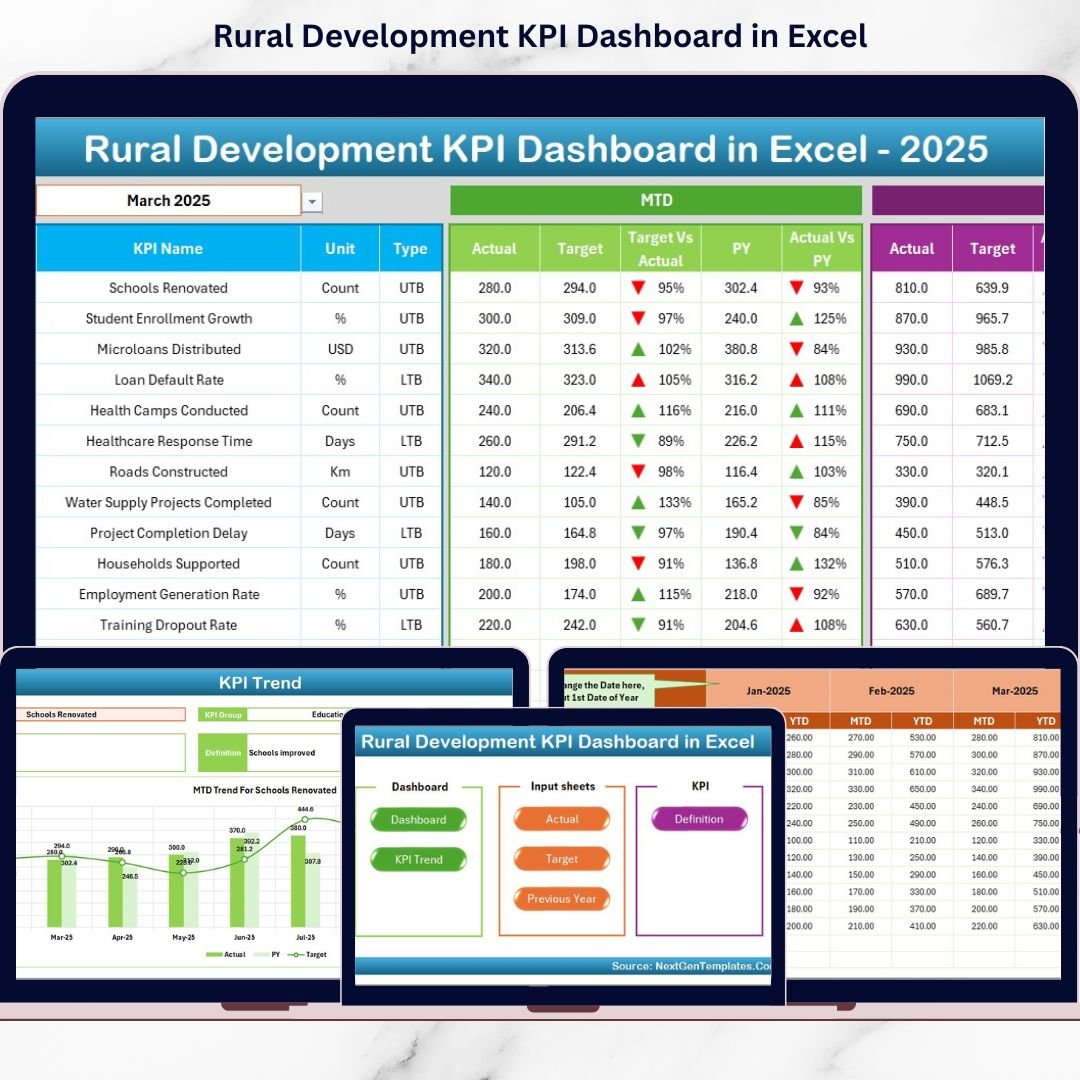
📌 Dashboard Sheet
The core dashboard displaying all KPIs in one place with:
-
Month selection (cell D3)
-
MTD Actual, Target, and Previous Year
-
YTD Actual, Target, and Previous Year
-
Target vs Actual & PY vs Actual variance indicators
📌 Trend Sheet
Analyze KPI performance trends over time with:
-
KPI selector (cell C3)
-
KPI Group, Unit, Formula, and Definition
-
MTD & YTD trend charts for Actual, Target, and Previous Year
📌 Actual Numbers Input Sheet
Enter real performance data with:
-
Month selector
-
Structured MTD and YTD input layout
-
Error-free data consistency
📌 Target Sheet
Define monthly and cumulative targets for every KPI.
📌 Previous Year Sheet
Store historical data for accurate year-over-year comparison.
📌 KPI Definition Sheet
Document KPI names, formulas, units, and definitions for transparency and audit readiness.
🛠 How to Use the Ship Chartering KPI Dashboard
1️⃣ Enter actual performance data in the Actual Numbers Input Sheet
2️⃣ Define monthly and YTD targets in the Target Sheet
3️⃣ Add previous year figures in the Previous Year Sheet
4️⃣ Select the month from the drop-down on the Dashboard Sheet
5️⃣ Review MTD, YTD, Target vs Actual, and PY vs Actual performance instantly
6️⃣ Use the Trend Sheet for deep KPI-level analysis and review meetings
No advanced Excel skills are required—basic Excel knowledge is enough to get started immediately.
👥 Who Can Benefit from This Ship Chartering KPI Dashboard
⚓ Ship Owners & Operators
📦 Chartering Managers
💰 Maritime Finance Teams
🛠 Operations Managers
📈 Fleet & Performance Analysts
🏢 Shipping Company Executives
Whether you manage a small fleet or a large shipping operation, this dashboard adapts to your needs.
Click here to read the Detailed Blog Post
Watch the step-by-step video tutorial:


Reviews
There are no reviews yet.