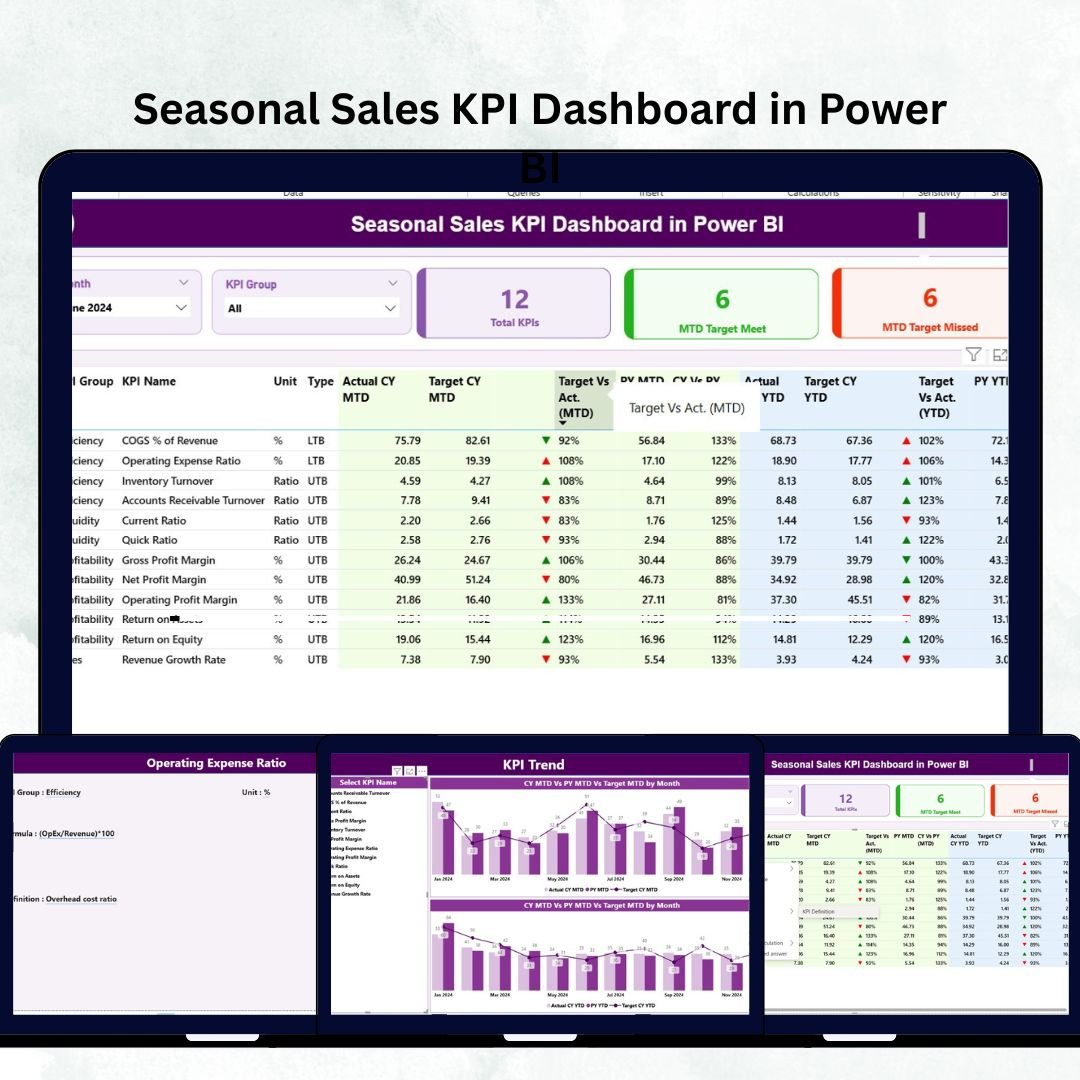
The Seasonal Sales KPI Dashboard in Power BI is your ultimate business intelligence companion — designed to help you unlock sales insights, visualize performance trends, and make smarter seasonal decisions. Whether your business thrives during the holidays, tourist peaks, or back-to-school rush, this dashboard transforms your raw data into actionable stories that drive growth and profitability.Seasonal Sales KPI Dashboard in Power BI
🌟 Key Features of the Seasonal Sales KPI Dashboard in Power BI
✨ Dynamic Seasonal Insights: Instantly track your performance across different months and seasons. Power BI’s smart visuals reveal peaks, dips, and hidden opportunities.
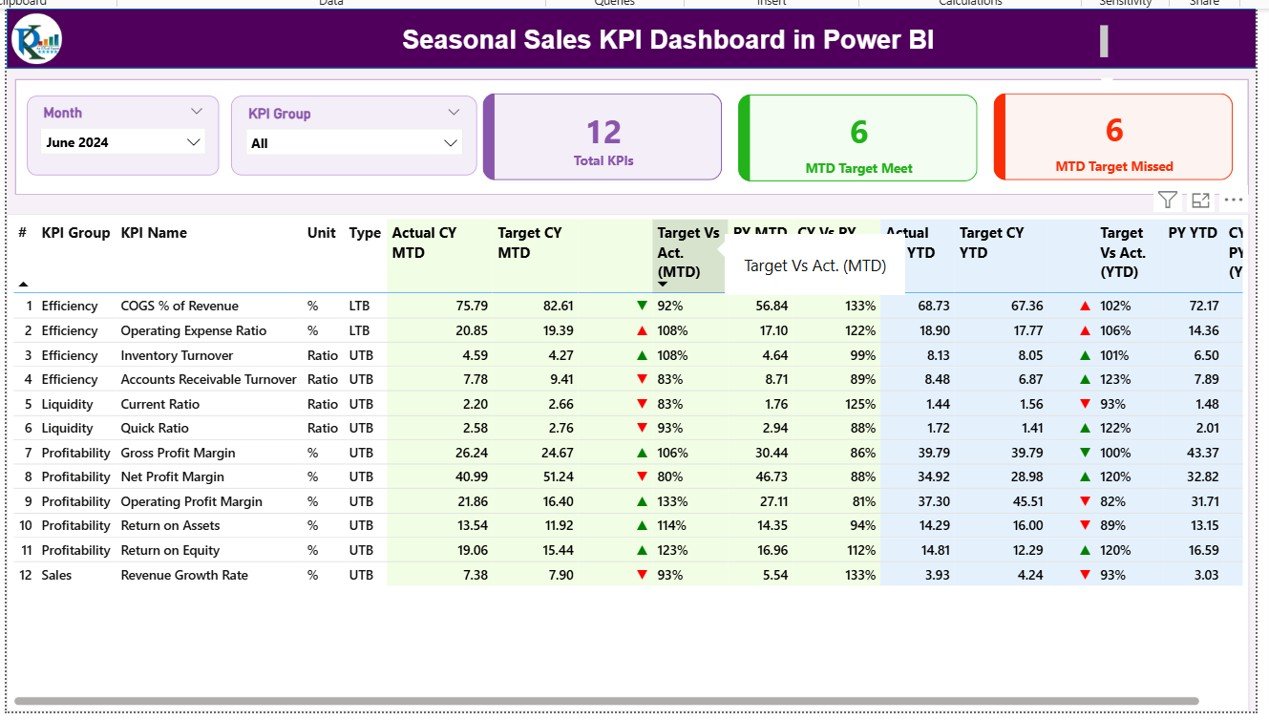
📊 Interactive Filters & Slicers: Filter data by month or KPI group to focus only on what matters most.
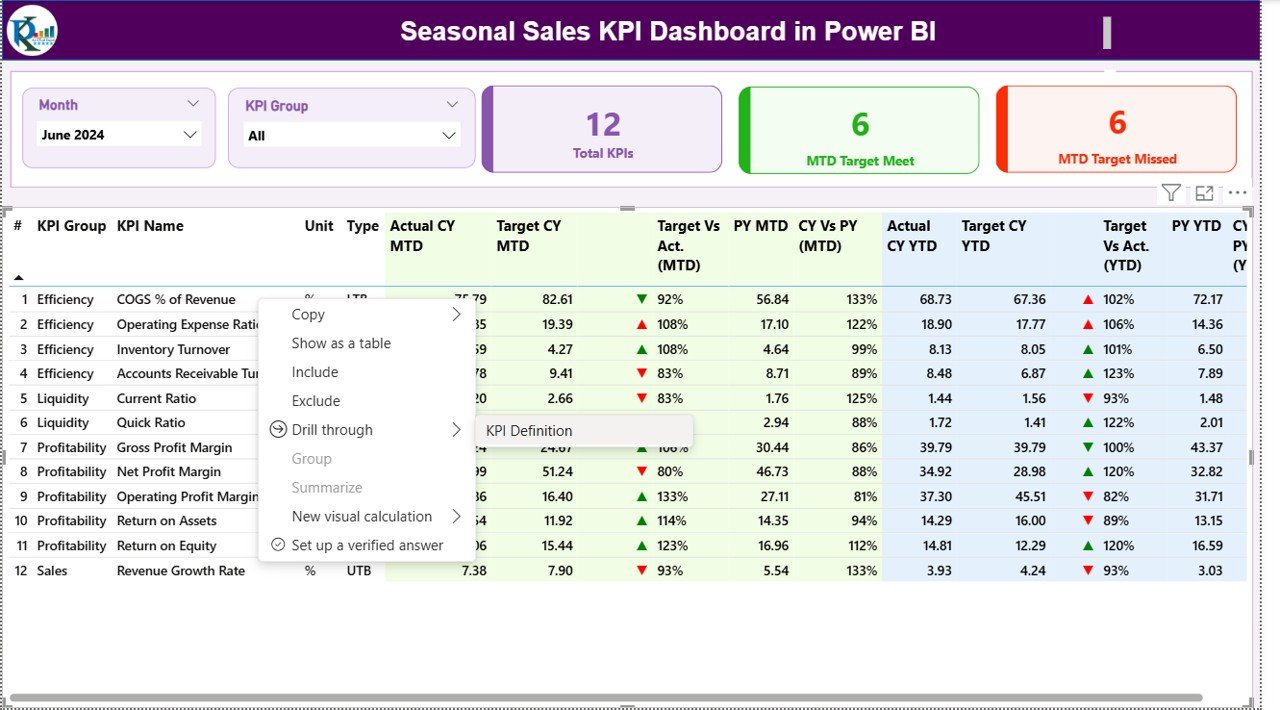
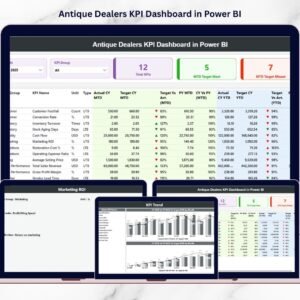
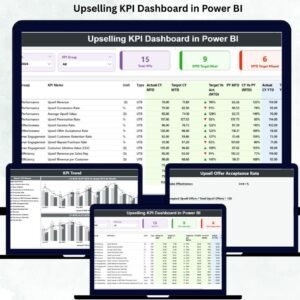
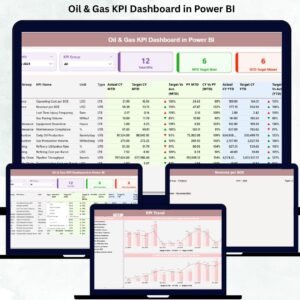
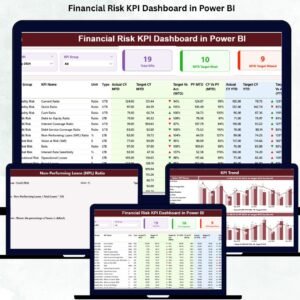
📈 Smart KPI Cards: Get a quick view of total KPIs, MTD target achievements, and missed targets with color-coded indicators.
🧮 Real-Time Target vs Actual Comparison: See exactly where you stand against goals — with green ▲ for improvement and red ▼ for decline.Seasonal Sales KPI Dashboard in Power BI
💡 Excel Integration: Seamlessly linked with your Excel data source for automatic updates and high accuracy.
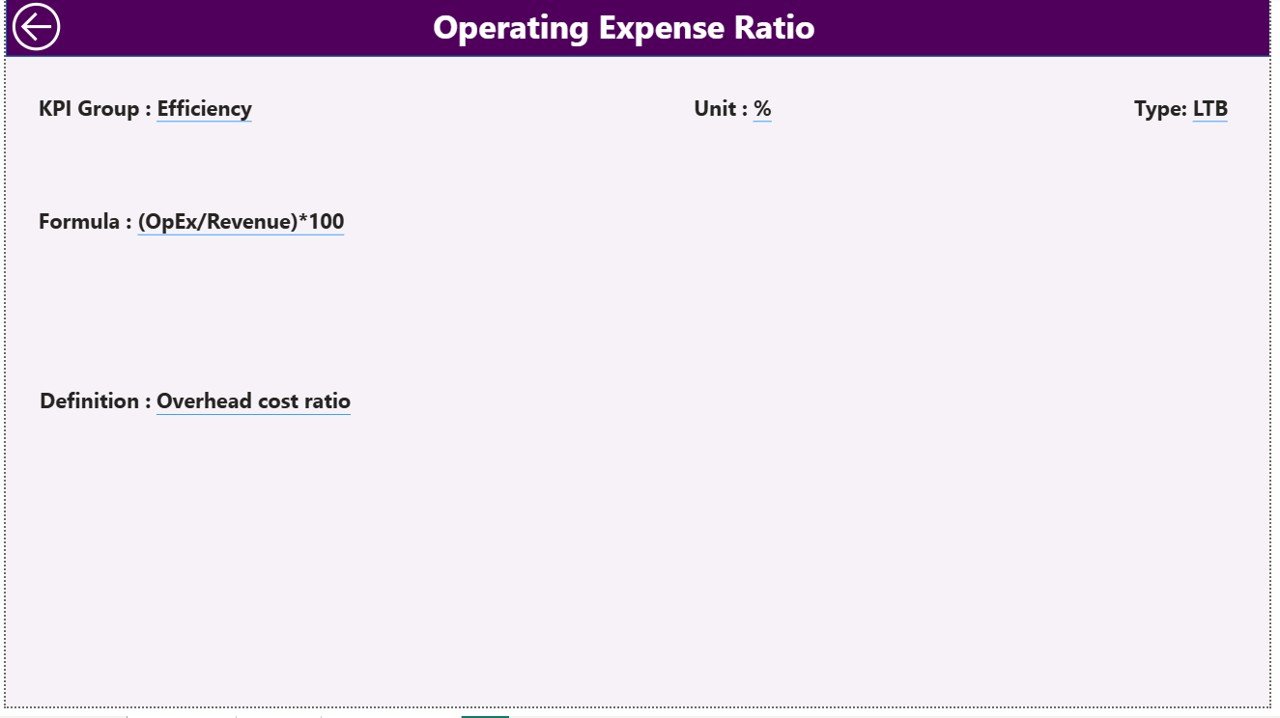
📑 KPI Definitions Page: Access precise KPI formulas, meanings, and logic through the built-in drill-through feature.
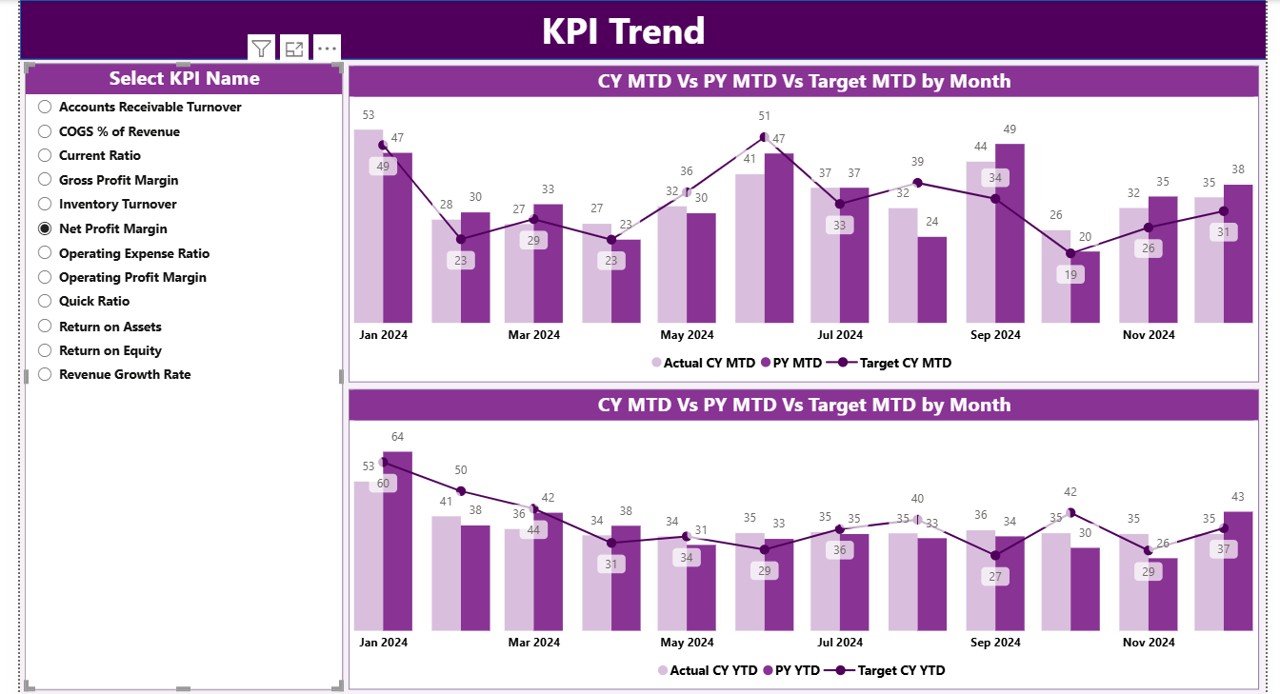
🔁 Year-over-Year Analysis: Compare current year vs. previous year data to evaluate progress and seasonal performance changes.
⚙️ Customizable & Scalable: Adapt it for any industry — retail, travel, hospitality, or manufacturing.Seasonal Sales KPI Dashboard in Power BI
📦 What’s Inside the Seasonal Sales KPI Dashboard in Power BI
This ready-to-use Power BI template comes packed with powerful analytical sections designed for clarity and action:
🔹 Summary Page: Your control hub! View overall KPI performance, identify trends, and assess progress at a glance.
🔹 KPI Trend Page: Dive deep into each KPI’s performance curve through combo charts showing actuals vs. targets vs. previous year.
🔹 KPI Definition Page: A detailed sheet explaining each metric’s definition, unit, and formula for transparent analysis.
🔹 Excel Data Source: Three structured sheets — Input_Actual, Input_Target, and KPI_Definition — make data management effortless.
Every element of this dashboard is built for precision, performance, and ease of use. With automatic refresh capabilities, your visuals always stay up to date.
🧭 How to Use the Seasonal Sales KPI Dashboard in Power BI
🪄 Step 1: Fill your Excel file with monthly actuals and target data.
🔄 Step 2: Refresh the Power BI file to sync new information automatically.
📅 Step 3: Use slicers on the Summary Page to analyze results by month or KPI category.
📊 Step 4: Explore the KPI Trend Page for a deeper month-by-month performance comparison.
🧾 Step 5: Drill through to KPI Definition Page to understand metrics clearly.
🤝 Step 6: Share insights with your team using Power BI Service or embed it in your internal dashboards.
Within minutes, you’ll have a complete, professional dashboard that visualizes your seasonal performance like never before.
🎯 Who Can Benefit from This Seasonal Sales KPI Dashboard
👨💼 Sales Managers: Track seasonal goals and identify which campaigns drive results.
🛍️ Retailers: Understand which products perform best during festive seasons.
✈️ Tourism & Hospitality Businesses: Forecast demand for peak travel months and off-season planning.
🏭 Manufacturers: Align production targets with seasonal sales forecasts.
💻 E-commerce Professionals: Monitor holiday and clearance season performance.
📈 Marketing Teams: Plan promotions and measure campaign effectiveness.
🧠 Business Analysts: Discover insights from real-time visuals and data models.
💼 Decision-Makers: Make faster, data-backed strategic choices to boost ROI.
💎 Why You’ll Love It
✅ Real-Time Updates: Reflects live data from your Excel source.
✅ Easy to Customize: Modify KPIs, visuals, or categories effortlessly.
✅ Professional-Grade Visuals: Clean layout with intuitive charts and performance cards.
✅ Forecasting Potential: Identify sales patterns and anticipate demand shifts.
No more spreadsheets full of confusing numbers — get a vibrant, easy-to-navigate Power BI dashboard that tells your business story instantly.


Reviews
There are no reviews yet.