📊 Sales Target Dashboard in Power BI
In today’s highly competitive business environment, sales performance tracking is essential for growth. Relying on static spreadsheets and fragmented reports makes it difficult to understand whether your sales team is hitting their targets, which regions need attention, and which products require a different strategy.
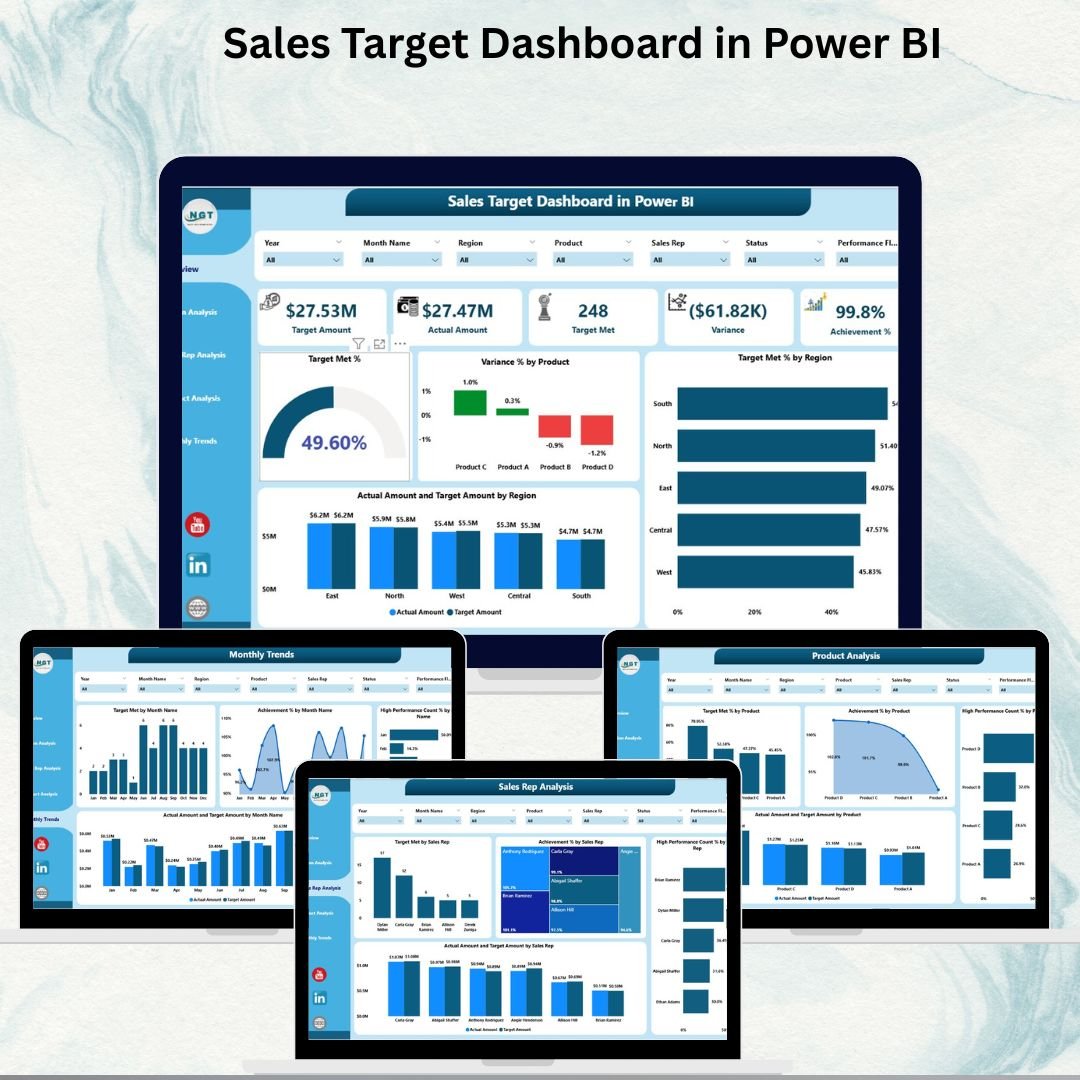
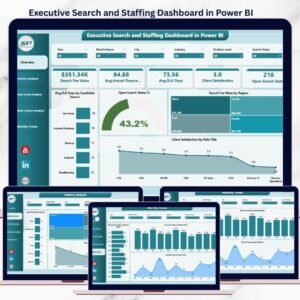
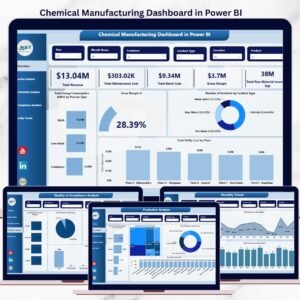
The Sales Target Dashboard in Power BI is a ready-to-use, interactive solution that helps you track actual sales versus targets across regions, sales reps, and product lines — in real time. Instead of sifting through multiple files, this dashboard consolidates all your important metrics into one clean, visual platform so you can make faster and smarter decisions.
This dashboard connects directly to your Excel data input and transforms it into meaningful insights such as Target Met %, Variance %, Achievement %, High Performance %, and more. It is the ideal tool for sales managers and leadership teams who want to promote transparency, accountability, and performance excellence.
✨ Key Features of the Sales Target Dashboard in Power BI
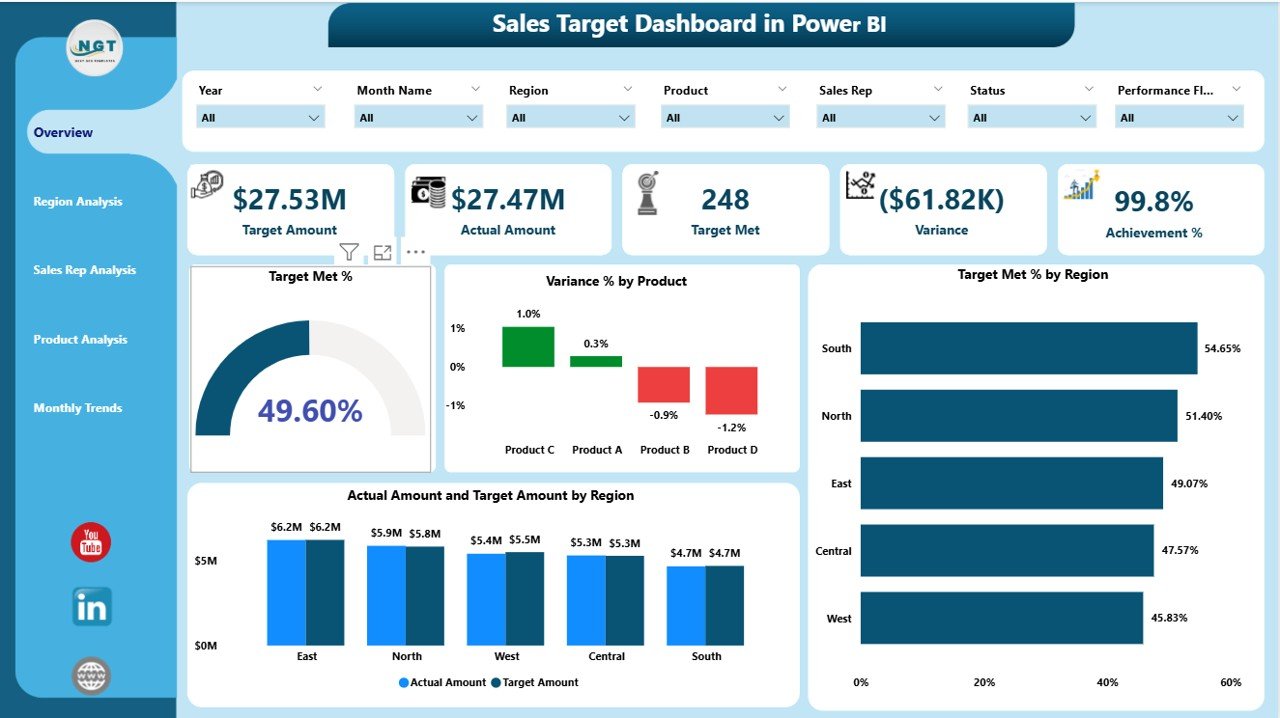
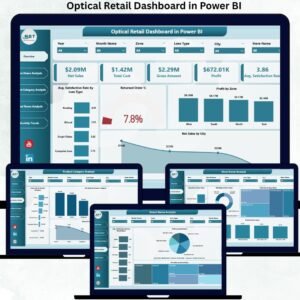
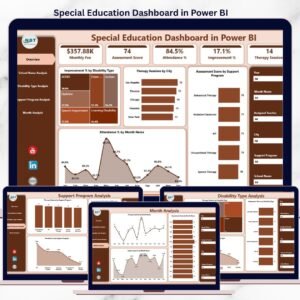
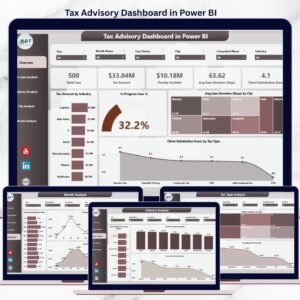
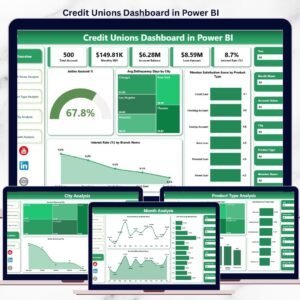
✅ Overview Page – High-level snapshot of total targets, target met %, variance %, and performance by region / product
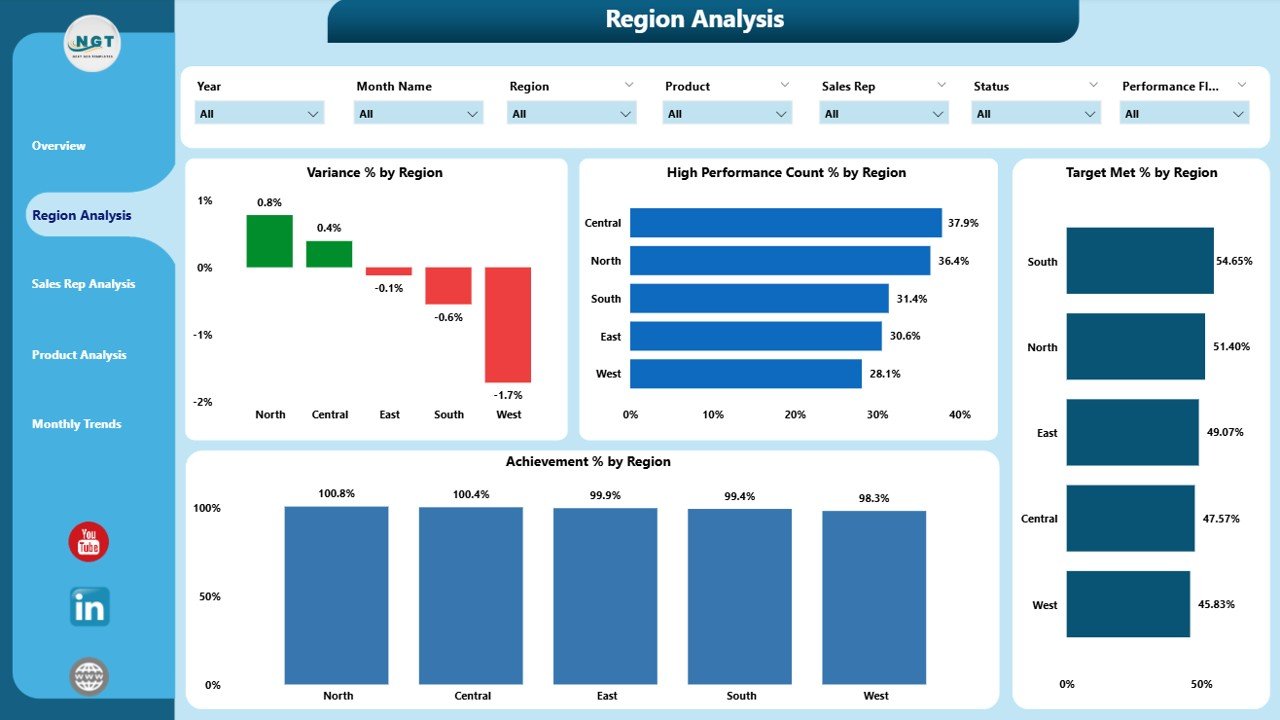
✅ Region Analysis Page – Compare Target Met %, Achievement %, and High Performance % across regions
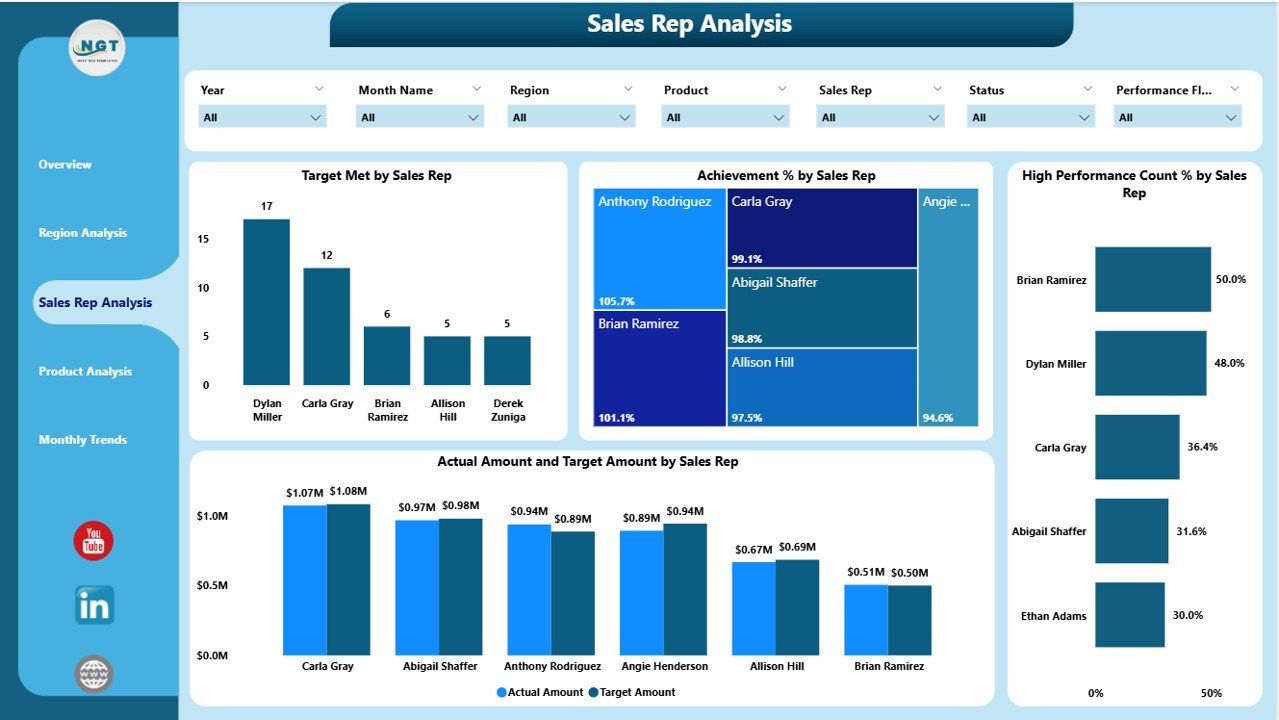
✅ Sales Rep Page – Monitor individual sales rep performance and spot training/support needs
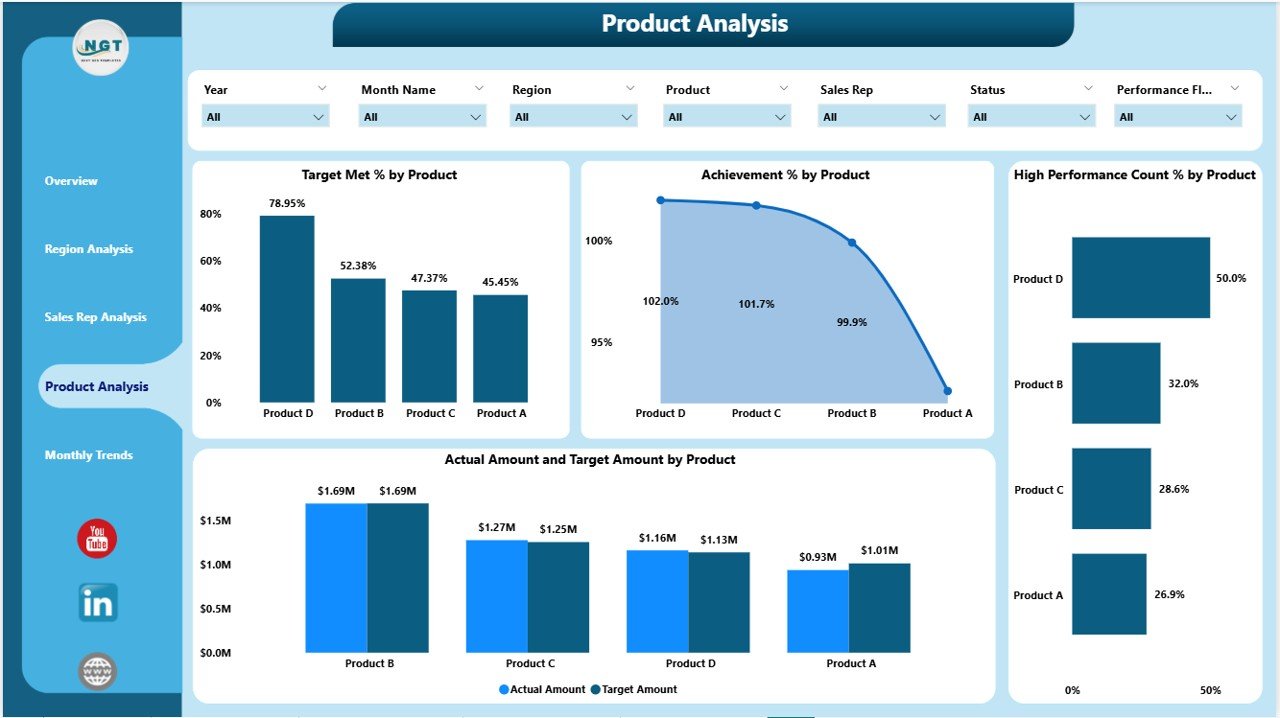
✅ Product Page – Quickly identify top-performing products and those that need more attention
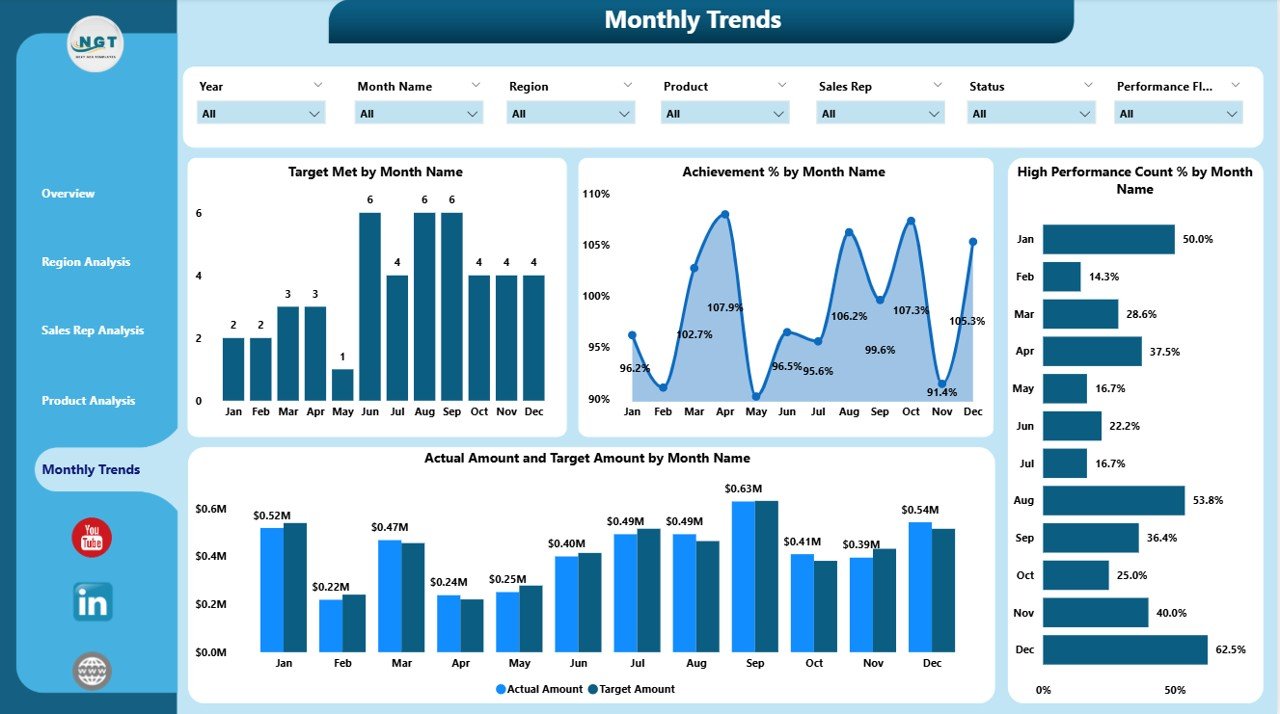
✅ Monthly Trends Page – Track trends over time to spot seasonality and recurring patterns
✅ Interactive Filters (Slicers) – Filter by month, region, product, or rep with a single click
✅ Real-Time Comparison – Actual vs Target vs Previous Year (MTD & YTD) for every KPI
✅ Drill-Down Capability – Navigate from aggregate summaries to granular detail in seconds
✅ Excel Data Input – Update data easily without any coding or complex modeling
📂 What’s Included in the Dashboard
| Page | Purpose |
|---|---|
| Overview | Overall sales performance snapshot |
| Region Analysis | Compare targets vs actuals by region |
| Sales Rep Analysis | KPI breakdown for each sales representative |
| Product Analysis | KPI breakdown for each product or product category |
| Monthly Trends | Time-series view (Actual vs Target vs PY) |
🛠 How to Use the Sales Target Dashboard
Step 1: Fill in your Actual and Target values in the Excel data file
Step 2: Open Power BI and click Refresh to update the dashboard automatically
Step 3: Use the Month, Region, and Product slicers to focus your analysis
Step 4: Explore Region / Sales Rep / Product pages for deeper insight
Step 5: Review Monthly Trends to adjust strategy and forecasting
🎯 Who Can Benefit from This Dashboard
👨💼 Sales Managers – Monitor goals and support low-performing teams
📈 Executives – Get real-time visibility into overall sales health
👥 Sales Representatives – See exactly how close they are to their targets
📊 Business Analysts – Analyze trends and benchmark performance across areas
🚀 Why You Need This Dashboard
-
Real-Time Visibility – No more manual updates or stale data
-
Better Decision Making – Instantly identify risk areas and improvement opportunities
-
Motivates Teams – Builds healthy competition and accountability
-
Quick Implementation – Plug in your data and start tracking immediately
-
Flexible and Customizable – Add new KPIs or pages as your business grows
📖 Click here to read the Detailed blog post
Visit our YouTube channel to learn step-by-step video tutorials


Reviews
There are no reviews yet.