
Running a SaaS company is thrilling — but let’s be honest, it’s also intense. Every month you track subscriptions, churn, CAC, MRR, ARR, retention, and engagement. Investors want clear reports. Teams need direction. And you must make fast, data-backed decisions.What if you could track everything in one structured system?The SaaS Business KPI Scorecard In Excel is a ready-to-use, powerful Excel template designed specifically for SaaS companies. It centralizes your most important metrics, compares Actual vs Target, and provides instant MTD and YTD analysis — all inside a clean, interactive scorecard.No complex tools. No expensive software. Just clarity, control, and confident decision-making.
🚀 Key Feature of SaaS Business KPI Scorecard In Excel
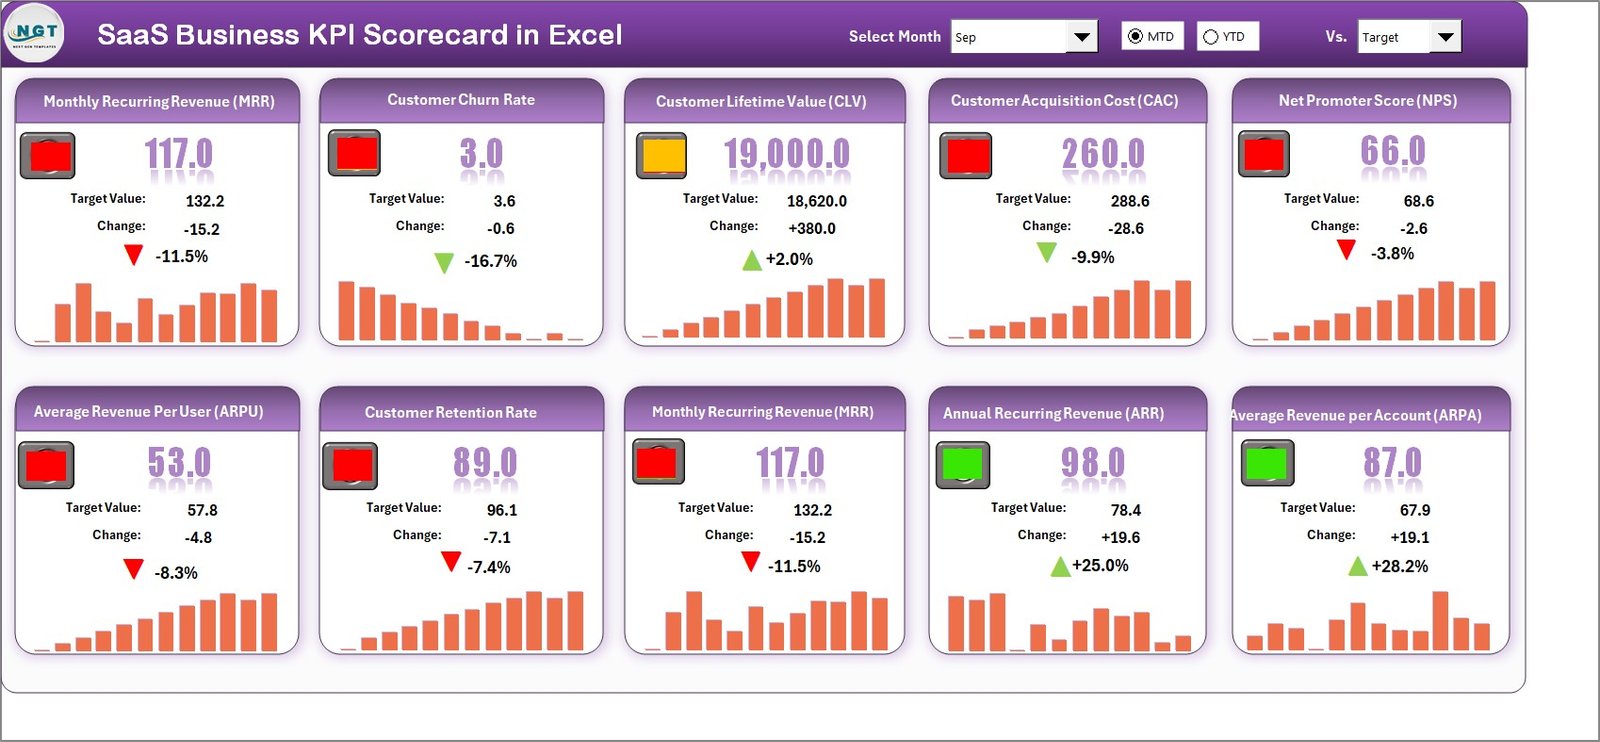
📊 Dynamic Scorecard Dashboard
Monitor 10 core SaaS KPIs in one consolidated view with automatic updates using dropdown selections.
📅 MTD & YTD Analysis
Switch between Month-to-Date and Year-to-Date views instantly for short-term and long-term insights.
🎯 Actual vs Target Comparison
Quickly identify performance gaps using structured variance tracking.
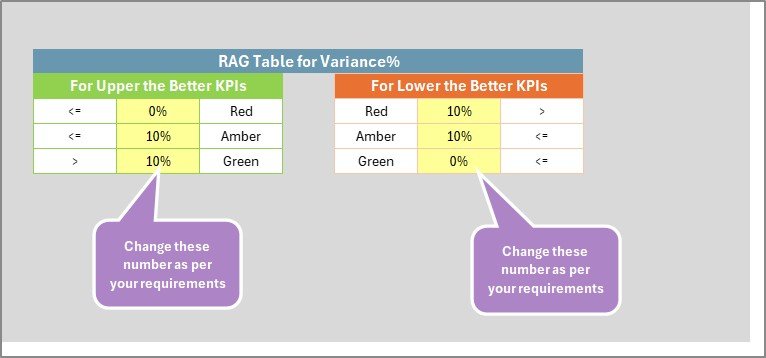
🚦 Smart Visual Indicators
Traffic light signals and conditional formatting highlight underperforming KPIs immediately.
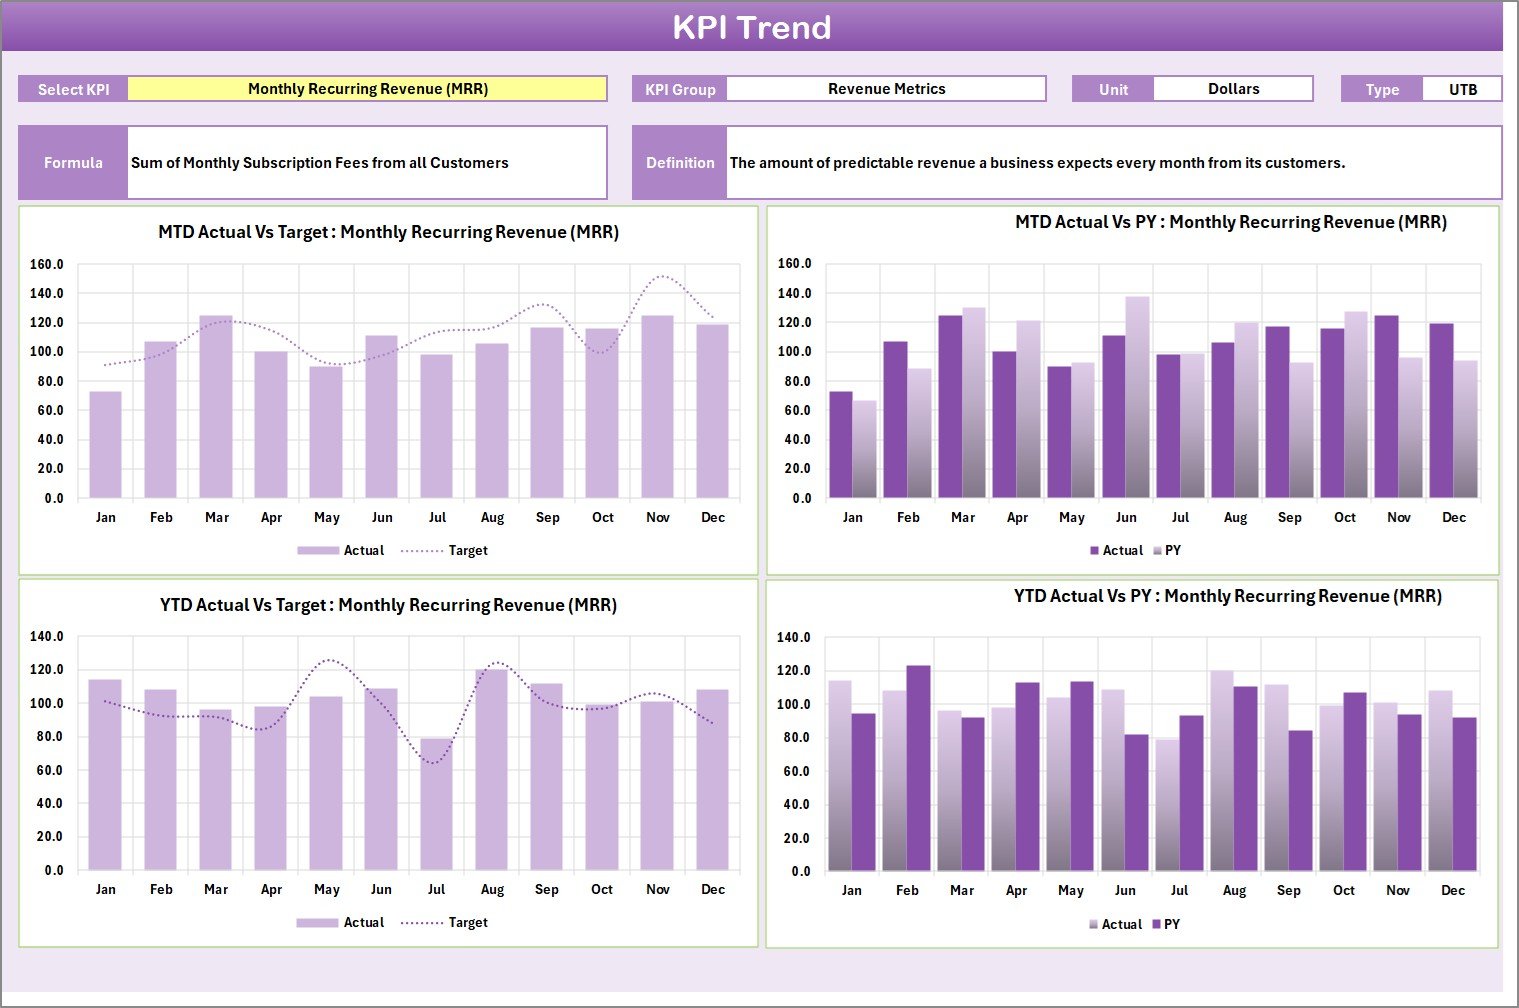
📈 KPI Trend Analysis Sheet
Analyze MTD trends, YTD trends, and Actual vs Target vs Previous Year comparisons for deeper insights.
🧮 Fully Editable Input Data Sheet
Easily update monthly actuals and targets. The entire scorecard refreshes automatically.
📘 Structured KPI Definition Sheet
Define KPI Name, Group, Unit, Formula, and Type (Lower the Better / Upper the Better) for clarity across teams.
💡 Customizable & Flexible
Add new KPIs, adjust formulas, and tailor the template to your business model.
📦 What’s Inside the SaaS Business KPI Scorecard In Excel
This professional template includes 4 well-structured worksheets:
1️⃣ Scorecard Sheet
The main dashboard showing 10 KPIs with performance indicators, dropdown filters, and visual clarity.
2️⃣ KPI Trend Sheet
Detailed analysis page where you select a KPI and instantly view trend charts and definitions.
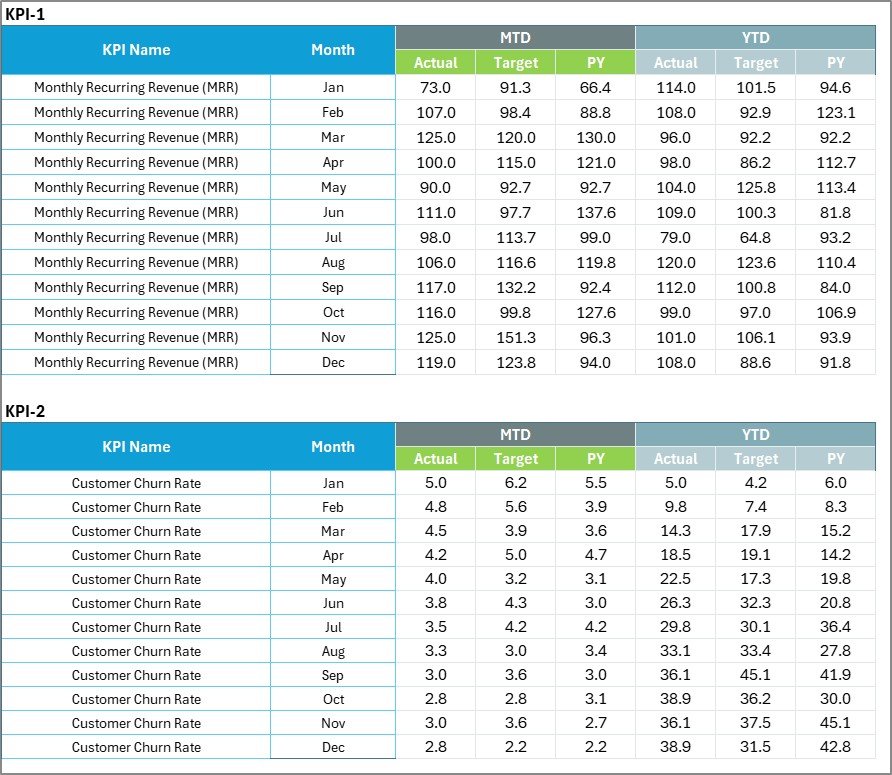
3️⃣ Input Data Sheet
Centralized data entry sheet for monthly actual and target values.
4️⃣ KPI Definition Sheet
Structured documentation area for defining formulas and KPI logic to eliminate confusion.
The template supports tracking metrics like:
-
Monthly Recurring Revenue (MRR)
-
Annual Recurring Revenue (ARR)
-
Customer Acquisition Cost (CAC)
-
Customer Lifetime Value (CLV)
-
Churn Rate
-
Net Revenue Retention
-
ARPU
-
Conversion Rate
-
Active Users
-
Gross Margin
Everything is organized. Everything is connected.
🛠 How to Use the SaaS Business KPI Scorecard In Excel
Using this template is simple:
Step 1: Enter your KPIs and formulas in the KPI Definition Sheet.
Step 2: Input monthly Actual and Target values in the Data Sheet.
Step 3: Select Month, MTD, or YTD in the Scorecard dropdown.
Step 4: Review visual indicators and performance gaps.
Step 5: Use the Trend Sheet to analyze deeper insights.
Within minutes, you’ll transform raw SaaS data into structured performance intelligence.
👥 Who Can Benefit from This SaaS Business KPI Scorecard In Excel
This template is perfect for:
✔ SaaS Founders who need investor-ready reports
✔ Startup Teams looking for structured KPI tracking
✔ Finance Managers managing revenue and margins
✔ Growth Marketers monitoring CAC and conversion
✔ Operations Managers tracking efficiency
✔ Product Managers analyzing engagement
Even early-stage SaaS startups can implement this scorecard immediately and bring discipline to growth tracking.
This KPI Scorecard doesn’t just show numbers — it gives you direction.
If churn increases, you act early.
If CAC rises, you optimize marketing.
If MRR slows, you adjust pricing or retention strategy.
Instead of reacting late, you respond fast.
That’s the power of structured KPI tracking.
Click here to read the Detailed blog post
Watch the step-by-step video tutorial:


