Rural development programs carry enormous responsibility. Roads must be built. Water must reach villages. Farmers need support. Schools must improve enrollment. Healthcare access must expand.
But here’s the challenge…
When data lives in scattered spreadsheets, leaders lose clarity. Targets get missed. Yearly comparisons become difficult. Reports consume time instead of delivering insights.
What if you could track everything in one structured, interactive system?
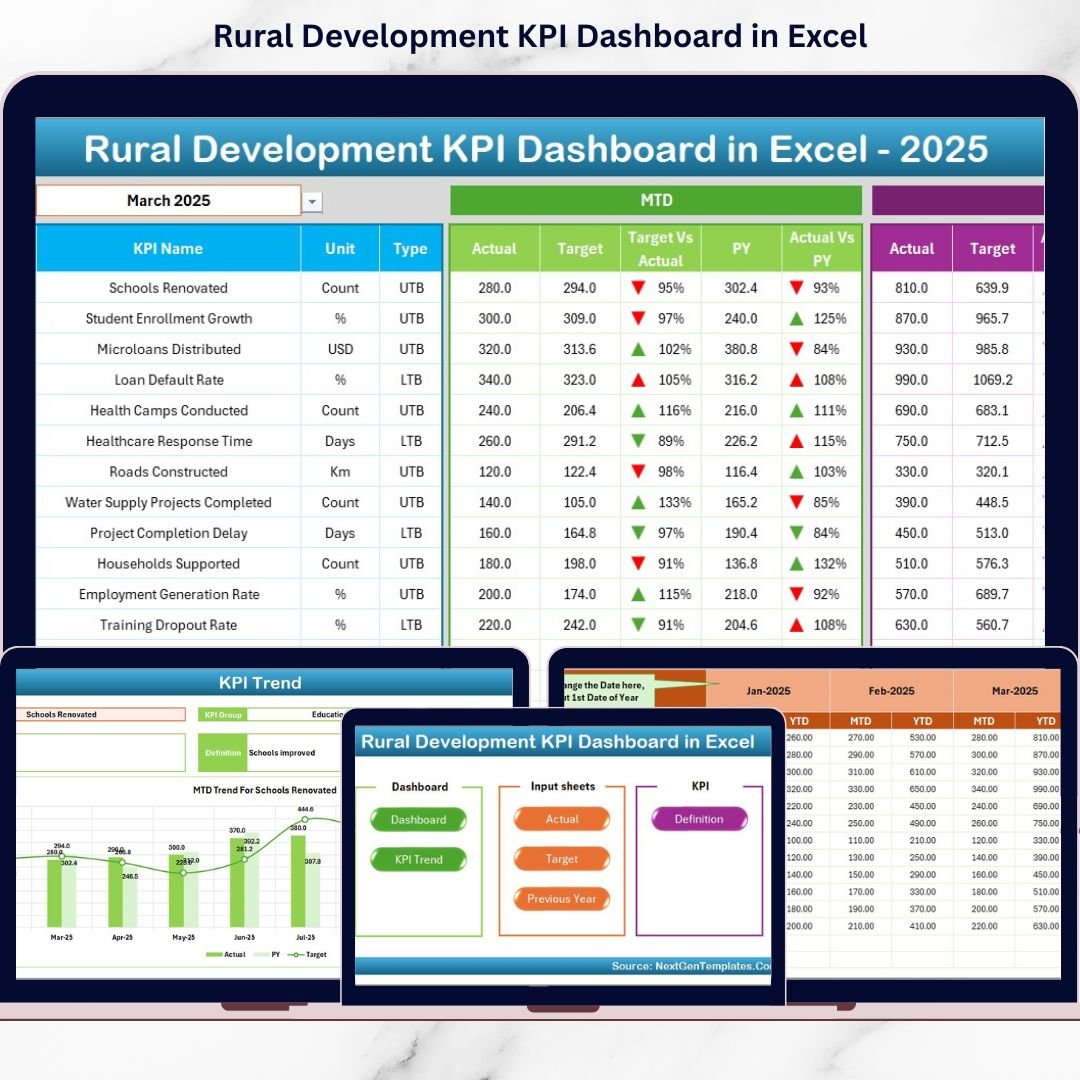
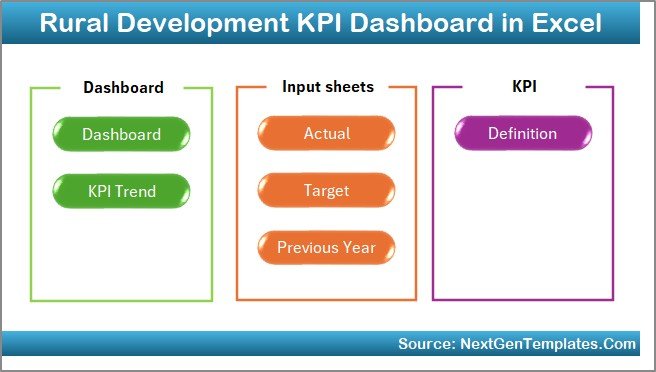
That’s exactly what the Rural Development KPI Dashboard in Excel delivers. 📊🌾
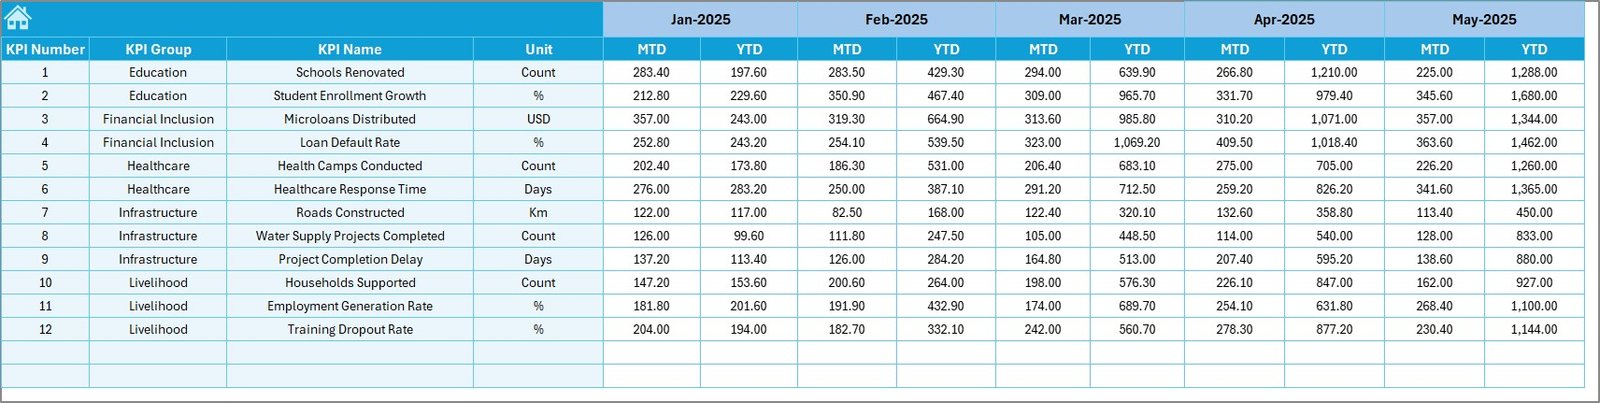
This ready-to-use Excel dashboard centralizes all rural KPIs into one powerful file. Instantly compare MTD (Month-to-Date), YTD (Year-to-Date), Target, and Previous Year performance. Select a month. See the results. Make decisions faster.
No complex software. No manual reporting chaos. Just clarity and control.
🚀 Key Feature of Rural Development KPI Dashboard in Excel
📊 7 Structured Worksheets – Organized system for complete KPI tracking.
📅 Dynamic Month Selection (Cell D3) – Instantly switch months and auto-update results.
🎯 Target vs Actual Comparison – Visual up/down arrows highlight performance gaps.
📈 MTD & YTD Analysis – Track both short-term and long-term progress.
🔄 Previous Year Comparison – Measure improvement year over year.
📉 KPI Trend Charts – Analyze historical patterns for better planning.
📘 KPI Definition Documentation – Clear formula and KPI explanations.
🧩 Fully Customizable Structure – Add or modify KPIs anytime.
💰 Cost-Effective & Excel-Based – No additional software required.
📦 What’s Inside the Rural Development KPI Dashboard in Excel
This professional template includes 7 powerful worksheets:
1️⃣ Home Sheet – Easy Navigation Center
✔ 6 navigation buttons
✔ Quick sheet access
✔ Clean and user-friendly layout
Move between sheets effortlessly.
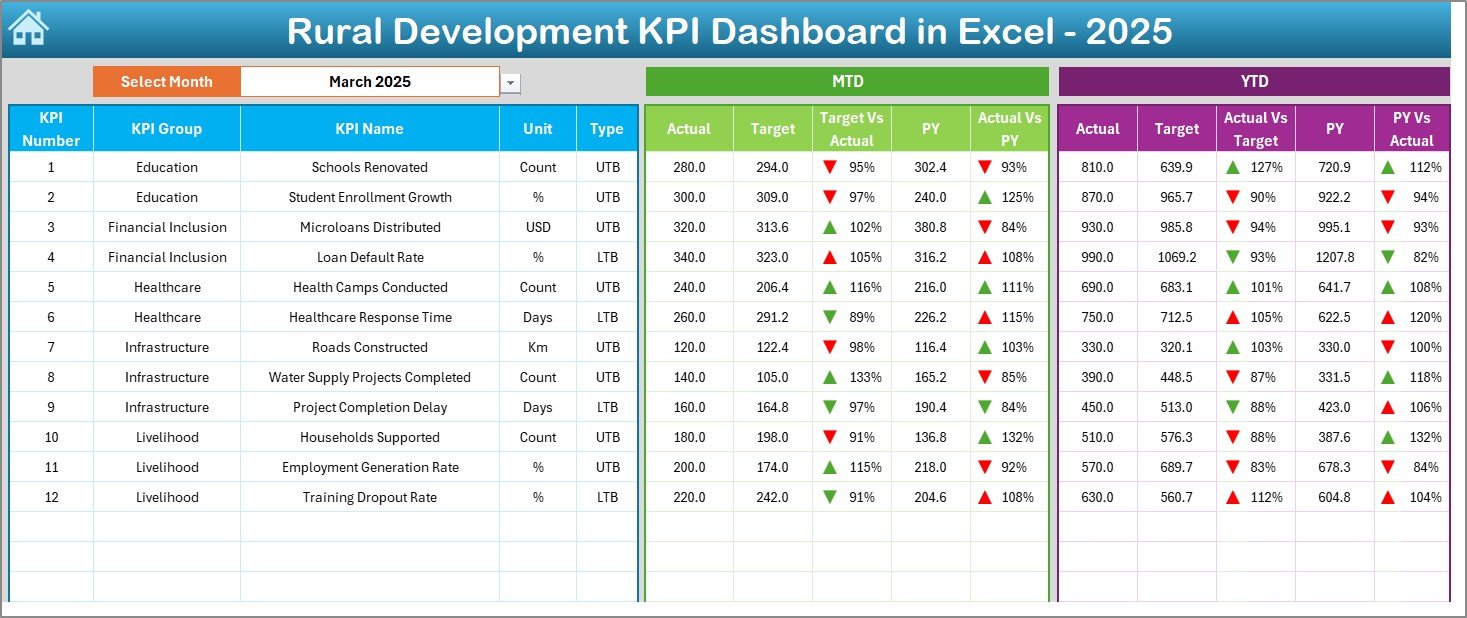
2️⃣ Dashboard Sheet – Performance Command Center
Select the month in Cell D3, and the dashboard updates automatically.
You can view:
MTD Metrics
-
MTD Actual
-
MTD Target
-
MTD Previous Year
-
Target vs Actual (with arrows)
-
PY vs Actual
YTD Metrics
-
YTD Actual
-
YTD Target
-
YTD Previous Year
-
YTD Target vs Actual
-
YTD PY vs Actual
Conditional formatting arrows instantly highlight progress or decline.
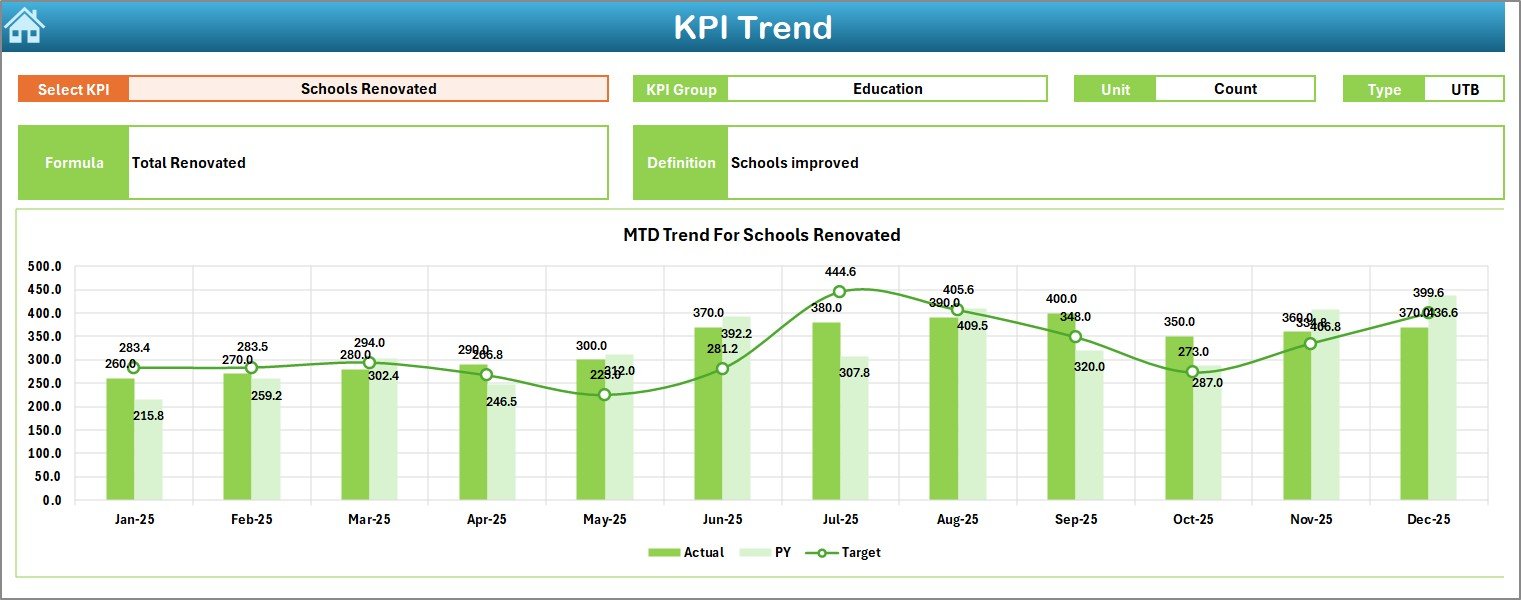
3️⃣ KPI Trend Sheet – Deep Analysis View
Select any KPI in Cell C3 and analyze:
-
KPI Group
-
Unit
-
Type (Lower the Better / Upper the Better)
-
Formula
-
Definition
Includes:
📊 MTD Trend Chart
📈 YTD Trend Chart
Perfect for identifying seasonal changes and performance gaps.
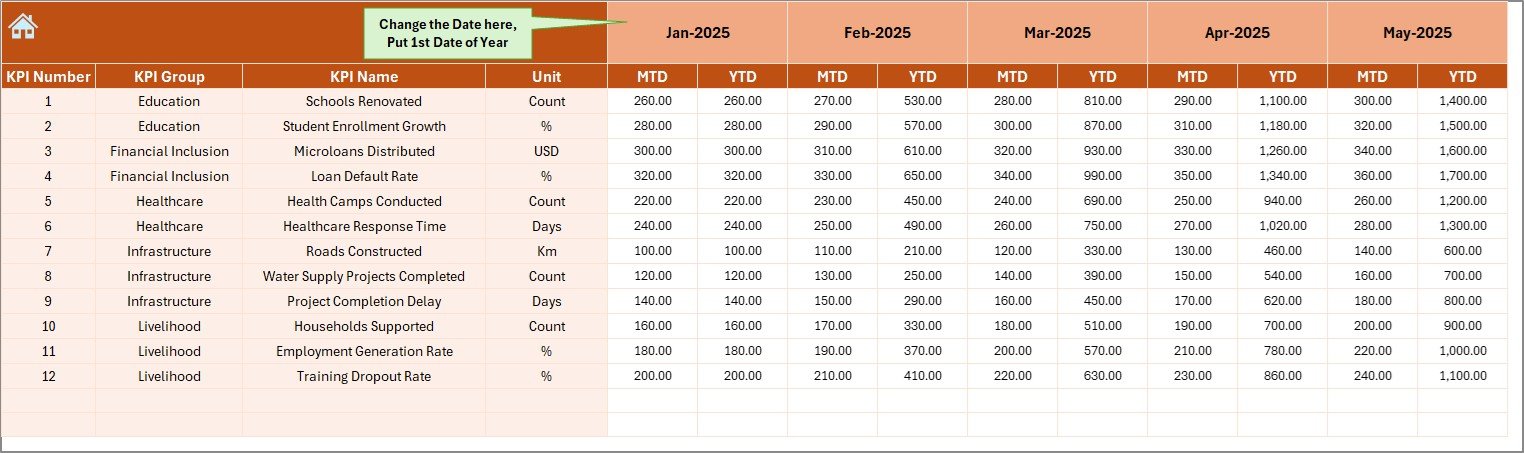
4️⃣ Actual Numbers Input Sheet
✔ Enter MTD & YTD actual values
✔ Set starting month in Cell E1
✔ Clean data entry structure
5️⃣ Target Sheet
✔ Enter monthly MTD & YTD targets
✔ Control performance expectations clearly
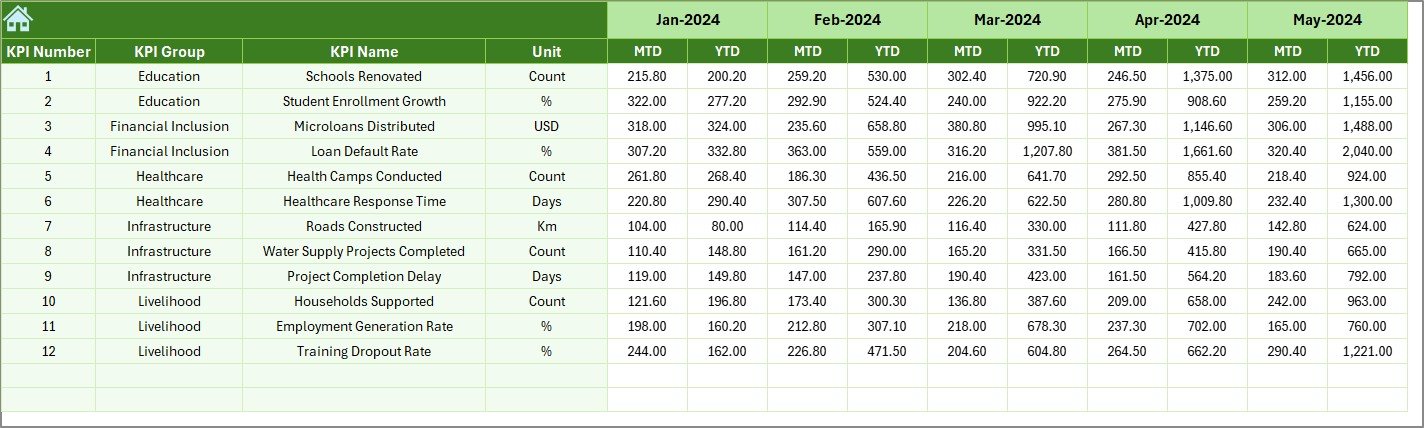
6️⃣ Previous Year Sheet
✔ Enter last year’s MTD & YTD numbers
✔ Enable direct year-over-year comparison
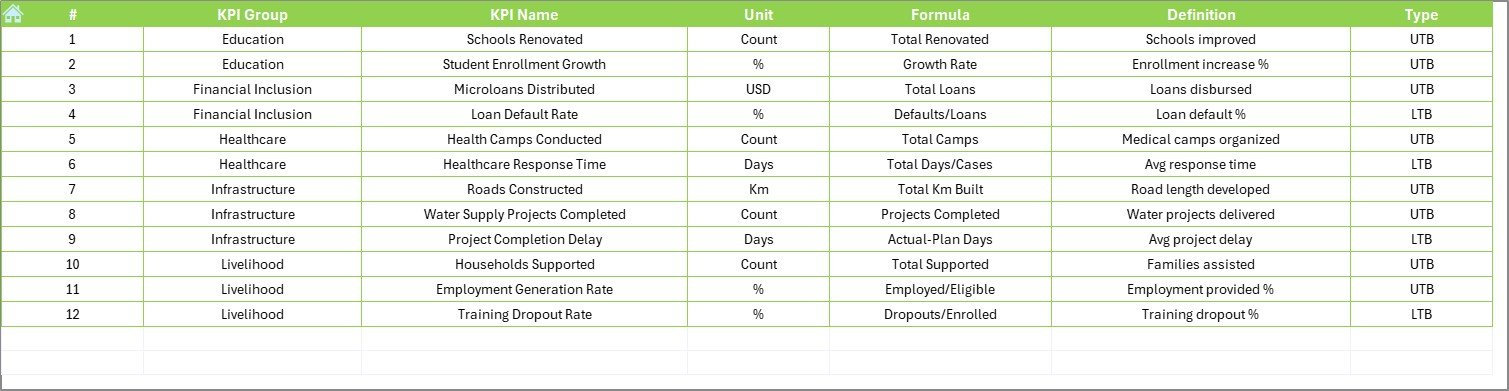
7️⃣ KPI Definition Sheet
✔ KPI Name
✔ KPI Group
✔ Unit
✔ Formula
✔ Definition
Ensures complete transparency and clarity.
🛠 How to Use the Rural Development KPI Dashboard in Excel
1️⃣ Enter KPIs in KPI Definition sheet
2️⃣ Add Actual numbers monthly
3️⃣ Enter Target values
4️⃣ Input Previous Year data
5️⃣ Go to Dashboard sheet
6️⃣ Select month from D3
7️⃣ Review performance and trends
Within minutes, generate professional rural development reports.
👥 Who Can Benefit from This Rural Development KPI Dashboard in Excel
✔ Government Rural Departments
✔ NGOs
✔ District Administration Offices
✔ Agricultural Boards
✔ Social Welfare Organizations
✔ Development Agencies
✔ Community Development Programs
If you manage rural initiatives, this dashboard becomes your central monitoring system.
📊 What KPIs Can You Track?
🌾 Agriculture – Crop productivity, irrigation coverage, farmer income
🏥 Healthcare – Vaccination rate, maternal health, camp participation
🏫 Education – Enrollment rate, literacy %, dropout rate
🏗 Infrastructure – Road completion %, electrification, water supply
💼 Employment – Skill training %, rural employment rate
You can add unlimited KPIs based on your program needs.
🎯 Why This Dashboard Improves Decision-Making
When leaders see structured, visual insights:
✔ They detect weak-performing programs
✔ They reallocate budgets wisely
✔ They compare targets clearly
✔ They track long-term growth
✔ They improve accountability
Instead of waiting for reports, they act instantly.
🔥 Advantages of Rural Development KPI Dashboard in Excel
✅ Centralized Monitoring
✅ Real-Time Month Selection
✅ Clear Target Comparison
✅ Historical Growth Analysis
✅ Easy Customization
✅ Cost-Effective Solution
✅ Improved Transparency
It transforms reporting from manual chaos into structured clarity.
Best Practices for Maximum Impact
✔ Update data monthly
✔ Validate numbers before reporting
✔ Review trends quarterly
✔ Align KPIs with policy goals
✔ Keep backup copies
✔ Train team members properly
When used consistently, this dashboard becomes a powerful development management tool.
Click here to read the Detailed blog post
Visit our YouTube channel to learn step-by-step video tutorials
YouTube Channel


