


In the competitive world of sales and distribution, resellers are the vital link between manufacturers and customers. Managing multiple resellers, monitoring targets, and analyzing performance metrics manually can quickly become overwhelming. That’s why the Reseller KPI Dashboard in Power BI is the ultimate solution for modern businesses that rely on channel sales and distributor performance. 🚀📊
This ready-to-use Power BI dashboard empowers sales leaders, distributors, and managers to track performance across multiple KPIs — including sales growth, profit margins, and target achievement — all in one interactive, real-time platform. Designed for both simplicity and power, it connects seamlessly with Excel data sources and transforms raw data into actionable insights that drive smarter business decisions.
Whether you’re managing a large reseller network or a small set of partners, this dashboard helps you stay ahead of the curve by visualizing key trends, identifying underperforming regions, and celebrating top achievers.
🌟 Key Features of the Reseller KPI Dashboard in Power BI
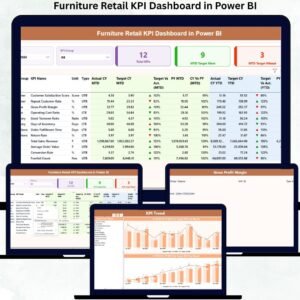
📊 1️⃣ Summary Page – The Performance Overview

The Summary Page acts as your command center — offering a clear snapshot of reseller performance at a glance.
Includes:
-
Month and KPI Group slicers for interactive filtering.
-
KPI Summary Cards:
-
Total KPIs Count
-
MTD Target Met Count
-
MTD Target Missed Count
-
-
Visual indicators (✅/❌) show whether KPIs are on track or falling behind.
💡 Purpose: Quickly identify which resellers or KPIs are performing well and where improvement is needed.
📈 2️⃣ KPI Trend Page – Deep-Dive Analytics
The KPI Trend Page allows you to explore performance over time using interactive combo charts.
Key Highlights:
-
Compare Actuals vs Targets for both MTD (Month-to-Date) and YTD (Year-to-Date).
-
Select any KPI from the slicer to analyze year-over-year trends.
-
Visualize Current Year vs Previous Year data side by side.
📅 Benefit: Understand long-term growth patterns, seasonal variations, and progress toward annual goals.
📘 3️⃣ KPI Definition Page – Transparency & Clarity
This drill-through page serves as a reference library for all KPIs.
From the main dashboard, users can right-click on any KPI and explore:
-
KPI Formula
-
Definition and Description
-
KPI Type (UTB – Upper the Better / LTB – Lower the Better)
-
Unit of Measurement
🔍 Purpose: Ensure full understanding of how each KPI is calculated, boosting accountability and consistency across teams.
🧮 Excel-Based Data Source – Simple Yet Powerful
The Reseller KPI Dashboard pulls live data from a structured Excel workbook that includes:
🧾 1. Input_Actual Sheet:
Stores all real-time KPI data (MTD and YTD values).
🎯 2. Input_Target Sheet:
Defines the monthly and yearly KPI targets for accurate variance tracking.
🧠 3. KPI Definition Sheet:
Documents every KPI’s formula, definition, and type for seamless transparency and automation.
📊 Once updated, the dashboard automatically refreshes visuals — no coding required.
⚙️ Why Reseller KPI Tracking Matters
Resellers are the backbone of your sales strategy. Without accurate performance tracking, you risk missed targets, inefficiencies, and revenue loss. This Power BI dashboard helps you:
-
Monitor reseller contributions to revenue growth.
-
Compare targets vs actuals in real time.
-
Spot trends in product performance and regional sales.
-
Make informed business decisions based on real data.
By centralizing performance analytics, it transforms reporting into a visual, interactive experience that’s easy for everyone — from executives to field managers.
💡 Advantages of the Reseller KPI Dashboard in Power BI
✅ 1. Real-Time Insights: Always know how your resellers are performing through automatic data refreshes.
✅ 2. All KPIs in One Place: Consolidates sales, operations, and finance metrics.
✅ 3. MTD vs YTD Comparison: Analyze short-term progress and long-term trends.
✅ 4. Visual Alerts: Green and red icons highlight target achievement status instantly.
✅ 5. Drill-Through Clarity: Get details on KPI logic and formulas for transparency.
✅ 6. Excel Integration: Update data easily — no tech expertise required.
✅ 7. Time-Saving Automation: Eliminate repetitive manual reports.
✅ 8. Smarter Decisions: Quickly identify high performers and improvement opportunities.
🧭 How to Use the Dashboard
1️⃣ Update your Excel data (Actuals, Targets, Definitions).
2️⃣ Open the Power BI dashboard and click Refresh.
3️⃣ Use slicers to filter by month, KPI group, or region.
4️⃣ View Summary metrics and detailed KPI trends.
5️⃣ Drill through to the KPI Definition page for insights.
⚡ Result: Within minutes, you’ll have a comprehensive, real-time reseller performance report — no technical setup required.
🏆 Who Can Benefit from This Dashboard
-
Sales Managers: Track reseller performance vs targets.
-
Distributors: Gain visibility across channels and territories.
-
Finance Teams: Analyze profit margins and ROI.
-
Executives: Monitor performance summaries in one place.
-
Consultants & Analysts: Provide visual insights for clients.
No matter your industry — retail, tech, manufacturing, or wholesale — this dashboard provides the clarity needed for sustainable growth.


Reviews
There are no reviews yet.