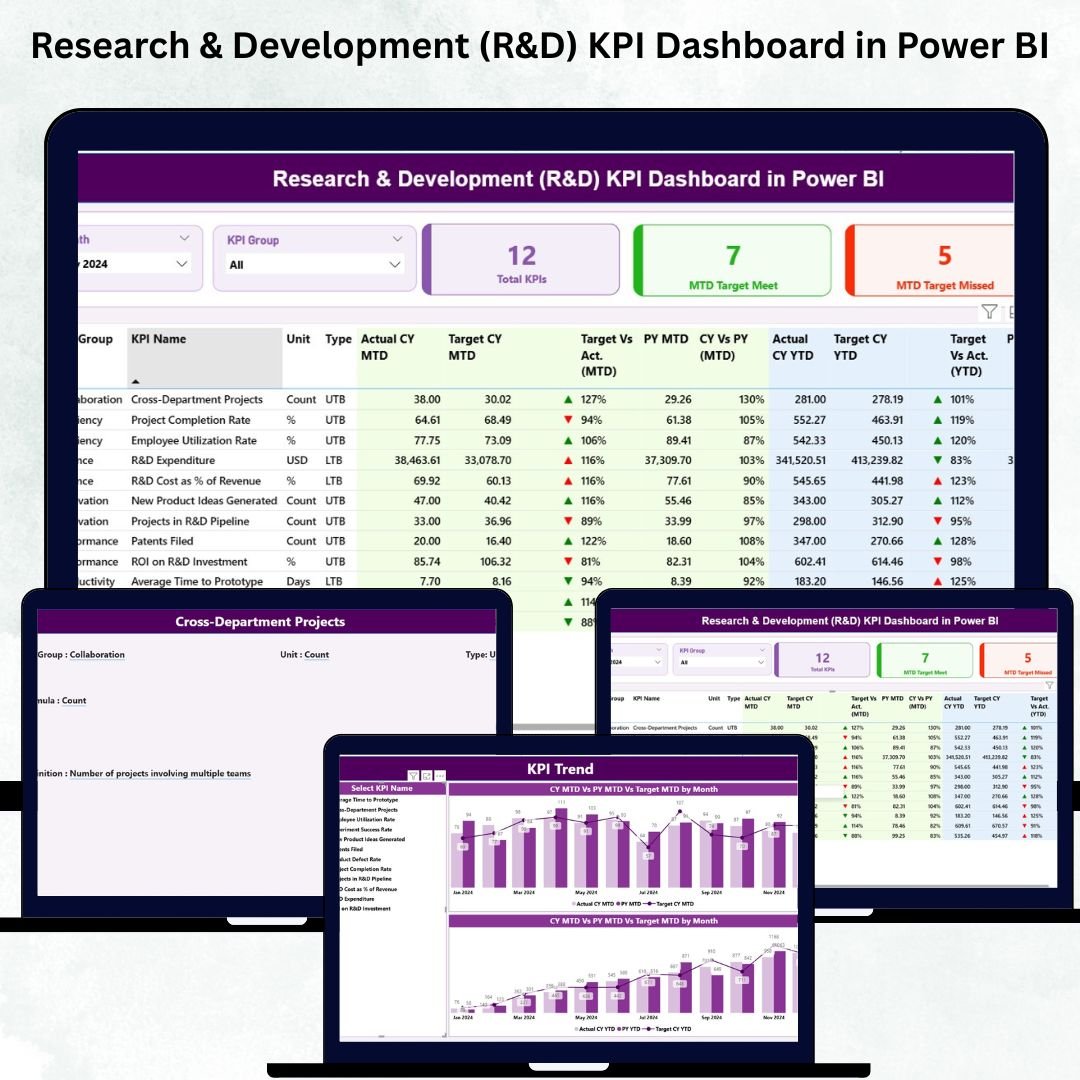
Managing Research & Development (R&D) performance becomes easier, faster, and more accurate when all KPIs sit in one interactive dashboard. The Research & Development (R&D) KPI Dashboard in Power BI is a ready-to-use, professional-grade tool that helps R&D leaders, project managers, innovation teams, and engineering departments track their most important KPIs effortlessly. Whether you handle prototypes, experiments, testing cycles, or product development, this dashboard brings total visibility to every part of the R&D workflow.
This powerful dashboard refreshes directly from an Excel file and instantly shows MTD, YTD, Target, and Previous Year comparisons. With its smart visuals, drill-through features, slicers, and performance indicators, decision-making becomes clearer and faster than ever. If you want to eliminate manual reporting, reduce delays, and manage research more confidently, this dashboard is built for you.
✨ Key Features of the Research & Development (R&D) KPI Dashboard in Power BI
🔍 Real-Time KPI Monitoring
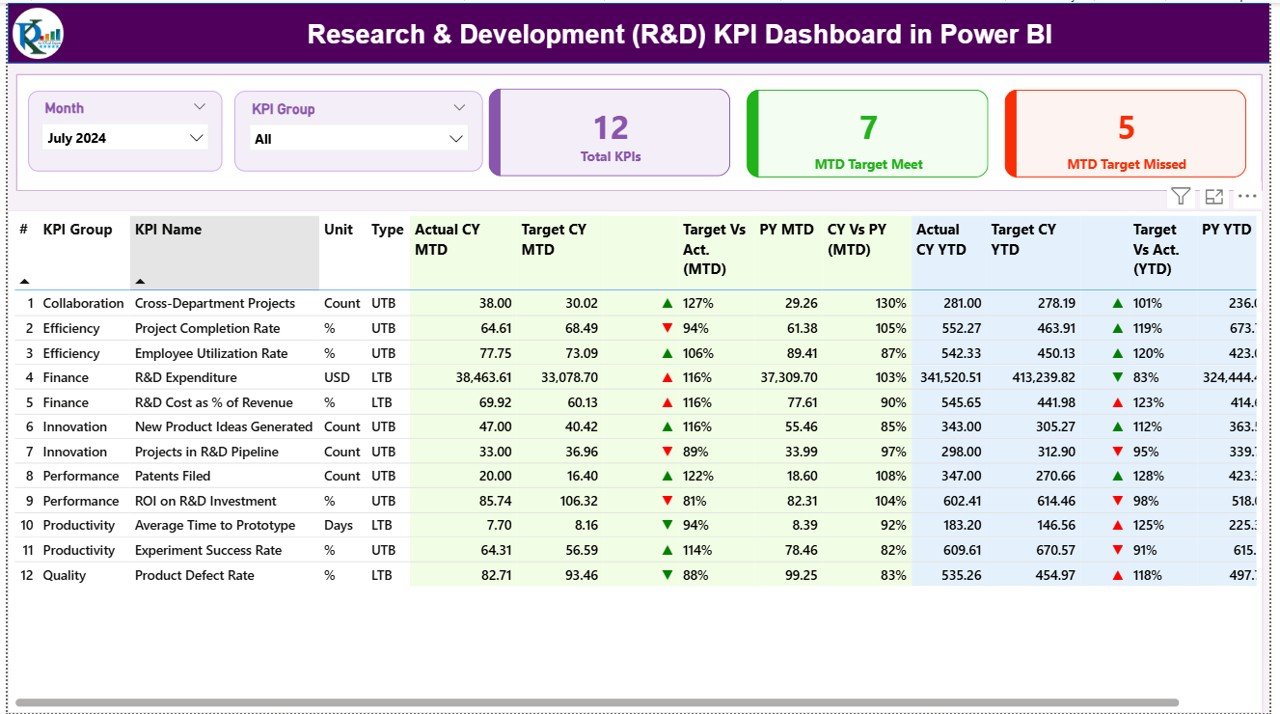
The dashboard shows MTD and YTD performance with instant updates, so you can see the exact status of research KPIs anytime.
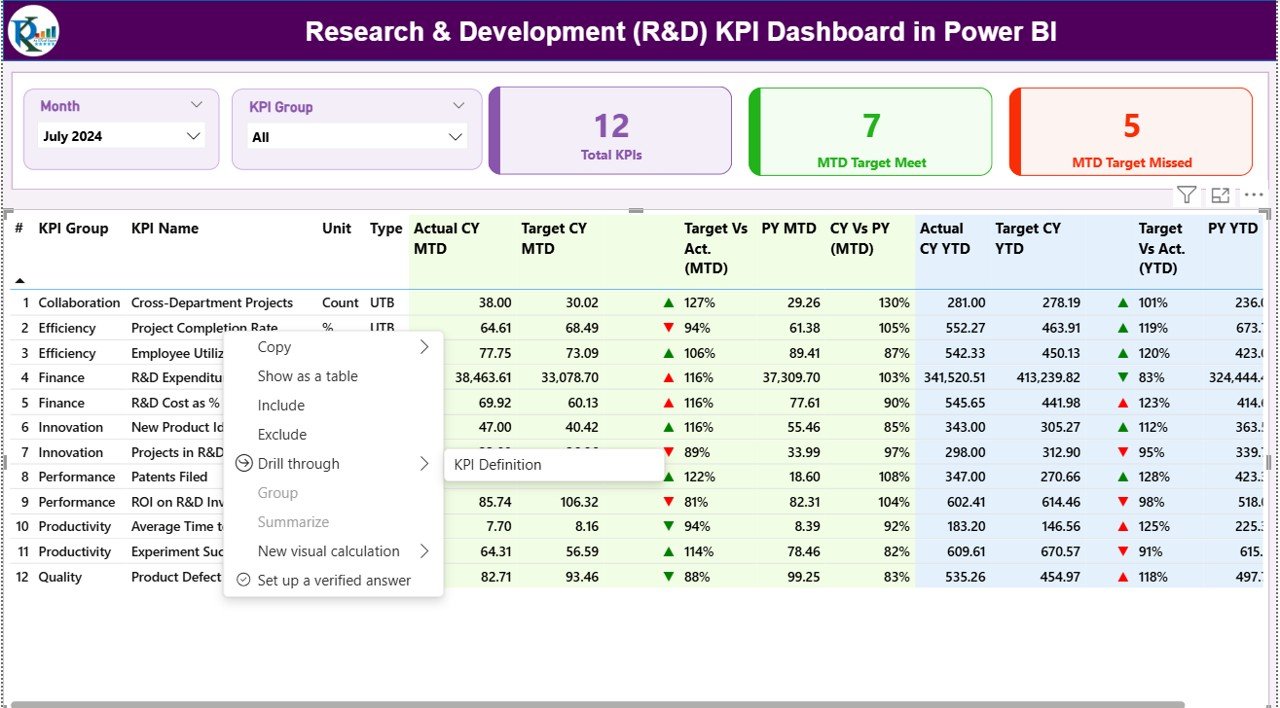
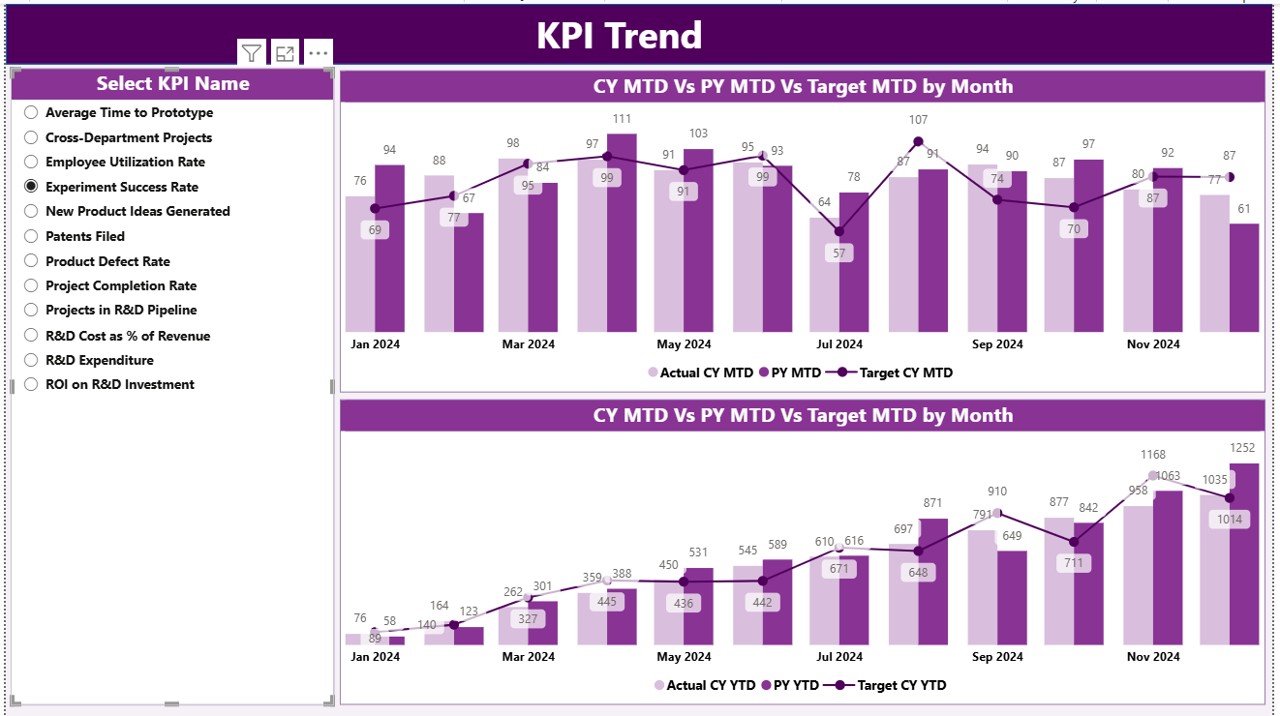
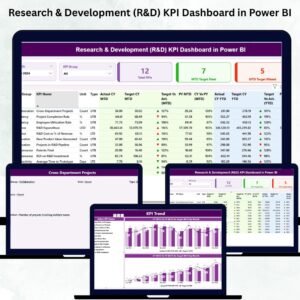
📊 Three Powerful Pages
You get three professionally designed pages:
-
Summary Page – High-level KPI view
-
KPI Trend Page – Month-wise performance movement
-
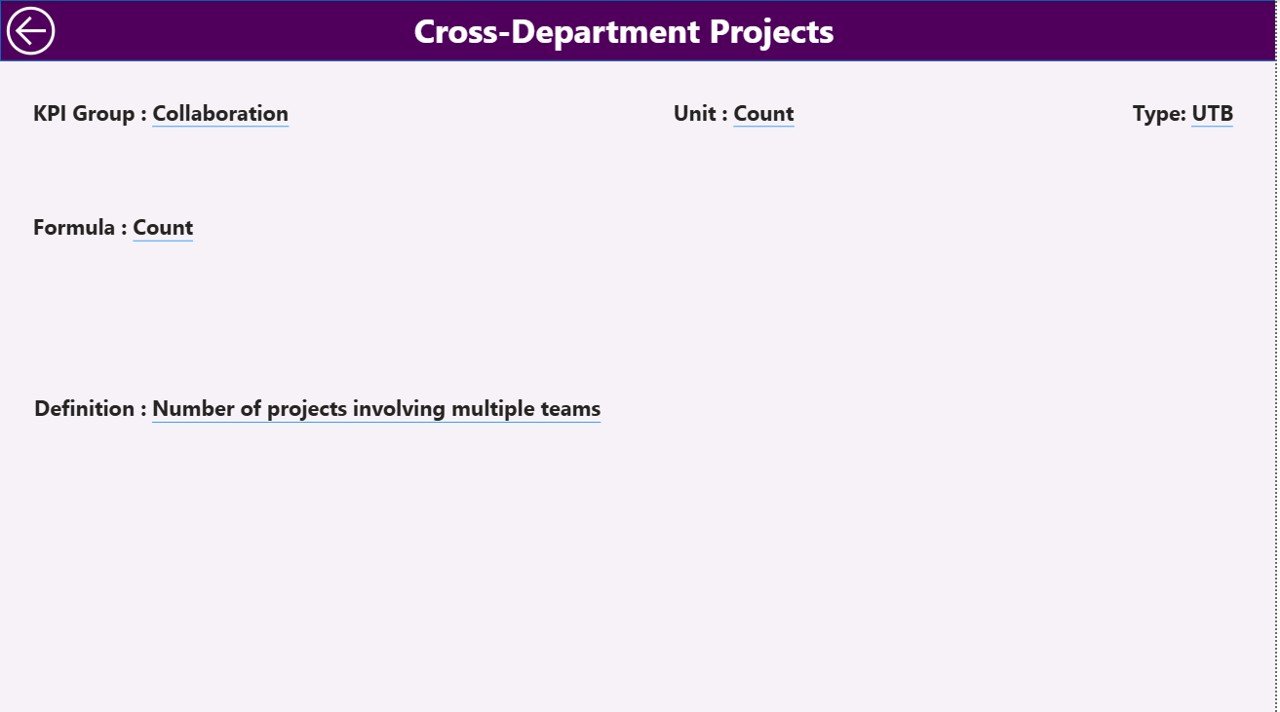
KPI Definition Page – Complete KPI logic and structure
🎯 Target vs Actual Status
Track how close your team is to meeting the monthly and yearly goals using visual indicators like green ▲ and red ▼.
🔄 Automated Updates
Refresh Power BI once, and all charts, cards, and tables update instantly from Excel.
🧪 Covers All R&D Metrics
Track prototype success, experiment cycle time, testing performance, development costs, innovation output, and more.
📦 What’s Inside the Research & Development (R&D) KPI Dashboard in Power BI
This ready-to-use product includes everything you need to manage R&D KPIs smoothly:
📁 Power BI Desktop File (.PBIX)
A fully designed dashboard with:
-
Interactive summary view
-
Performance trends
-
Detailed KPI breakdowns
-
Drill-through functionality
📘 Excel Data File
Contains three structured sheets:
-
Input_Actual – MTD & YTD actuals
-
Input_Target – MTD & YTD targets
-
KPI Definition – KPI Number, Group, Name, Formula, Unit, Type
📄 KPI Definition Framework
Clear and simple structure to define KPI formulas, logic, and measurement style (LTB/UTB).
🛠️ Clean & Professional UI
Simple navigation, clean visual layout, and well-organized slicers.
🧭 How to Use the Research & Development (R&D) KPI Dashboard in Power BI
1️⃣ Update the Excel File
Enter monthly actual and target values.
2️⃣ Refresh Power BI
Click Refresh and watch all visuals update instantly.
3️⃣ Use Filters
Choose Month and KPI Group to view focused performance.
4️⃣ Drill Through Any KPI
View the KPI Definition page for detailed formula and logic.
5️⃣ Monitor MTD & YTD Gaps
Use icons (▲▼) to track whether KPIs are achieving targets.
6️⃣ Study Monthly Trends
Use combo charts to understand improvement, decline, or seasonal variations.
With these simple steps, even non-technical users can manage the dashboard easily.
👥 Who Can Benefit from This Research & Development (R&D) KPI Dashboard in Power BI
This dashboard is perfect for:
👨🔬 R&D Teams
Track innovation, prototypes, experiments, and testing efficiency.
🧑💼 Project Managers
Monitor milestones, delays, and cycle times.
🏭 Product Development Teams
View real-time insights across projects and product lines.
🧪 Testing & Quality Teams
Measure testing success rate, improvement ratio, and failure trends.
🧠 Innovation & Engineering Units
Track idea pipeline, cost, and development performance.
🧑💻 Leadership & Decision Makers
Understand trends, gaps, and achievements instantly.
This dashboard brings complete transparency and supports faster, smarter decisions throughout the R&D function.
Click here to read the Detailed blog post
Watch the step-by-step video tutorial:


Reviews
There are no reviews yet.