Recycling infrastructure plays a critical role in creating a sustainable and environmentally responsible future. Cities, municipalities, and waste management organizations constantly work to improve recycling efficiency, reduce landfill waste, and optimize resource recovery. However, managing recycling operations becomes extremely challenging without proper performance monitoring.
This is where the Recycling Infrastructure KPI Dashboard in Excel becomes an essential tool.
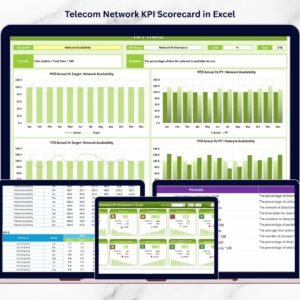
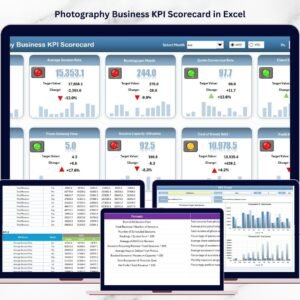
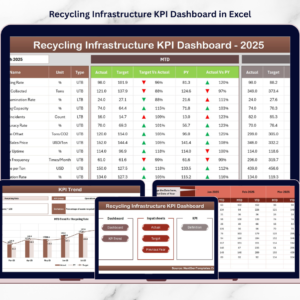
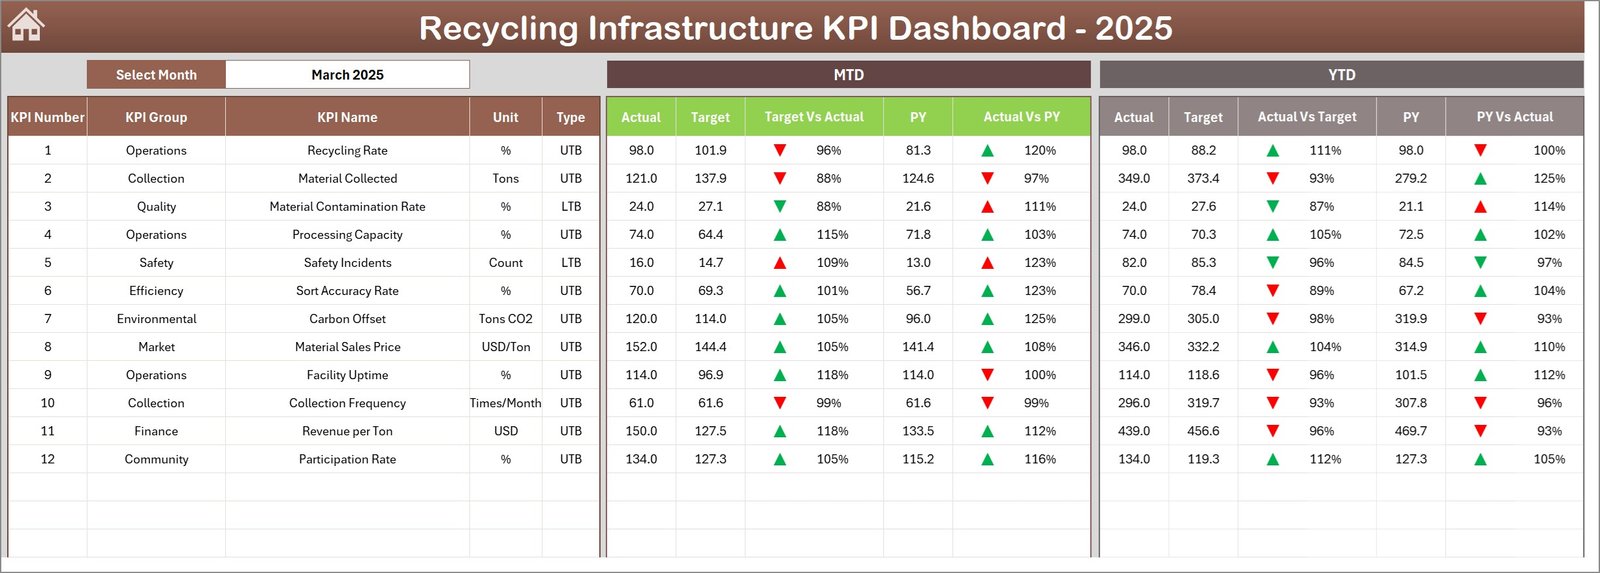
The Recycling Infrastructure KPI Dashboard in Excel is a ready-to-use analytical template designed to monitor recycling performance indicators and operational metrics. It transforms raw recycling data into meaningful visual insights that help managers evaluate operational efficiency, track sustainability goals, and compare performance with targets.
Instead of reviewing scattered spreadsheets and reports, decision-makers can analyze all recycling KPIs in one centralized dashboard. With interactive charts, KPI comparisons, and automated calculations, organizations can quickly identify performance gaps and implement operational improvements.
Because the dashboard uses Excel’s powerful capabilities such as slicers, drop-down filters, conditional formatting, and dynamic charts, recycling managers can monitor both short-term and long-term performance trends effectively.
Whether you are managing a municipal recycling facility, waste management company, or environmental sustainability program, this dashboard provides the analytical insights required to optimize recycling operations.
♻️ Key Feature of Recycling Infrastructure KPI Dashboard in Excel
This dashboard includes several powerful features designed to simplify recycling performance monitoring.
📊 Centralized Recycling KPI Monitoring – Track recycling performance indicators in one interactive dashboard.
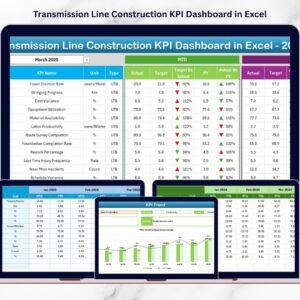
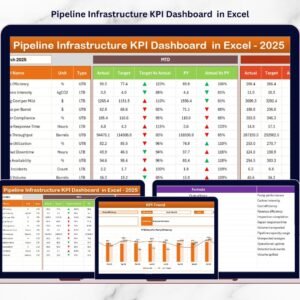
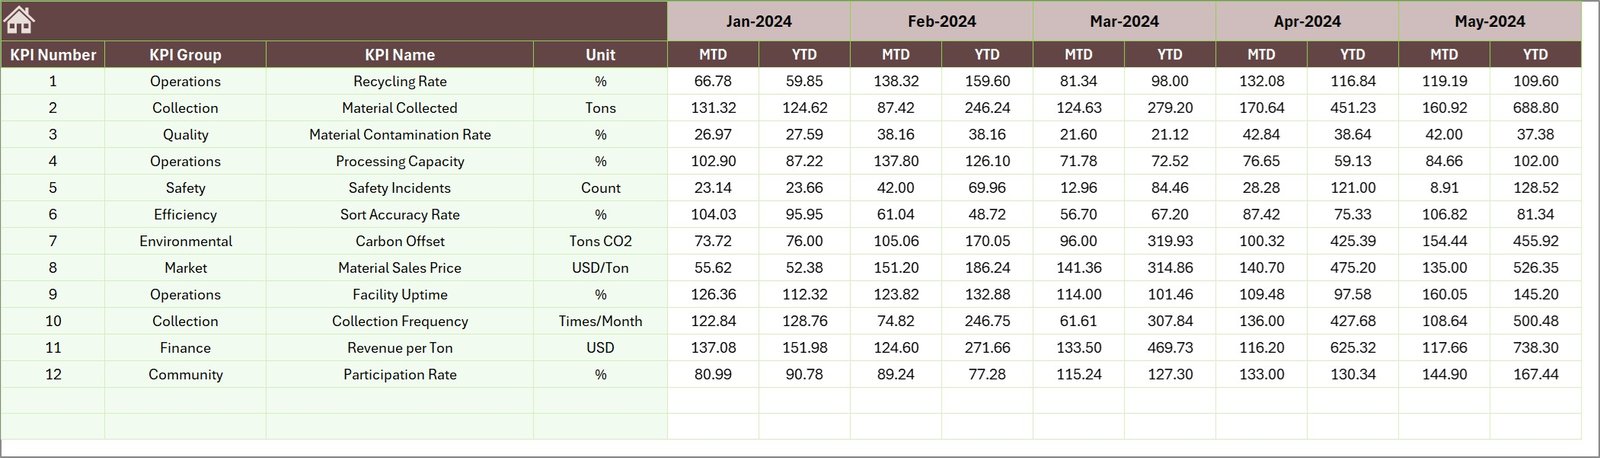
📈 MTD & YTD Performance Tracking – Compare Month-to-Date and Year-to-Date performance against targets.
📉 Actual vs Target vs Previous Year Comparison – Evaluate operational progress with historical benchmarking.
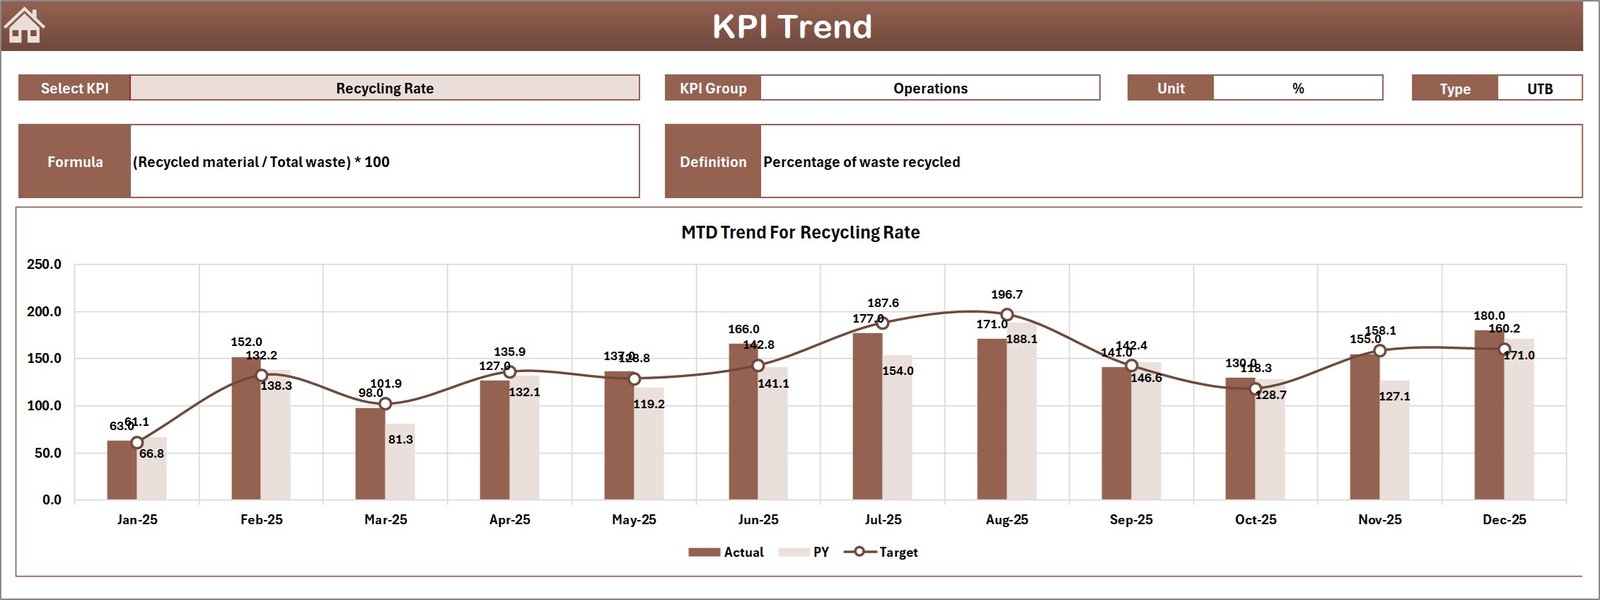
🔎 Interactive KPI Trend Analysis – Analyze how individual recycling KPIs perform over time.
📅 Monthly Performance Selection – Select any month to instantly update the dashboard.
📊 Conditional Formatting Indicators – Green and red arrows highlight performance improvement or decline.
📁 Structured Data Input System – Dedicated sheets allow easy entry of operational data.
📊 Dynamic Charts and Visual Analytics – Instantly visualize recycling performance trends.
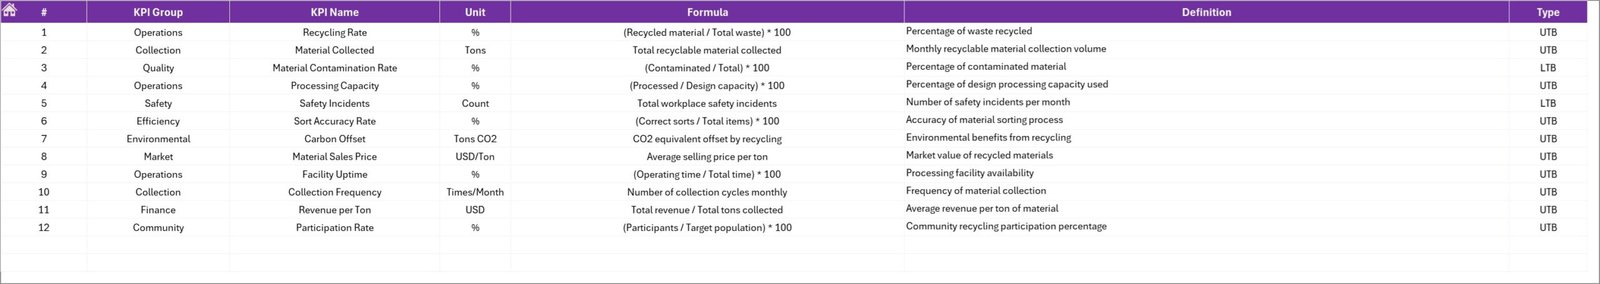
📚 KPI Definition Library – Maintain clear documentation for KPI formulas and definitions.
⚙️ User-Friendly Excel Interface – Easy to use even for non-technical professionals.
Because of these features, recycling organizations can monitor operational efficiency and sustainability metrics effectively.
📦 What’s Inside the Recycling Infrastructure KPI Dashboard in Excel
This template includes seven structured worksheets designed to organize recycling performance monitoring.
Inside the dashboard you will find:
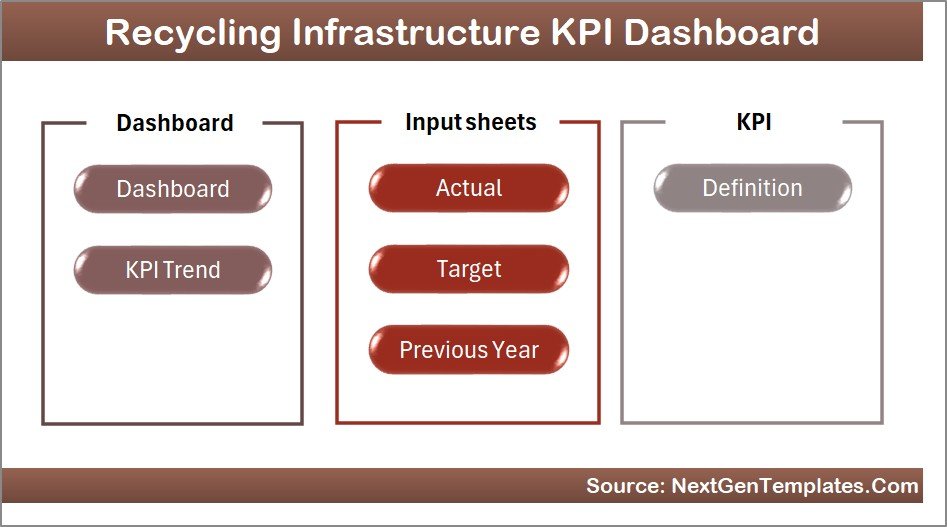
✅ Home Sheet – Navigation panel with quick access buttons
✅ Dashboard Sheet – Central KPI monitoring interface
✅ KPI Trend Sheet – Trend analysis for individual KPIs
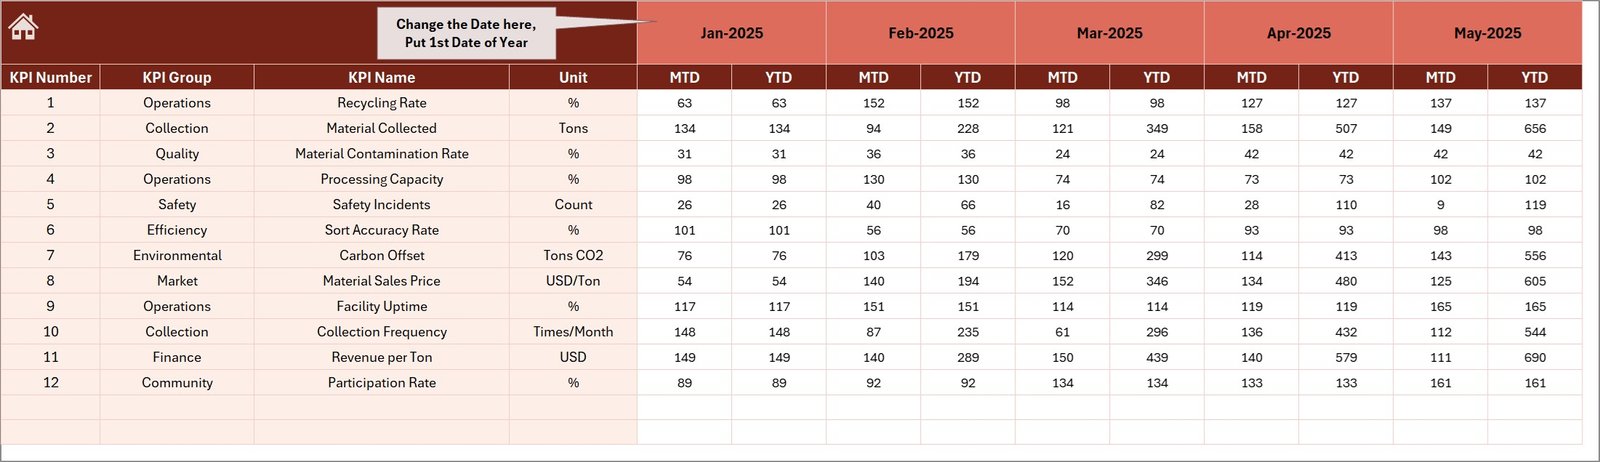
✅ Actual Numbers Input Sheet – Enter operational data
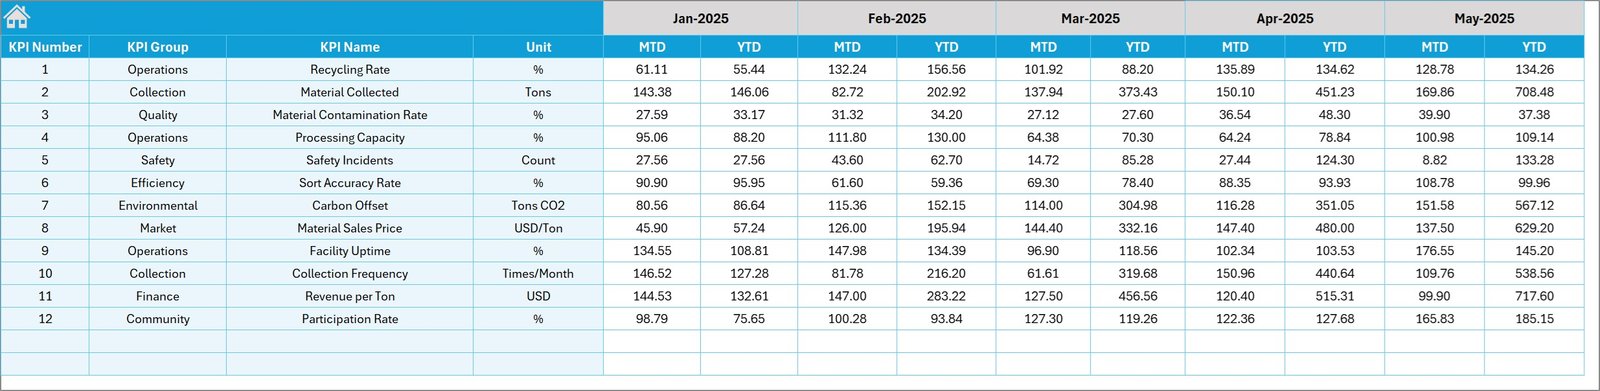
✅ Target Sheet – Define performance targets for KPIs
✅ Previous Year Numbers Sheet – Historical performance data
✅ KPI Definition Sheet – Documentation for KPI formulas and descriptions
The dashboard tracks important recycling KPIs such as:
Recycling Processing Volume
Waste Diversion Rate
Operational Efficiency
Facility Utilization Rate
Cost per Ton Processed
Recycling Revenue Trends
Processing Capacity
Environmental Performance Metrics
Because these metrics are presented visually, organizations can quickly evaluate recycling infrastructure performance.
⚙️ How to Use the Recycling Infrastructure KPI Dashboard
Using this dashboard is simple and efficient.
1️⃣ Enter operational recycling data in the Actual Numbers Input Sheet.
2️⃣ Define performance goals in the Target Sheet.
3️⃣ Enter historical numbers in the Previous Year Sheet.
4️⃣ Select the month from the drop-down menu in the Dashboard Sheet.
5️⃣ Review KPI comparisons, charts, and performance indicators.
Once data is entered, the dashboard automatically updates all charts and KPI comparisons.
This allows recycling managers to monitor performance quickly and identify areas requiring improvement.
👥 Who Can Benefit from This Recycling KPI Dashboard
This dashboard is designed for professionals involved in recycling and waste management operations.
It is especially useful for:
♻️ Waste Management Companies
🏙 Municipal Recycling Departments
🌍 Environmental Agencies
🏭 Recycling Facility Operators
📊 Sustainability Consultants
📈 Environmental Analysts
Because the dashboard combines operational, financial, and sustainability metrics, multiple teams can use it for performance monitoring.
💡 Why Recycling Organizations Use KPI Dashboards
✔ Centralized monitoring of recycling operations
✔ Faster identification of operational inefficiencies
✔ Improved sustainability performance tracking
✔ Better cost monitoring and resource utilization
✔ Clear performance comparison with historical data
✔ Data-driven environmental decision-making
✔ Improved transparency for regulatory reporting
✔ Better strategic planning for waste management
Instead of relying on manual reports, organizations can use visual analytics to monitor recycling performance effectively.
This dashboard converts operational recycling data into actionable insights that help improve environmental impact and operational efficiency.
### Click here to read the Detailed blog post
Visit our YouTube channel to learn step-by-step video tutorials
Youtube.com/@PKAnExcelExpert