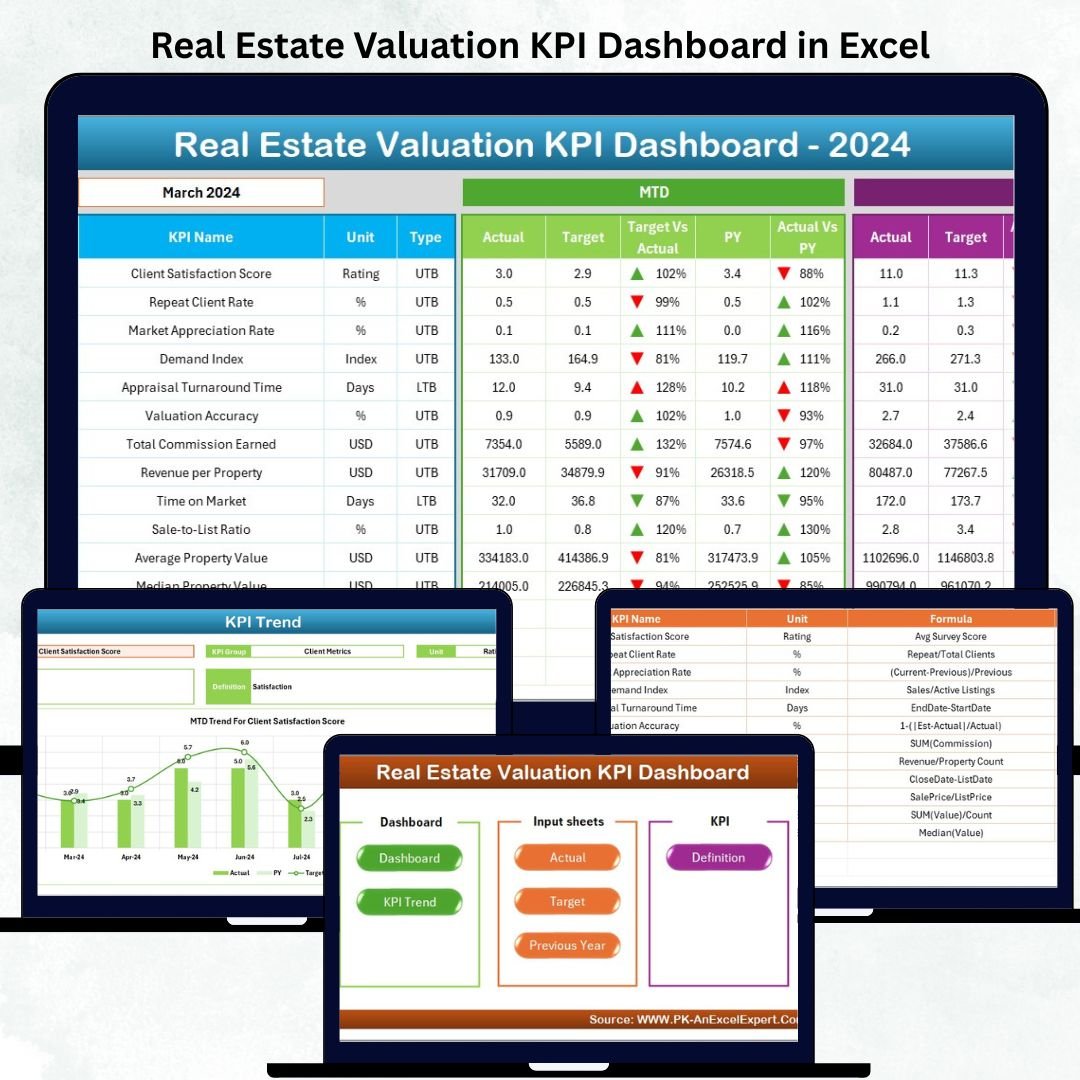
Real Estate Valuation KPI Dashboard in Excel Managing real estate valuation can get complicated—especially when you work with multiple properties, dynamic rental markets, changing operating costs, and shifting investment trends. Real Estate Valuation KPI Dashboard in Excel Manual spreadsheets slow you down, create confusion, and increase calculation errors. Real Estate Valuation KPI Dashboard in Excel That’s why real estate professionals now rely on an automated Real Estate Valuation KPI Dashboard in Excel to get accurate numbers instantly.
Real Estate Valuation KPI Dashboard in Excel This powerful dashboard simplifies valuation, boosts accuracy, and gives you a complete view of your property performance across months and years. Real Estate Valuation KPI Dashboard in Excel Whether you manage residential properties, commercial spaces, or mixed-use portfolios, Real Estate Valuation KPI Dashboard in Excel this dashboard helps you track valuation KPIs with precision and confidence. It turns complex real estate data into clear visuals, trend charts, cards, and automated insights — all without any advanced technical skills.
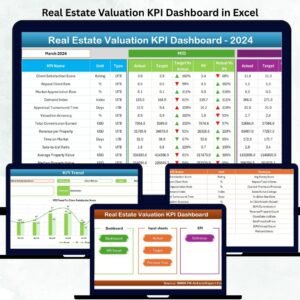
Let’s explore the complete structure and value of this professional-grade Excel dashboard 👇
✨ Key Features of the Real Estate Valuation KPI Dashboard in Excel
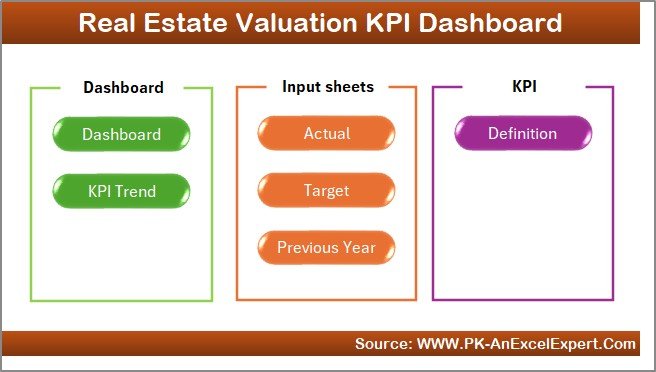
📊 1. Seven Well-Designed Worksheets
Includes Home, Dashboard, KPI Trend, Actual Numbers, Target Sheet, Previous Year Numbers, and KPI Definition.
🏠 2. Home Page with One-Click Navigation
Jump between sheets instantly using the built-in navigation buttons.
📈 3. Main Dashboard with MTD & YTD Insights
View all KPIs in one place with:
-
Actual
-
Target
-
Previous Year
-
Target vs Actual
-
PY vs Actual
And conditional arrows show instantly whether your KPI is improving or declining.
🎯 4. KPI Trend Sheet for Monthly Patterns
Select any KPI and view:
-
KPI Group
-
Unit
-
LTB/UTB type
-
Formula
-
Definition
-
MTD & YTD trend charts
This helps you understand valuation patterns and forecast future changes.
🔄 5. Fully Automated Data Refresh
Just update Actuals, Targets, and Previous Year values — the dashboard updates instantly.
🏢 6. Perfect for All Property Types
Commercial, residential, retail, industrial, mixed-use, and land portfolios.
📦 What’s Inside the Real Estate Valuation KPI Dashboard in Excel
🏠 1. Home Sheet – Quick Navigation Panel
This sheet saves time by giving you six clickable navigation buttons for instant movement across the file.
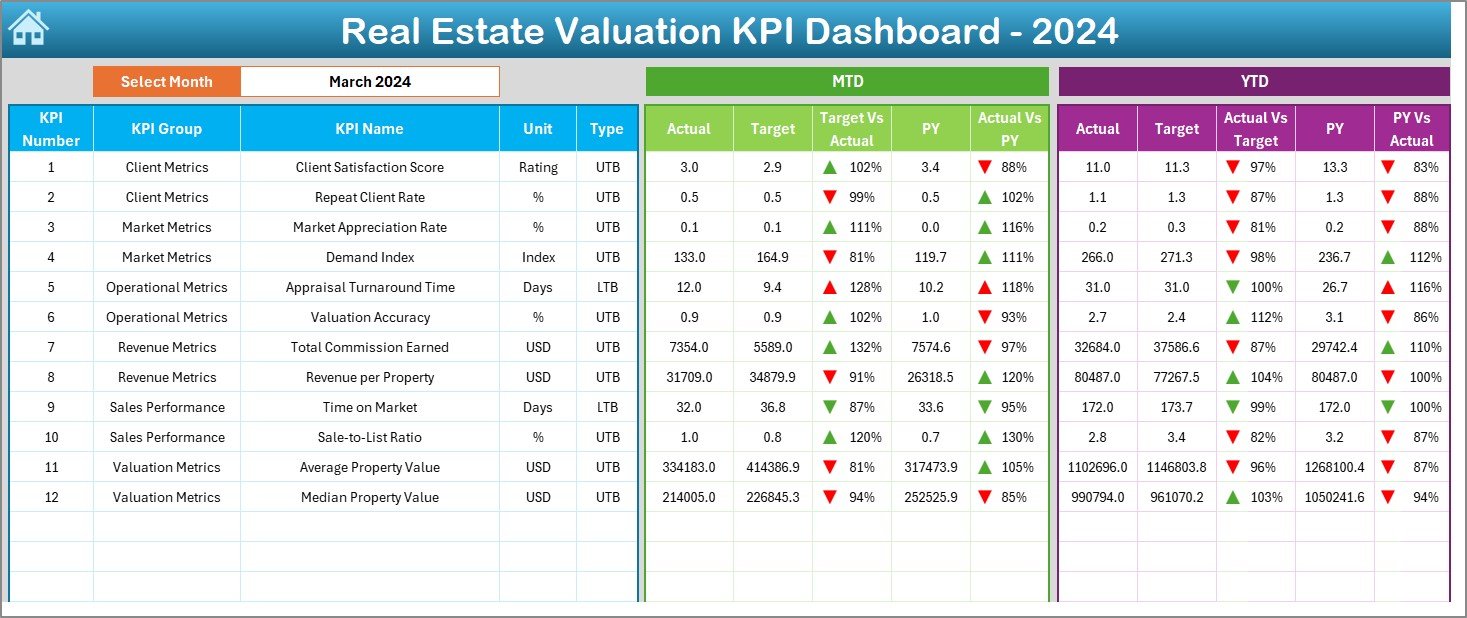
📊 2. Dashboard Sheet – Central KPI Summary Page
This page shows complete valuation insights in card-style visuals and comparison tables.
✔ Select the month in cell D3
✔ Automatically view updated MTD and YTD metrics
✔ Compare Actual vs Target vs Previous Year
You get full clarity on valuation accuracy, rental efficiency, occupancy behavior, cost ratios, and financial strength.
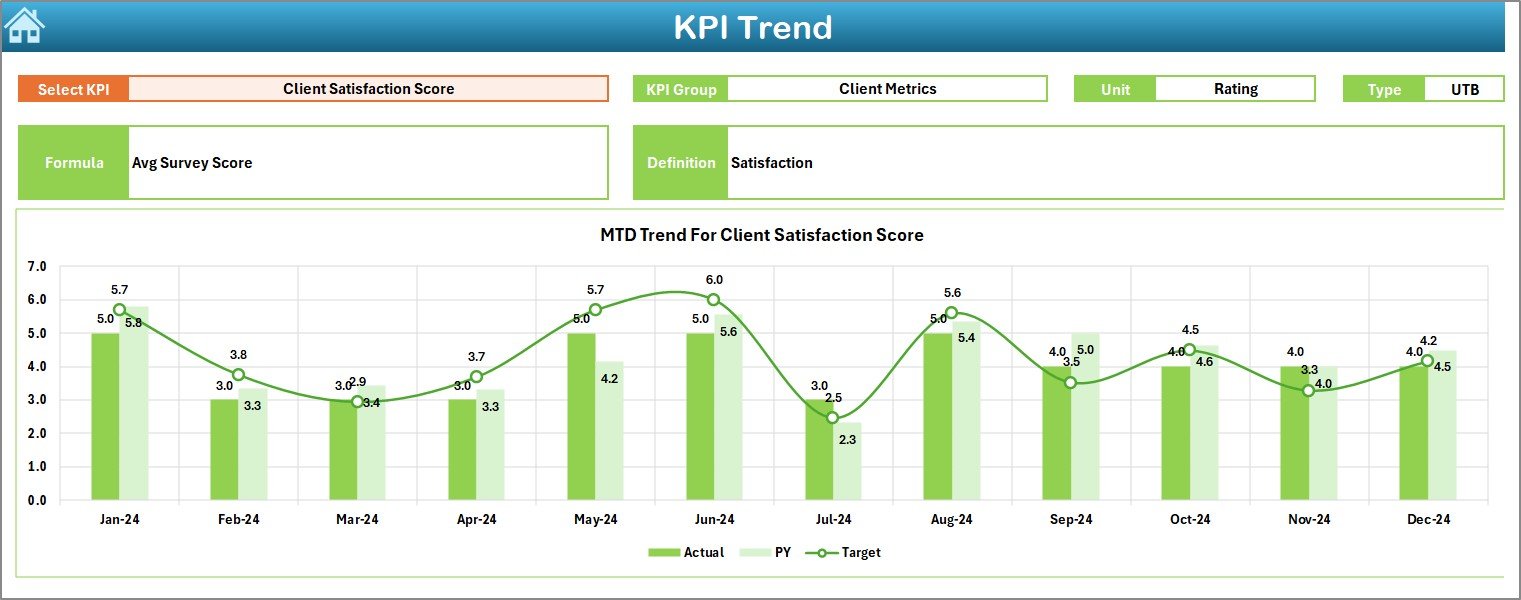
📈 3. KPI Trend Sheet – KPI-Wise Monthly Trend Analysis
Select a KPI from the dropdown (C3) and view:
-
KPI Group
-
Unit
-
LTB/UTB Type
-
Formula
-
Short Definition
-
MTD Trend Chart
-
YTD Trend Chart
This sheet is ideal for investment forecasting and understanding seasonal behaviors.
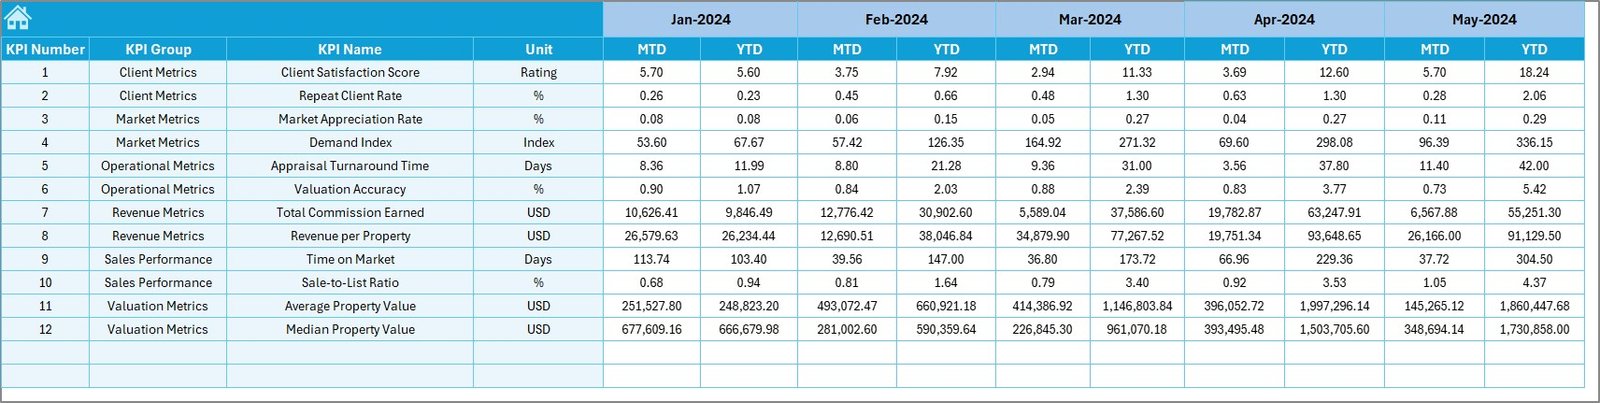
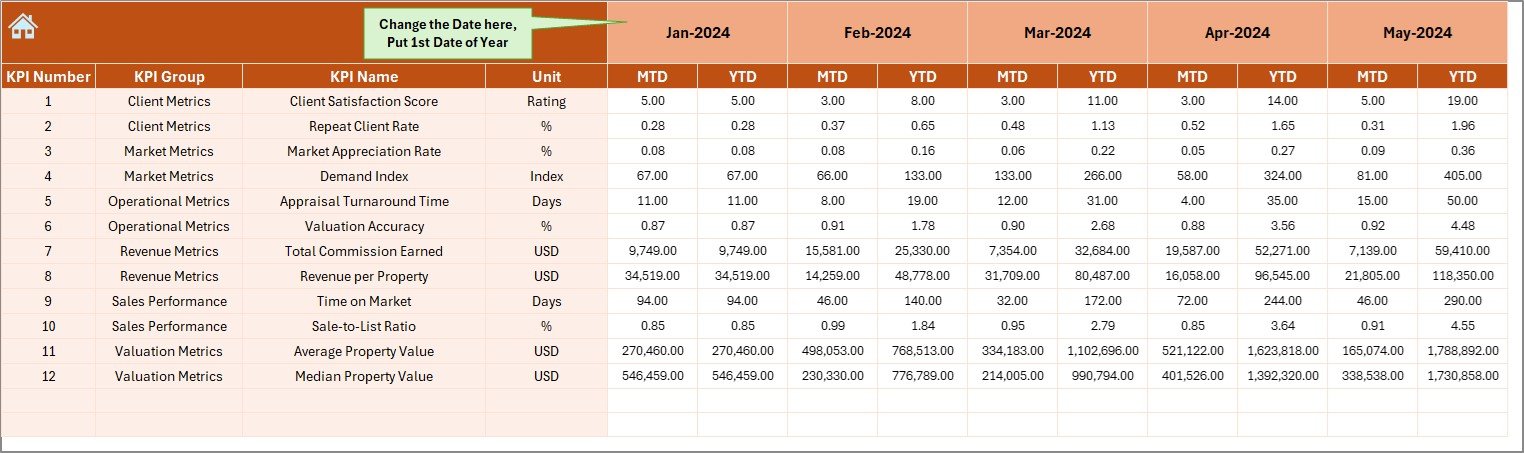
🧾 4. Actual Numbers Input Sheet – Add Real Numbers Easily
Enter actual MTD and YTD numbers for the month selected in E1.
The dashboard automatically picks values, eliminating manual errors.
🎯 5. Target Sheet – Set MTD & YTD Targets
Add monthly and yearly targets for each KPI.
Targets help you identify valuation gaps and performance improvements instantly.
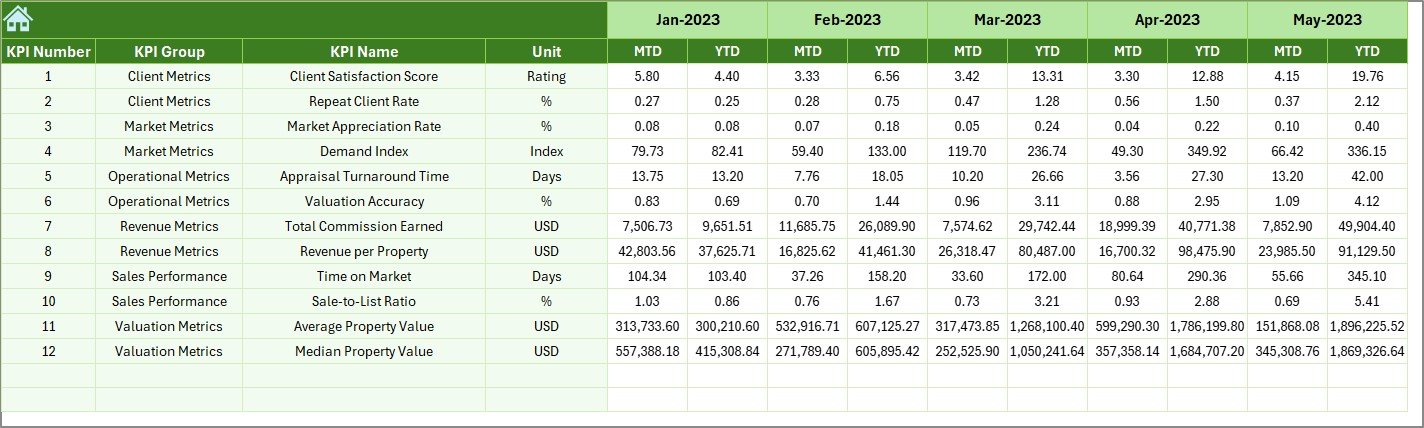
📘 6. Previous Year Numbers Sheet – Compare with Past Performance
Here you store historical MTD/YTD data.
It helps measure progress, growth trends, and performance consistency.
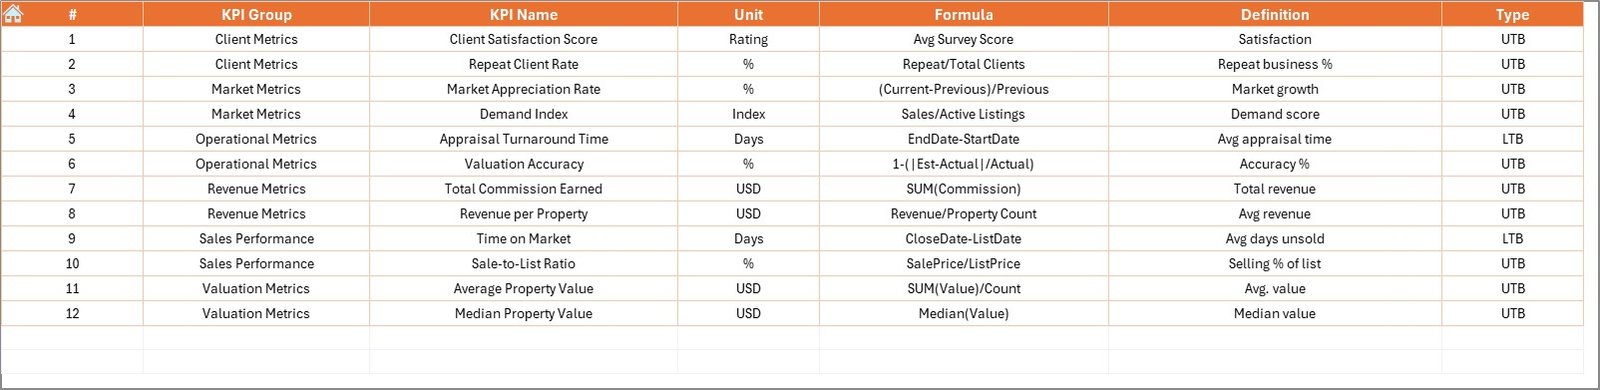
📑 7. KPI Definition Sheet – Complete KPI Dictionary
Includes:
-
KPI Name
-
KPI Group
-
Unit
-
Formula
-
Definition
-
KPI Type (LTB/UTB)
This keeps your valuation KPIs consistent across your team.
🧭 How to Use the Real Estate Valuation KPI Dashboard in Excel
🪄 Step 1: Enter the Starting Month
Go to Actual Numbers → Fill the starting month in cell E1.
✏️ Step 2: Add Actual Numbers
Enter MTD & YTD values for each KPI.
🎯 Step 3: Add Targets
Go to Target Sheet → Enter target values.
📘 Step 4: Add Previous Year Numbers
Fill PY MTD/YTD values for accurate comparison.
📊 Step 5: Open Dashboard Sheet
Select a month → View all automated KPI summaries.
📈 Step 6: Analyze Trends
Use the KPI Trend sheet to explore monthly movement and seasonality.
🏢 Who Can Benefit from This Real Estate Valuation KPI Dashboard?
🧑💼 Real Estate Investors & Owners
Monitor rental performance, valuation changes, and operating efficiency.
🏢 Property Consultants & Brokers
Share clean valuation reports with clients instantly.
📊 Asset Managers
Track portfolio performance across multiple properties.
🧮 Valuation Analysts
Use automated charts and templates for faster calculations.
🏘️ Property Management Companies
Improve occupancy, reduce expense ratios, and optimize returns.


Reviews
There are no reviews yet.