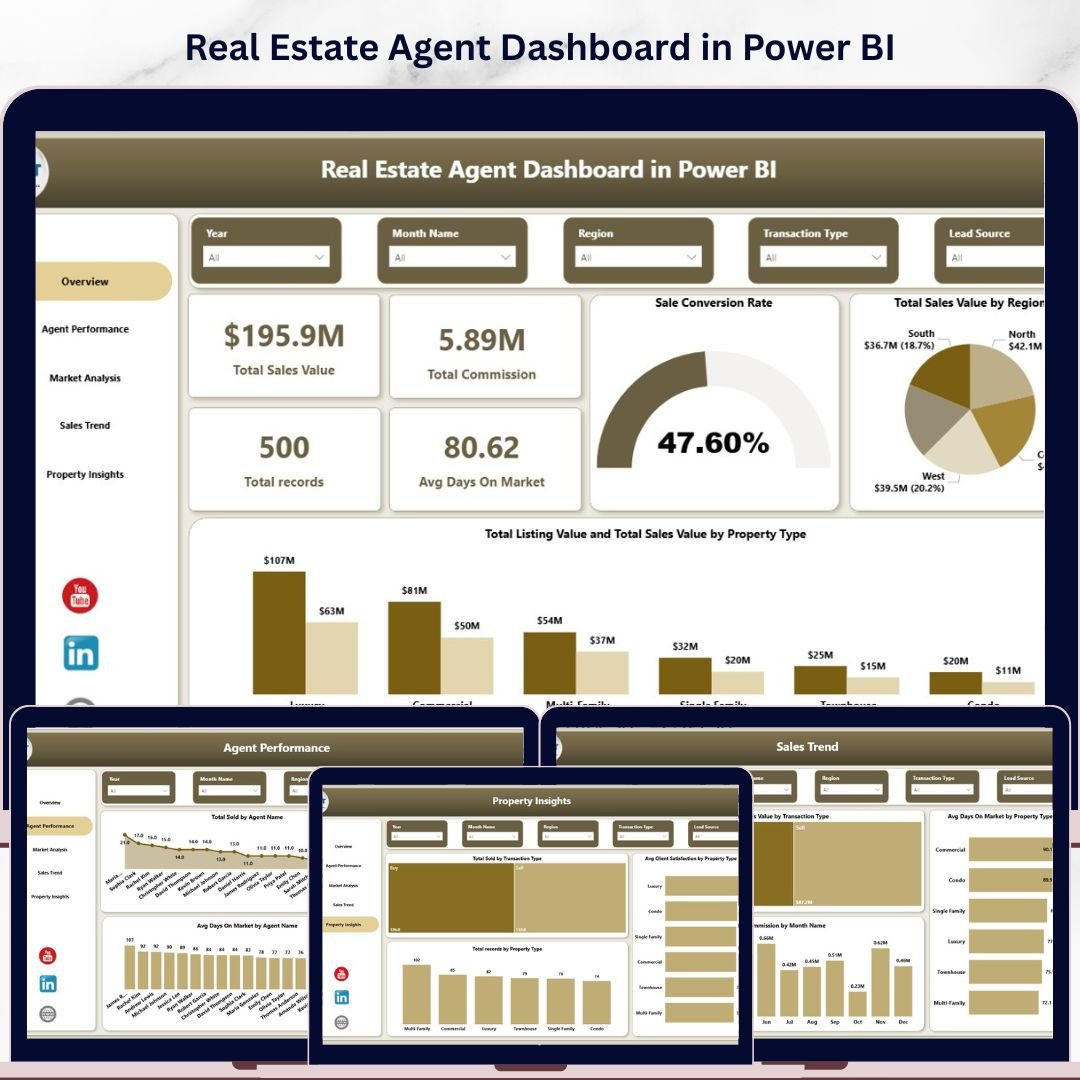
Real Estate Agent Dashboard in Power BI is a comprehensive, interactive analytics template designed for real estate agents, brokers, property managers, and sales teams who need to monitor property sales, track agent performance, analyze market trends, and evaluate client satisfaction — all from one powerful Power BI dashboard. This Power BI dashboard template includes 5 interactive pages covering Overview, Agent Performance, Market Analysis, Sales Trend, and Property Insights — delivering a 360-degree view of your real estate business operations.
This template tracks 5 key performance indicators including Total Sales Value, Total Commission, Total Records, Avg Days On Market, and Sale Conversion Rate. With dynamic slicers and multiple analysis pages, you can drill down into specific regions, property types, agent names, neighborhoods, transaction types, and time periods. Whether you manage residential, commercial, or mixed-use real estate portfolios, this dashboard delivers the analytical clarity you need to close more deals and optimize agent performance.
🔑 Key Features of Real Estate Agent Dashboard in Power BI
📊 5 Interactive Dashboard Pages – Overview, Agent Performance, Market Analysis, Sales Trend, and Property Insights pages deliver complete visibility into your real estate operations across every dimension.
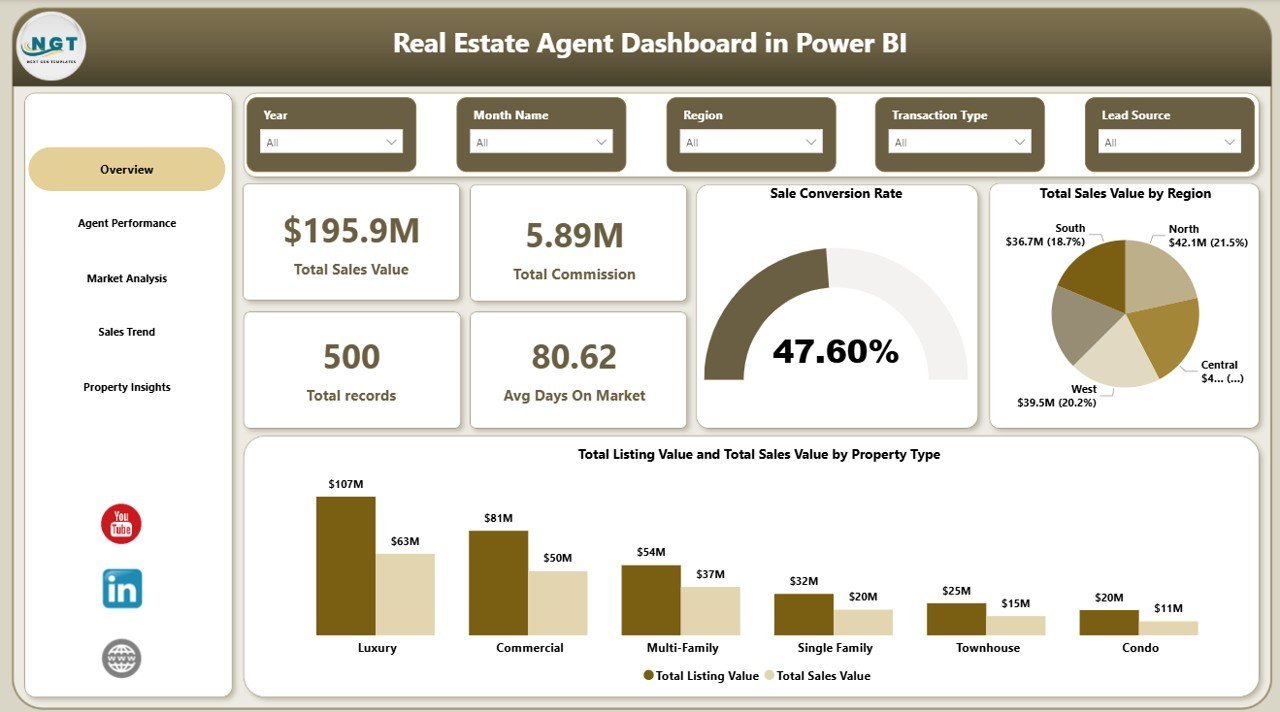
📈 5 High-Level KPI Cards – Instantly track Total Sales Value, Total Commission, Total Records, Avg Days On Market, and Sale Conversion Rate on the Overview page for a quick executive summary.
🔍 Dynamic Slicers and Filters – Apply multiple slicers to filter by Region, Property Type, Agent Name, Neighborhood, City, Transaction Type, and Month with a single click.
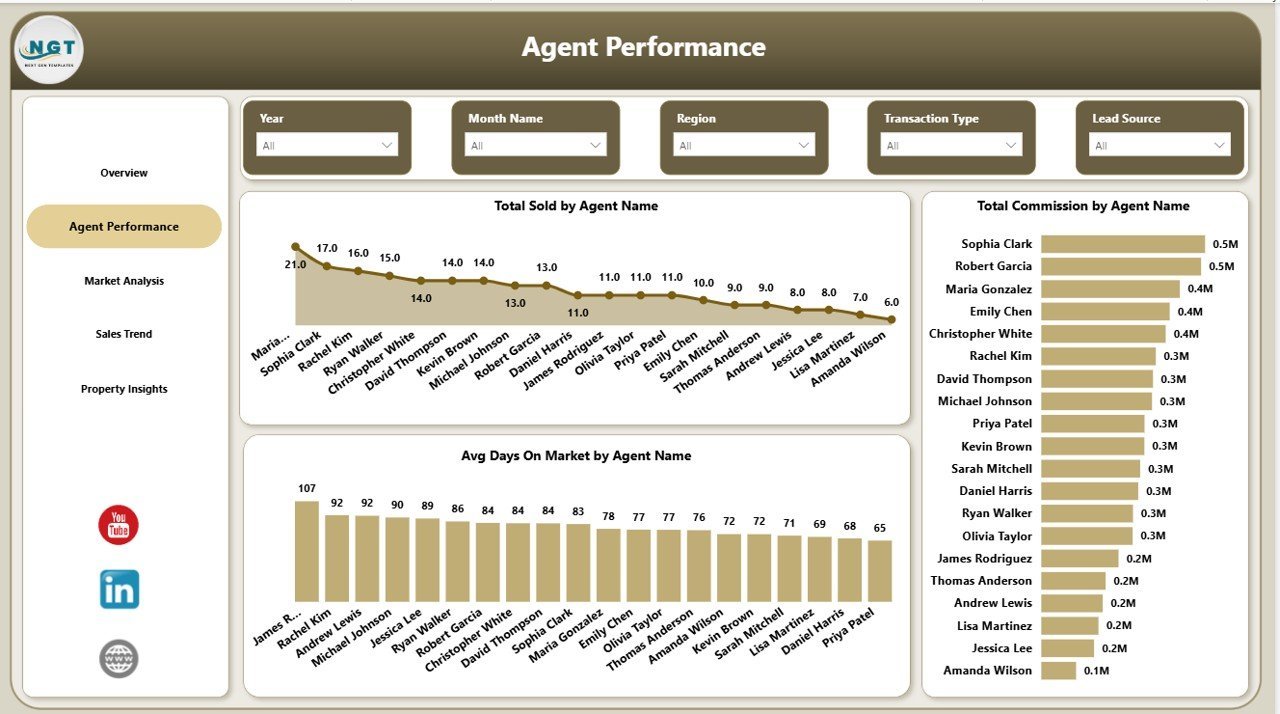
👥 Agent Performance Tracking – Compare total properties sold, commission earned, and average days on market by each agent to identify top performers and coaching opportunities.
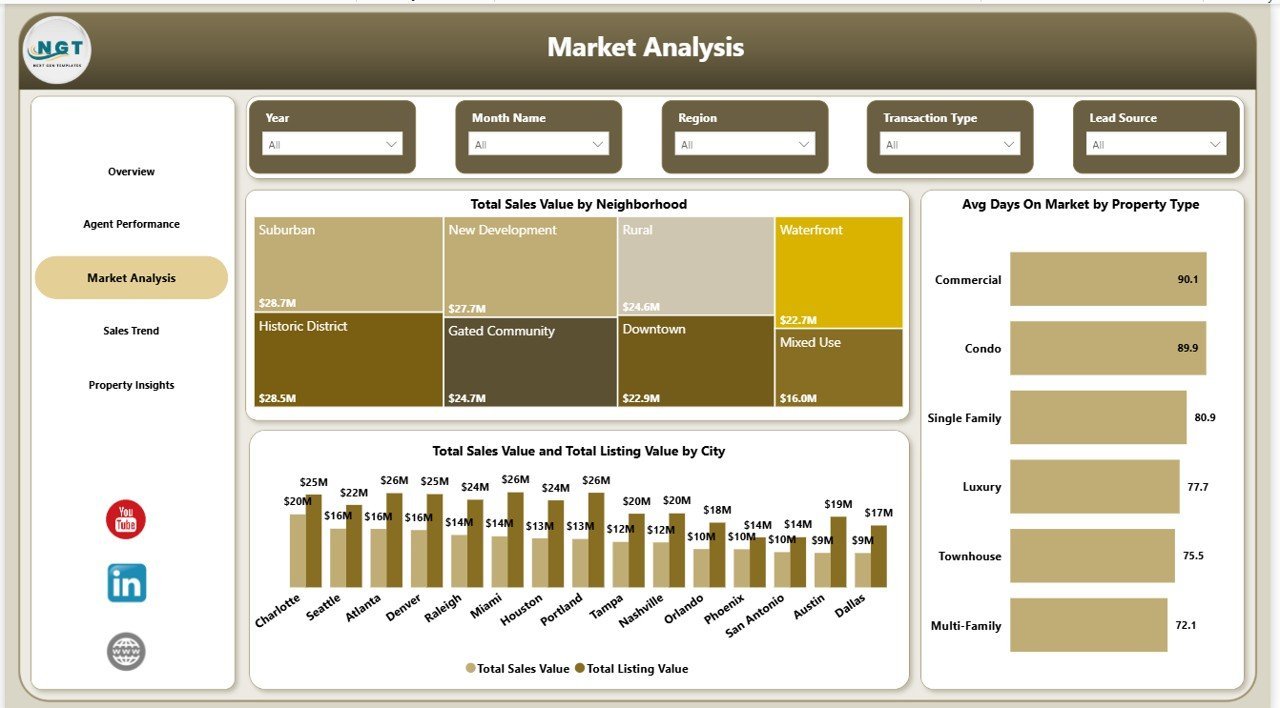
🏘️ Market Analysis by Neighborhood and City – Analyze total sales value by neighborhood, compare listing vs. sales value by city, and track average days on market by property type to spot market trends.
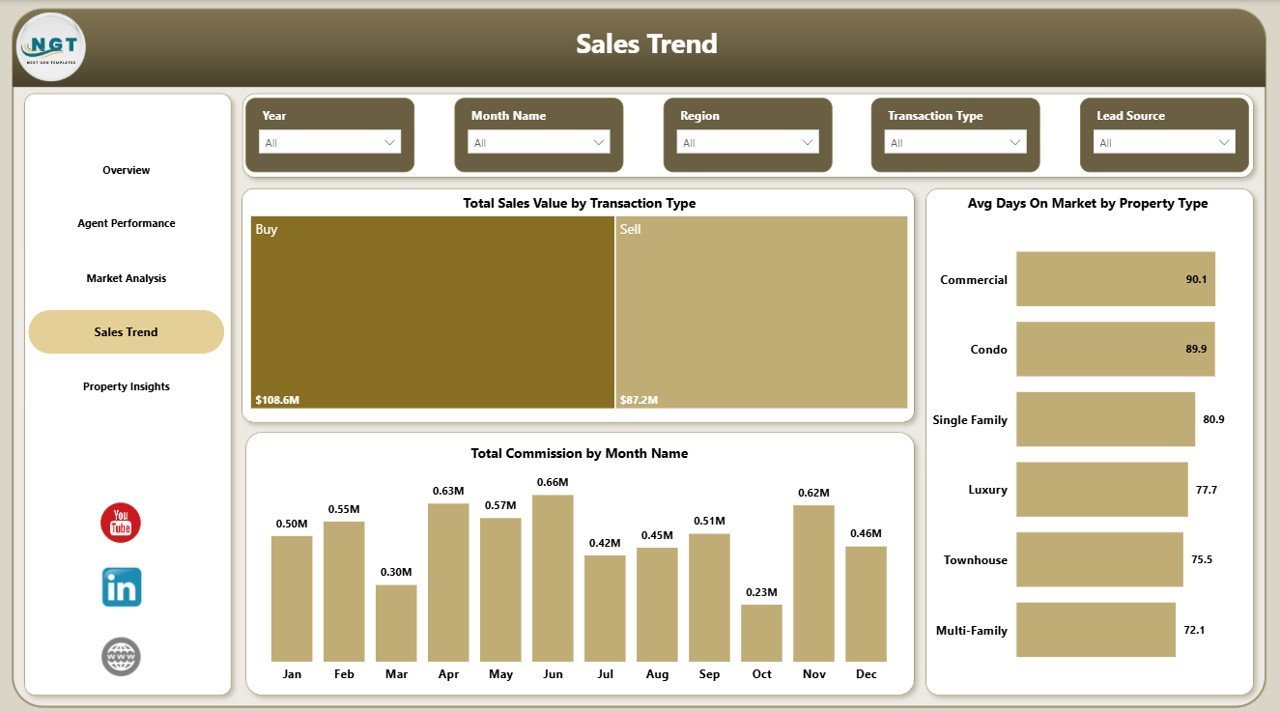
📉 Sales Trend Monitoring – View total sales value by transaction type, average days on market trends, and monthly commission patterns to plan your sales strategy effectively.
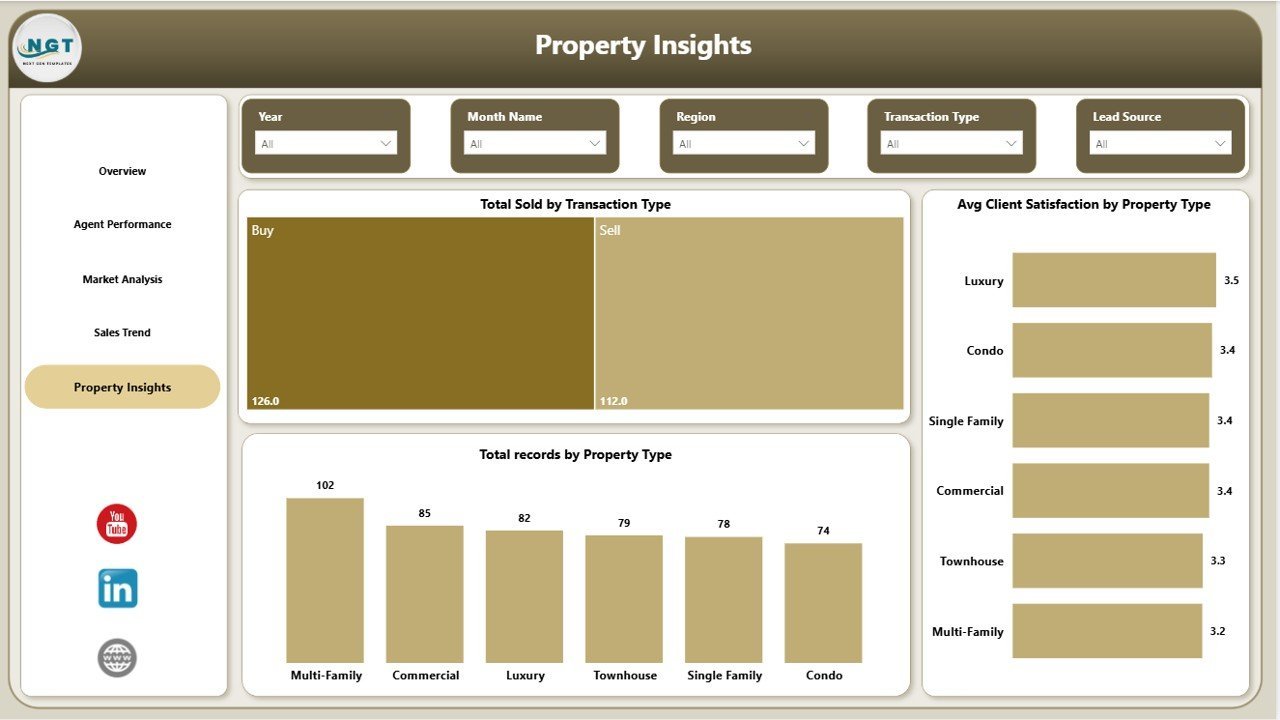
🏠 Property Insights – Understand total properties sold by transaction type, client satisfaction by property type, and total records by property type for data-driven decision making.
📦 What’s Inside the Real Estate Agent Dashboard in Power BI
This dashboard contains 5 professionally designed pages. The Overview Page presents 5 KPI cards — Total Sales Value, Total Commission, Total Records, Avg Days On Market, and Sale Conversion Rate — along with charts showing Total Sales Value by Region and a comparison of Total Listing Value vs Total Sales Value by Property Type. The Agent Performance Page displays Total Sold by Agent Name, Total Commission by Agent Name, and Avg Days On Market by Agent Name. The Market Analysis Page features Total Sales Value by Neighborhood, Avg Days On Market by Property Type, and Total Sales Value vs Total Listing Value by City. The Sales Trend Page shows Total Sales Value by Transaction Type, Avg Days On Market by Property Type, and Total Commission by Month Name. The Property Insights Page covers Total Sold by Transaction Type, Avg Client Satisfaction by Property Type, and Total Records by Property Type. Each page includes interactive slicers for instant filtering.
⚙️ How to Use the Real Estate Agent Dashboard in Power BI
1️⃣ Download the .pbix file and open it in Power BI Desktop (free from Microsoft).
2️⃣ Review the sample data to understand the dashboard structure and layout.
3️⃣ Replace the sample data with your own real estate transaction records.
4️⃣ Use dynamic slicers to filter data by region, property type, agent, city, or time period.
5️⃣ Analyze KPIs, agent performance, market trends, and property insights to make smarter business decisions.
👥 Who Can Benefit from This Real Estate Agent Dashboard in Power BI
🏢 Real Estate Agents and Brokers tracking their own sales performance and commission earnings.
📋 Real Estate Team Leaders monitoring agent-level KPIs and identifying top performers.
🏘️ Property Managers analyzing market trends across neighborhoods and cities.
💼 Real Estate Firms evaluating listing vs. sale values, conversion rates, and client satisfaction.
📊 Data Analysts building real estate performance reports for leadership teams.
You may also like our Real Estate Agent Dashboard in Excel or Real Estate Agent Dashboard in HTML for alternative platform options.
❓ Frequently Asked Questions
What KPIs does the Real Estate Agent Dashboard in Power BI track?
The Real Estate Agent Dashboard in Power BI tracks 5 key performance indicators: Total Sales Value, Total Commission, Total Records, Avg Days On Market, and Sale Conversion Rate. These KPIs are displayed as cards on the Overview page for instant executive-level visibility.
Can I compare individual agent performance using this dashboard?
Yes. The Agent Performance page provides detailed comparisons of total properties sold, total commission earned, and average days on market for each agent — making it easy to identify top performers and areas for improvement.
Do I need advanced Power BI skills to use this template?
No. Simply open the .pbix file in Power BI Desktop, replace the sample data with your own real estate records, and all charts, KPIs, and slicers update automatically. No DAX or coding knowledge required.
What types of market analysis does this dashboard provide?
The Market Analysis page shows Total Sales Value by Neighborhood, Avg Days On Market by Property Type, and a comparison of Total Sales Value vs Total Listing Value by City — helping you understand pricing trends and market demand across different areas.
Can I filter data by specific regions or time periods?
Yes. Every page includes dynamic slicers that let you filter by Region, Property Type, Agent Name, Neighborhood, City, Transaction Type, and Month for focused analysis.
🔗 Explore Related Templates
📌 Rental Property Investment Dashboard in Power BI – Track rental income, occupancy rates, and investment returns across your property portfolio.
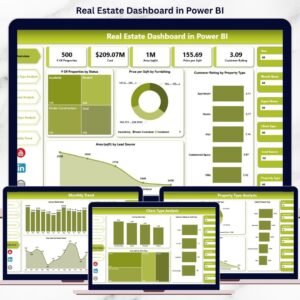
📌 Real Estate Agent Dashboard in Excel – Same analytics in Excel format for teams who prefer spreadsheet-based dashboards.
📌 Construction Project Cost Dashboard in HTML – Monitor construction budgets and cost variances with this browser-based dashboard.
📖 Click here to read the Detailed Blog Post
Watch the step-by-step video tutorial:


Reviews
There are no reviews yet.