Railway cargo operations demand precision, speed, and clear visibility. Every delay in understanding freight revenue, operating costs, profit margins, invoice status, zones, wagon types, and commodity performance directly affects profitability and planning. However, when data remains scattered across spreadsheets and manual registers, insights arrive late—and opportunities are missed.
That is exactly why the Railway Cargo Dashboard in Excel becomes a powerful, practical, and cost-effective analytics solution.
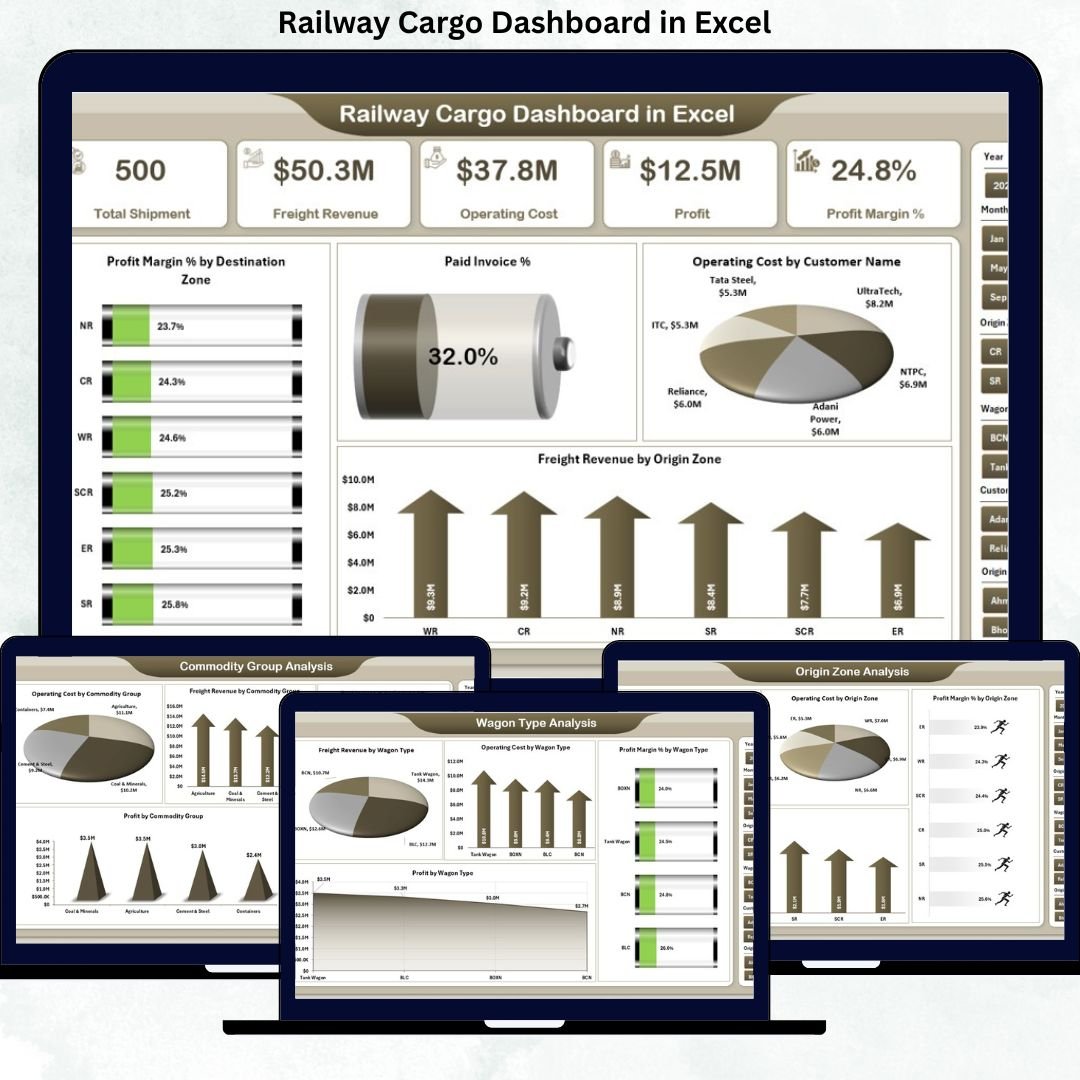
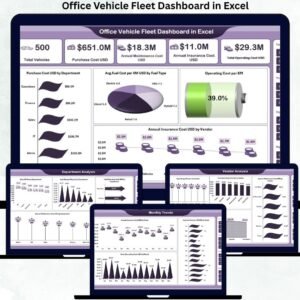
This ready-to-use Excel dashboard converts raw railway freight data into clear KPIs, interactive charts, and actionable insights—all in a single Excel file. Instead of spending hours compiling reports, railway operators, logistics managers, and finance teams gain instant clarity across costs, revenues, margins, and invoice collections.
Built entirely in Excel, this dashboard is easy to use, simple to customize, and quick to deploy, making it ideal for organizations that want strong analytics without expensive BI tools.
🔑 Key Features of Railway Cargo Dashboard in Excel
📊 Centralized Cargo Performance Monitoring
Track freight revenue, operating cost, profit margin, and invoice status in one dashboard.
💰 Cost, Revenue & Profit Visibility
Analyze operating costs, freight revenue, and profitability across zones, commodities, and wagon types.
🧾 Invoice Payment Tracking
Monitor Paid Invoice % to improve cash flow and receivable management.
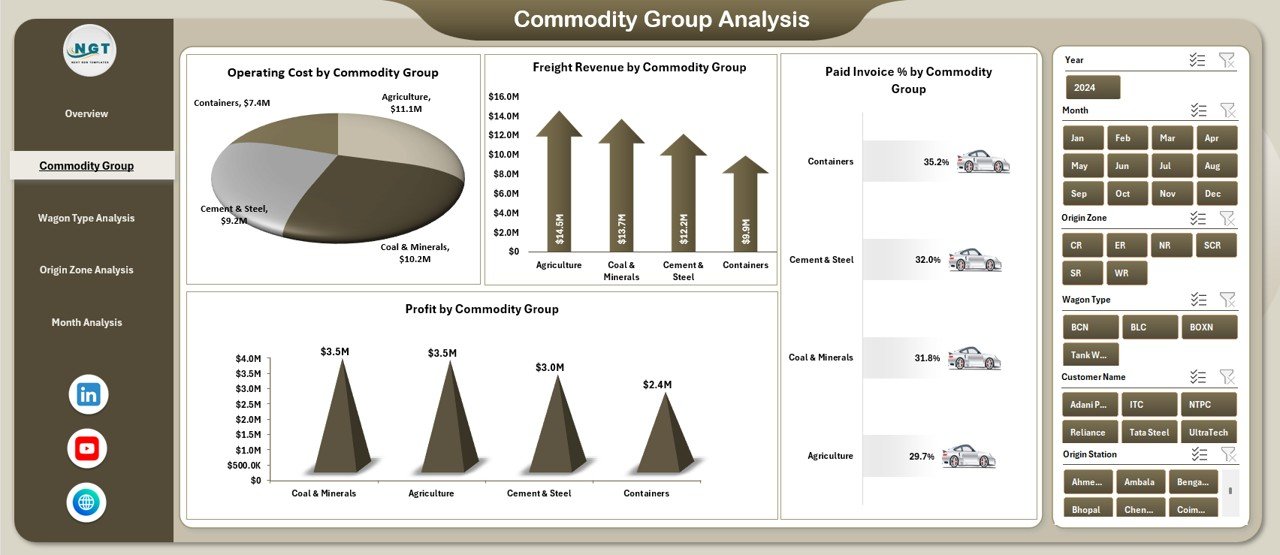
🚛 Commodity Group Analysis
Identify high-profit and high-cost commodity categories instantly.
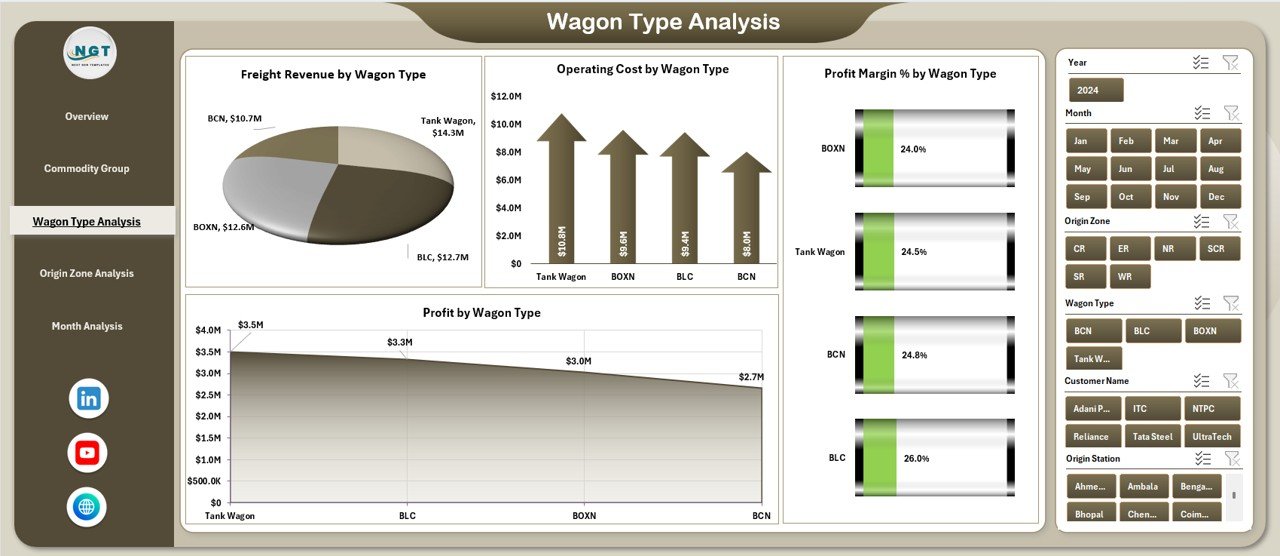
🚃 Wagon Type Performance Insights
Optimize wagon utilization by analyzing cost, revenue, and margin by wagon type.
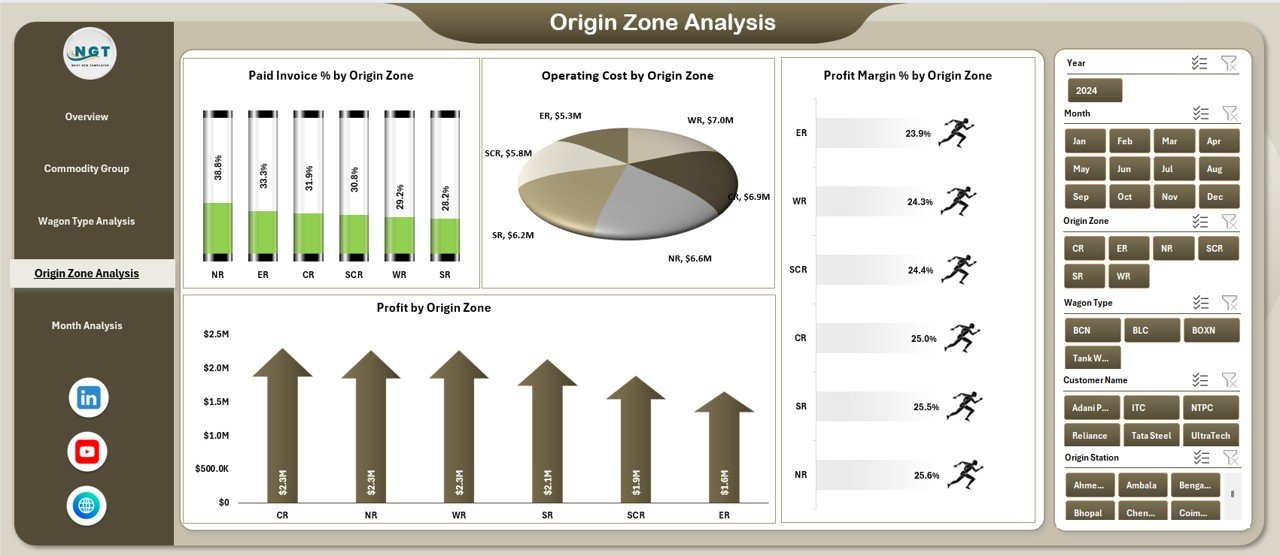
🌍 Zone-Wise Performance Tracking
Compare origin and destination zone performance for better network planning.
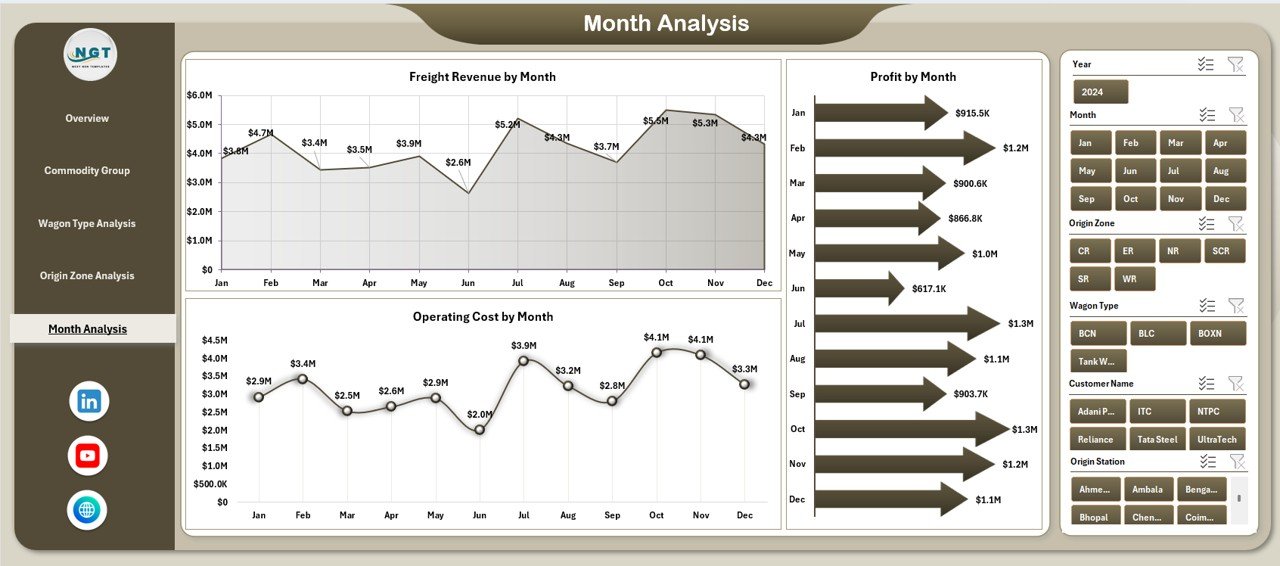
📅 Monthly Trend Analysis
Understand seasonal trends and month-to-month performance changes.
🧭 Page Navigator for Easy Navigation
Move instantly between dashboard pages without scrolling.
⚙️ 100% Excel-Based Solution
No macros required. Easy updates using familiar Excel functionality.
📂 What’s Inside the Railway Cargo Dashboard in Excel
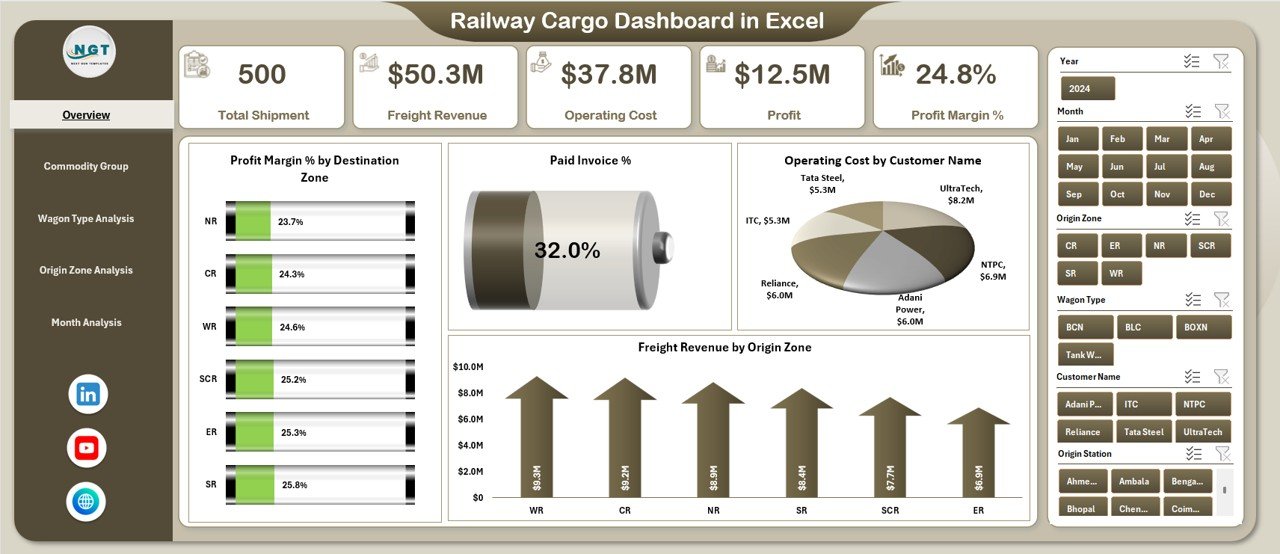
📁 Overview Page – High-level snapshot with KPI cards and strategic charts
📁 Commodity Group Analysis Page – Cost, revenue, profit, and invoice performance by commodity
📁 Wagon Type Analysis Page – Wagon-wise operational and financial insights
📁 Origin Zone Analysis Page – Zone-level cost, margin, and profit visibility
📁 Month Analysis Page – Time-based trends for cost, revenue, and profit
📊 Supporting Structure
• Centralized data tables
• Interactive slicers for deep analysis
• Automatic refresh of charts and KPIs
Together, these components deliver a complete railway freight performance intelligence system.
🛠️ How to Use the Railway Cargo Dashboard in Excel
1️⃣ Enter or update freight, cost, revenue, and invoice data in the data tables
2️⃣ Dashboard KPIs and charts refresh automatically
3️⃣ Use slicers to filter by month, zone, commodity group, wagon type, or customer
4️⃣ Review KPI cards for instant performance checks
5️⃣ Analyze charts to identify cost leakages and profit opportunities
6️⃣ Use monthly trends for forecasting and planning
No advanced Excel skills are required. The dashboard is designed for fast adoption and daily operational use.
👥 Who Can Benefit from This Railway Cargo Dashboard in Excel
🚆 Railway cargo operators
📦 Freight logistics managers
💰 Finance and accounts teams
📊 Operations planners
🏛️ Government railway authorities
🔍 Supply chain and transport analysts
If your organization manages railway freight operations, revenue, and costs, this dashboard delivers immediate value.
📘 Click here to read the Detailed blog post
🎥 Visit our YouTube channel to learn step-by-step video tutorials
👉 YouTube Channel


Reviews
There are no reviews yet.