Radiology and Imaging Dashboard operate in a high-speed, high-value healthcare environment. Every day, imaging facilities handle MRI, CT, X-Ray, and Ultrasound scans while managing technicians, departments, referral doctors, and city-level operations. However, many diagnostic centers still rely on scattered spreadsheets. As a result, leaders struggle to track completed scan percentage, revenue targets, turnaround time, and profitability in one place.
That’s exactly why the Radiology and Imaging Dashboard in Excel becomes a powerful solution.
This ready-to-use and fully interactive Excel dashboard centralizes your operational and financial KPIs into one structured reporting system. Instead of juggling multiple files, you gain real-time visibility into revenue, cost, profit, technician productivity, referral performance, and monthly trends — all in one place.
Whether you manage a single diagnostic center or a multi-city imaging chain, this dashboard helps you improve operational control, boost profitability, and make faster data-driven decisions.
🔑 Key Feature of Radiology and Imaging Dashboard in Excel
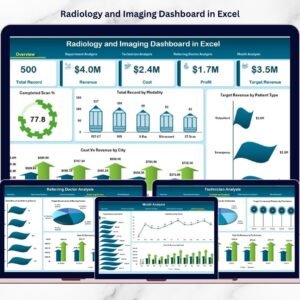
📊 Executive Overview Page
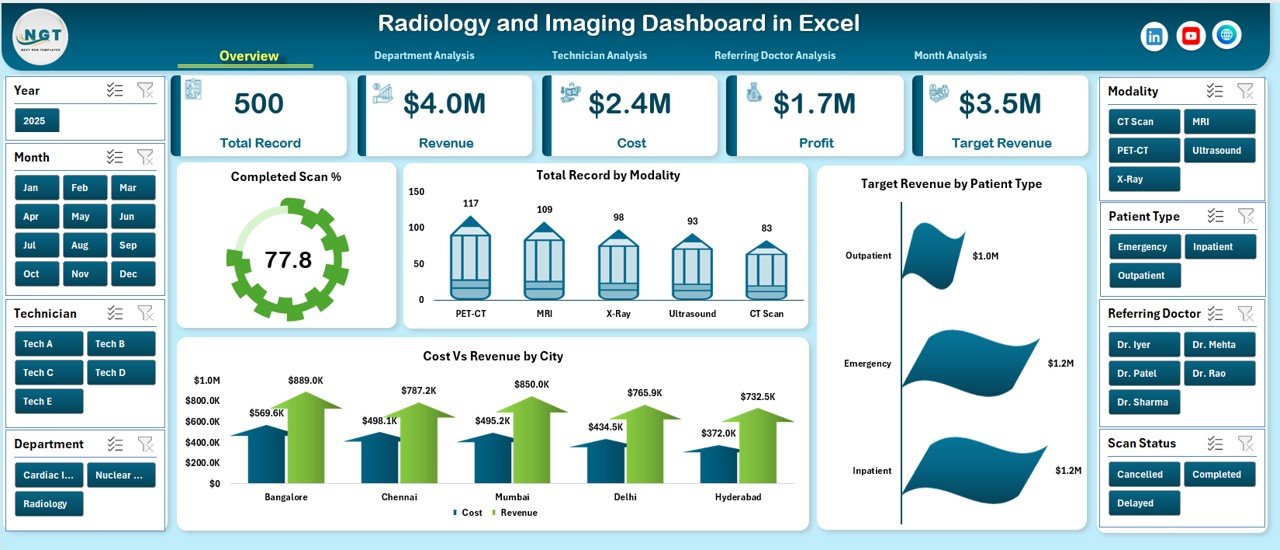
Instantly monitor Total Revenue, Total Cost, Total Profit, and Completed Scan % through dynamic KPI cards.
🧭 Left-Side Page Navigator
Switch smoothly between analytical pages without confusion.
🎯 Target vs Actual Revenue Tracking
Compare revenue goals against actual performance with clear visuals.
💰 Cost vs Revenue Analysis
Identify profit leakage areas across departments and cities.
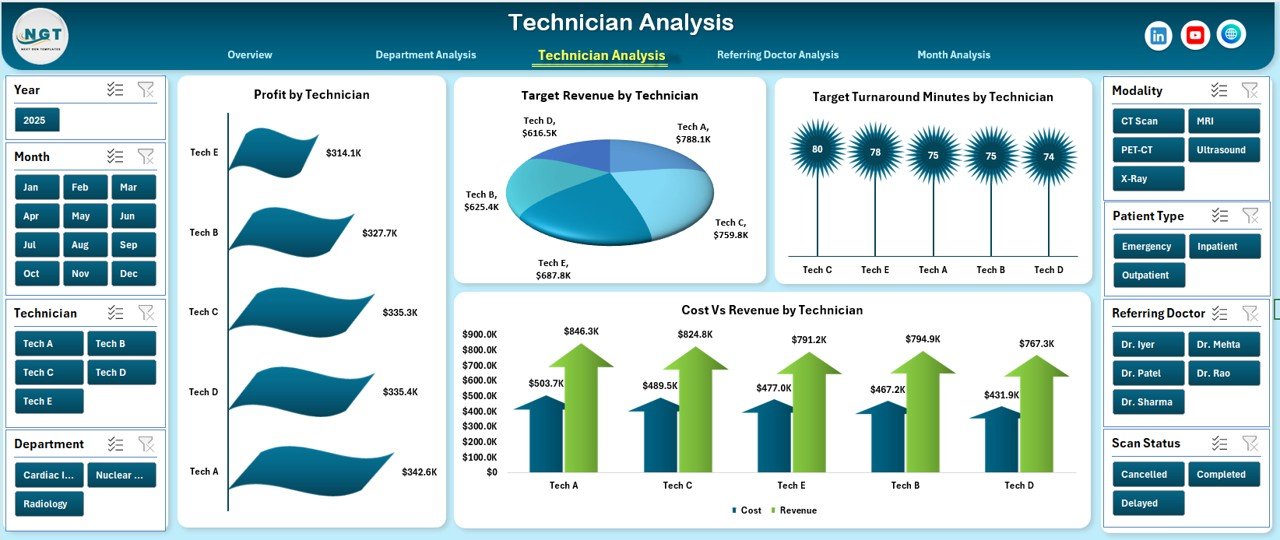
👨⚕️ Technician Performance Monitoring
Track productivity, turnaround time, and revenue contribution.
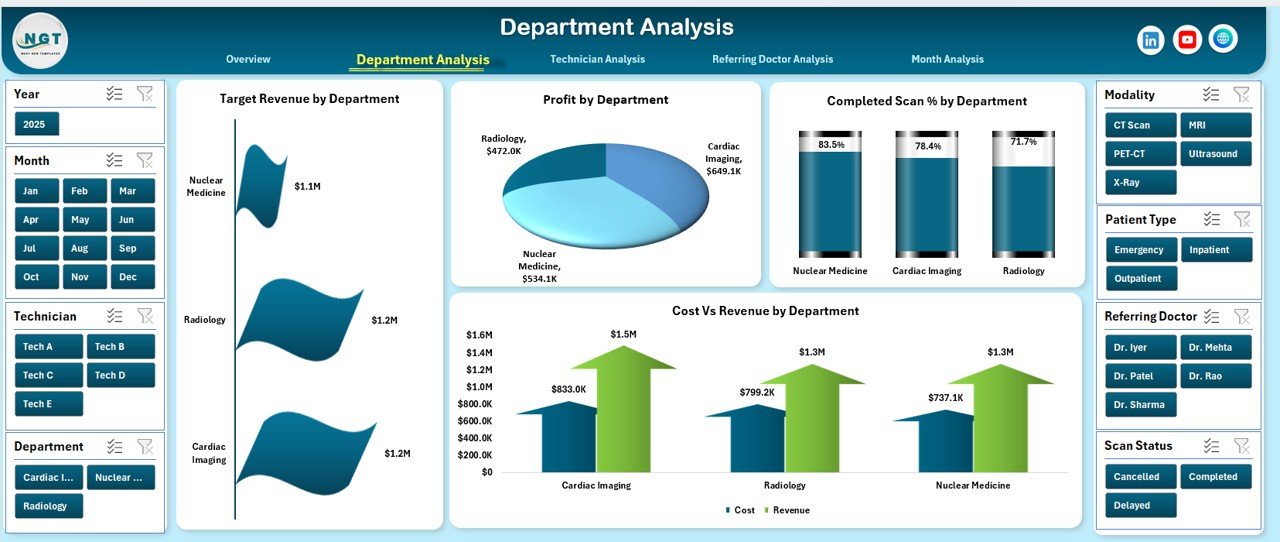
🏥 Department-Wise Insights
Analyze departmental profitability and scan completion rates.
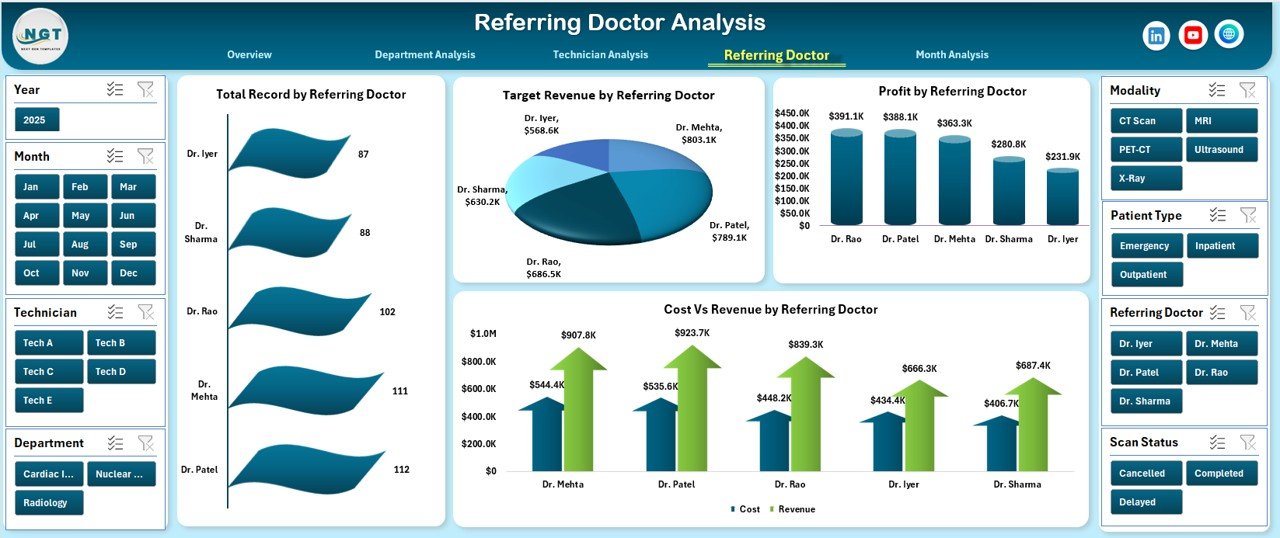
🤝 Referring Doctor Analysis
Measure referral revenue contribution and strengthen partnerships.
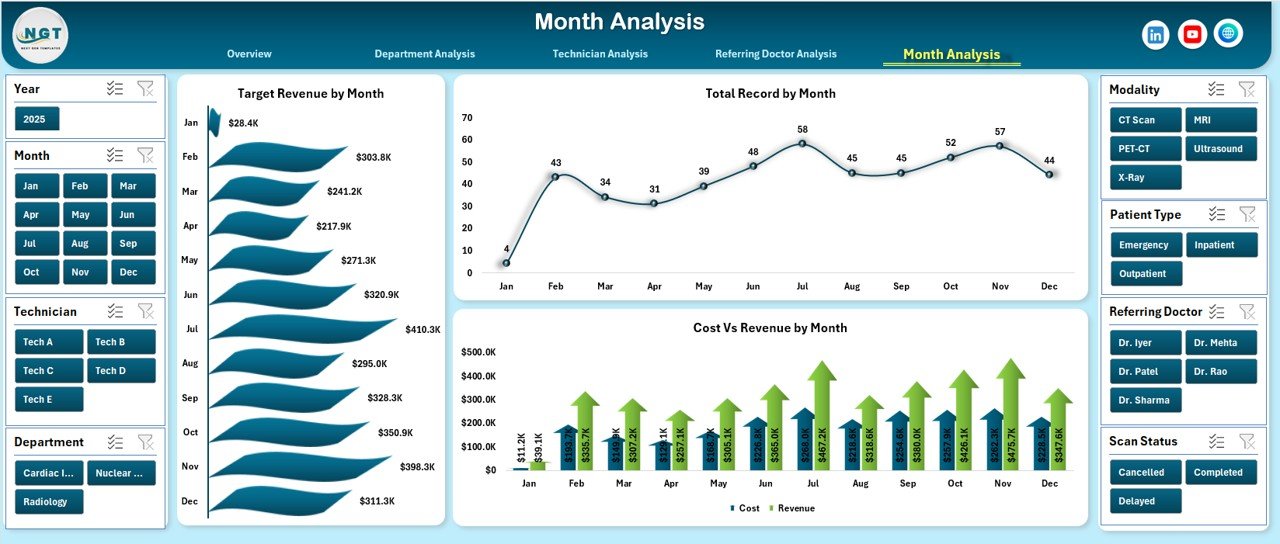
📅 Monthly Trend Analysis
Track seasonal performance, scan volume growth, and revenue trends.
⚡ Fully Customizable Excel Structure
Modify KPIs, targets, charts, and layouts based on your center’s needs.
📦 What’s Inside the Radiology and Imaging Dashboard in Excel
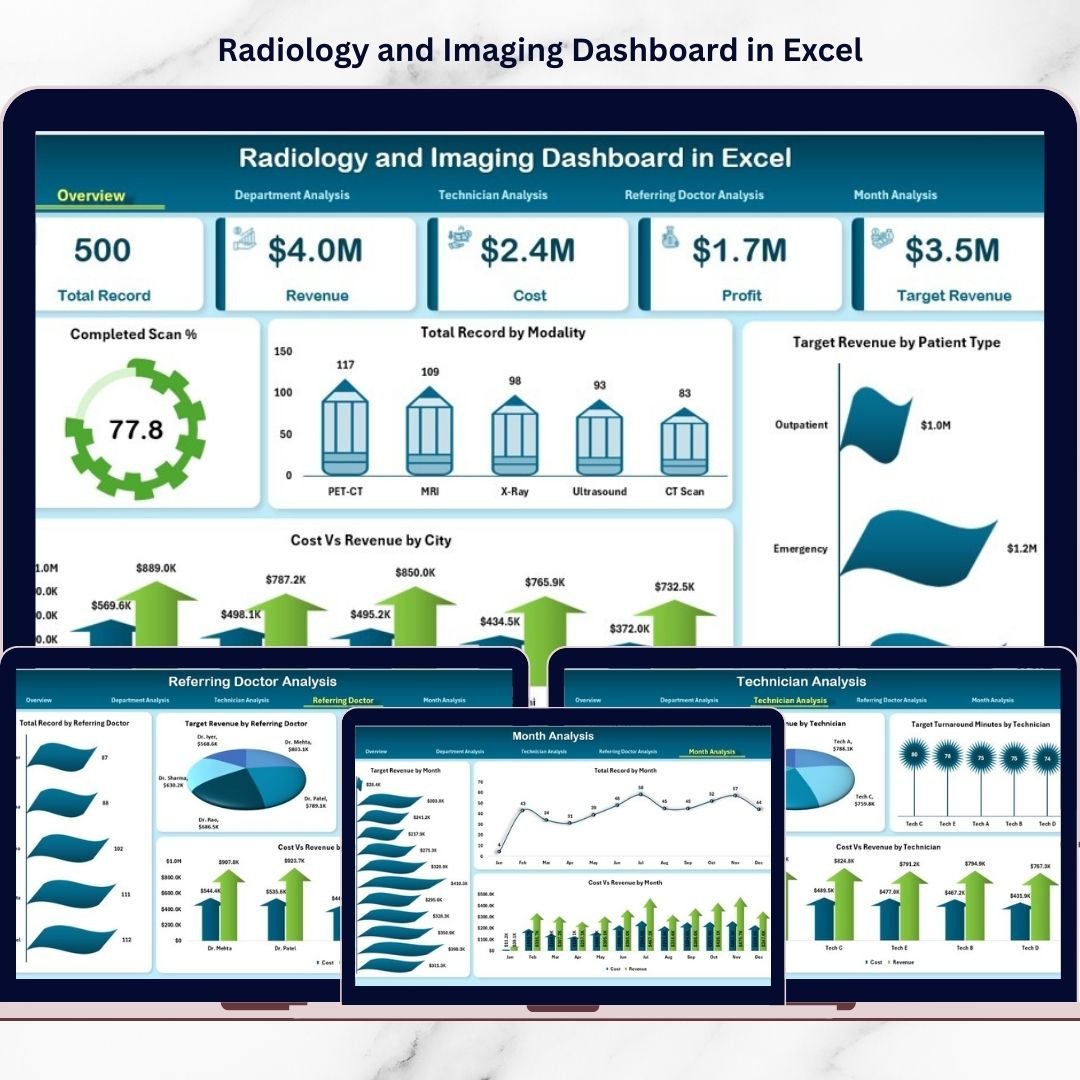
This dashboard includes 5 structured analytical pages:
✔️ Overview Page – Complete performance snapshot
✔️ Department Analysis Page – Department-wise revenue and profit tracking
✔️ Technician Analysis Page – Productivity and turnaround performance
✔️ Referring Doctor Analysis Page – Referral revenue insights
✔️ Month Analysis Page – Time-based performance trends
Additionally, you get:
✔️ Structured Data Sheet
✔️ Support Sheet with dynamic lists
✔️ Pivot Tables and Pivot Charts
✔️ Slicers for instant filtering
✔️ Automated KPI calculations
Everything is ready to use — simply enter your data and start analyzing.
🛠️ How to Use the Radiology and Imaging Dashboard in Excel
Getting started is simple:
Step 1: Enter your scan and financial data in the Data Sheet
Step 2: Update revenue targets and cost values
Step 3: Use slicers to filter by Month, City, Department, or Modality
Step 4: Analyze KPI cards and charts
Step 5: Conduct monthly review meetings using dashboard insights
Within minutes, you will have a centralized reporting system for your radiology center.
🎯 Who Can Benefit from This Radiology and Imaging Dashboard in Excel
This dashboard is ideal for:
✅ Radiology Clinics
✅ Diagnostic Centers
✅ Multi-Specialty Hospitals
✅ Imaging Chains
✅ Healthcare Administrators
✅ Operations Managers
✅ Financial Controllers
If you want better control over revenue, cost, technician performance, and referral strategy, this dashboard is built for you.
Why This Dashboard Transforms Imaging Center Performance
Instead of working with fragmented data, you gain:
✔️ Centralized KPI monitoring
✔️ Real-time filtering
✔️ Clear profitability tracking
✔️ Improved staff accountability
✔️ Stronger referral insights
✔️ Better revenue forecasting
Over time, structured analysis leads to faster turnaround, higher patient satisfaction, and stronger profit margins.
### Click hare to read the Detailed blog post
📺 Visit our YouTube channel to learn step-by-step video tutorials
👉 Youtube.com/@PKAnExcelExpert