Audio content is booming—but managing radio and podcast performance without clear analytics is a nightmare. Listener behavior changes fast, advertising revenue fluctuates, and content decisions demand accurate data. Unfortunately, manual Excel reports and disconnected files slow teams down and hide real insights.
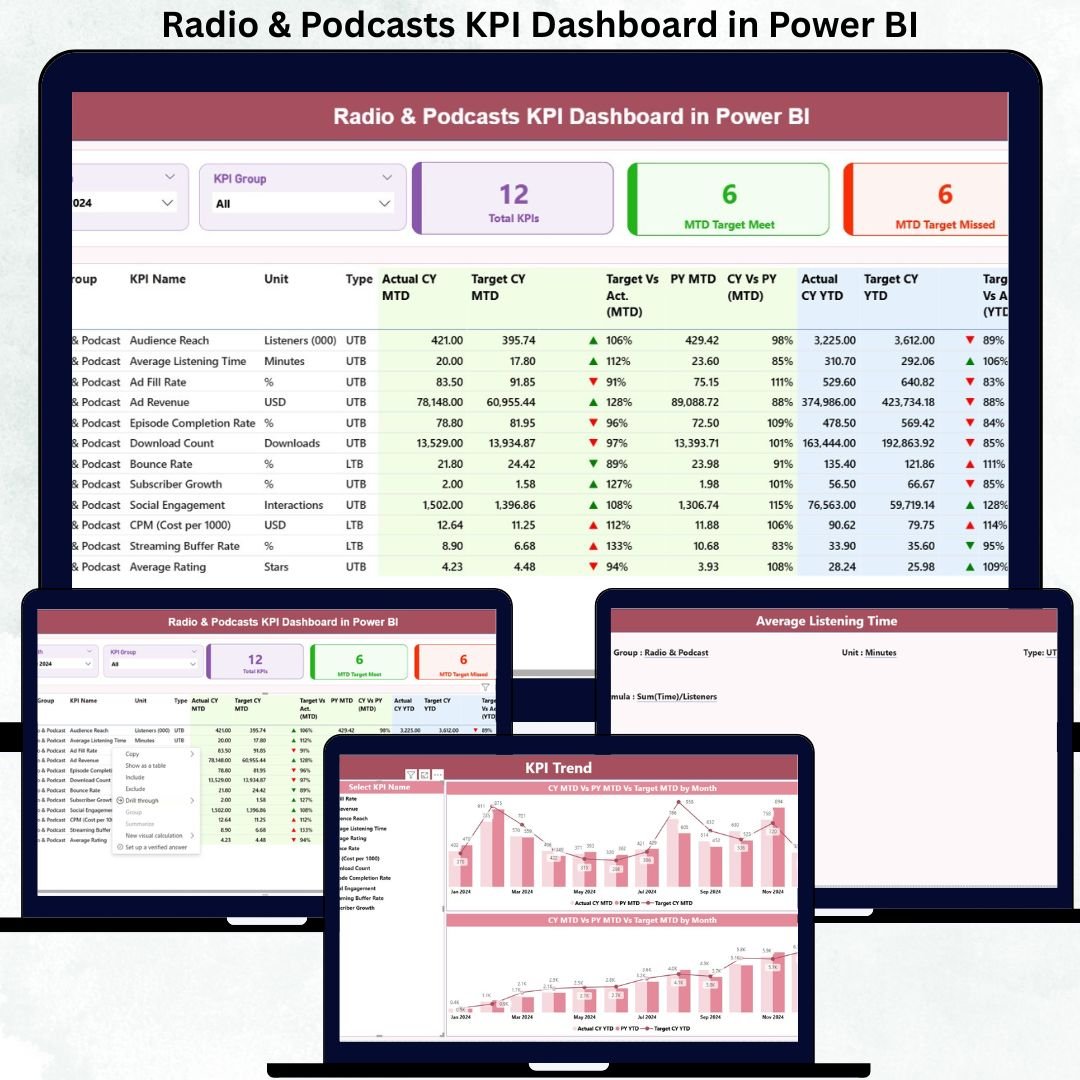
The Radio & Podcasts KPI Dashboard in Power BI is a ready-to-use, professional analytics solution that transforms raw data into clear, interactive, and actionable insights. Designed for radio stations, podcast creators, and media teams, this dashboard helps you track audience growth, content performance, revenue KPIs, and operational efficiency—all in one place.
Instead of spending hours preparing reports, this dashboard lets you analyze performance in minutes and make faster, smarter, and more confident decisions.
🚀 Key Features of Radio & Podcasts KPI Dashboard in Power BI
🎧 All-in-One KPI Monitoring – Track audience, content, revenue, and operational KPIs on a single platform
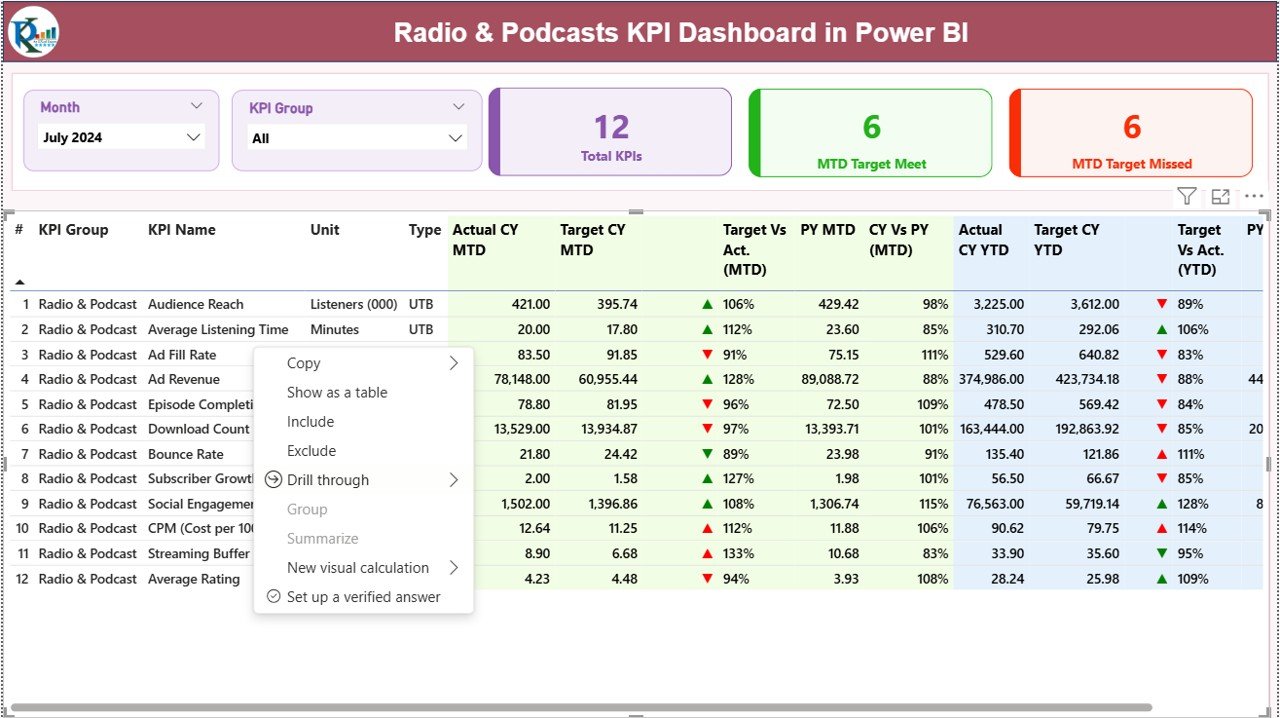
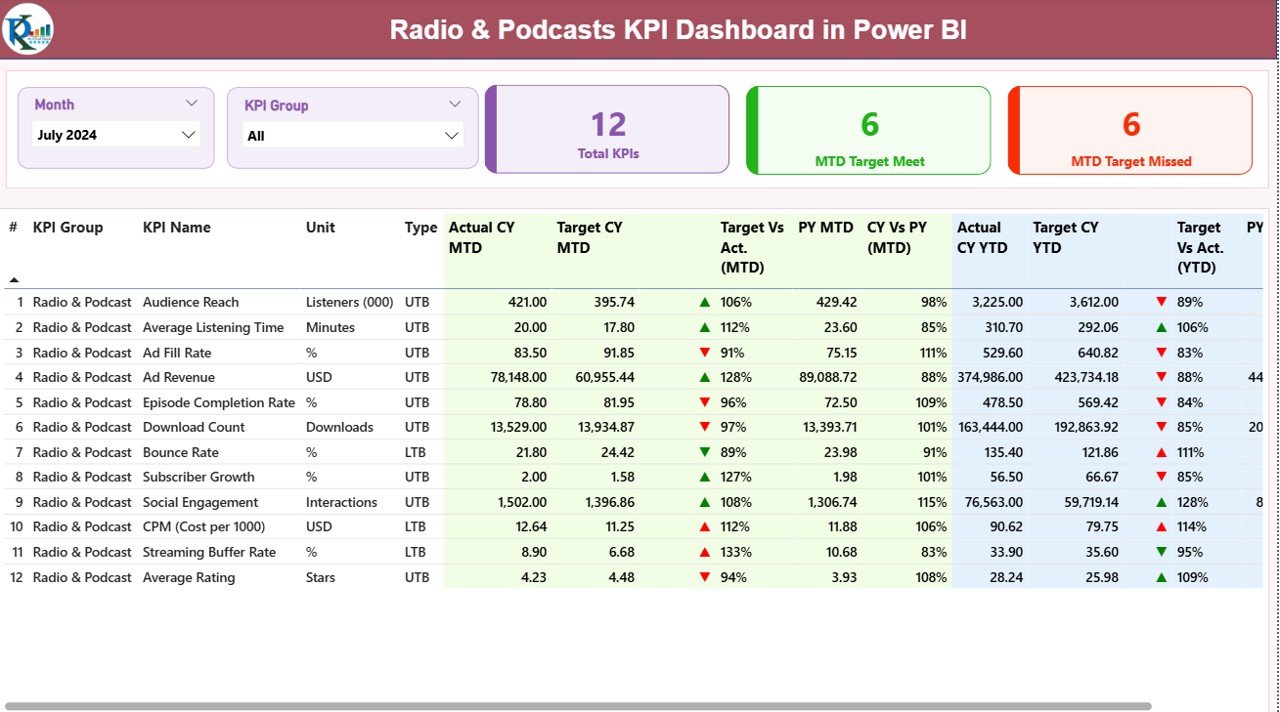
📊 MTD & YTD Performance Tracking – Instantly compare Month-to-Date and Year-to-Date performance
🎯 Target vs Actual Analysis – Identify gaps using built-in target comparisons
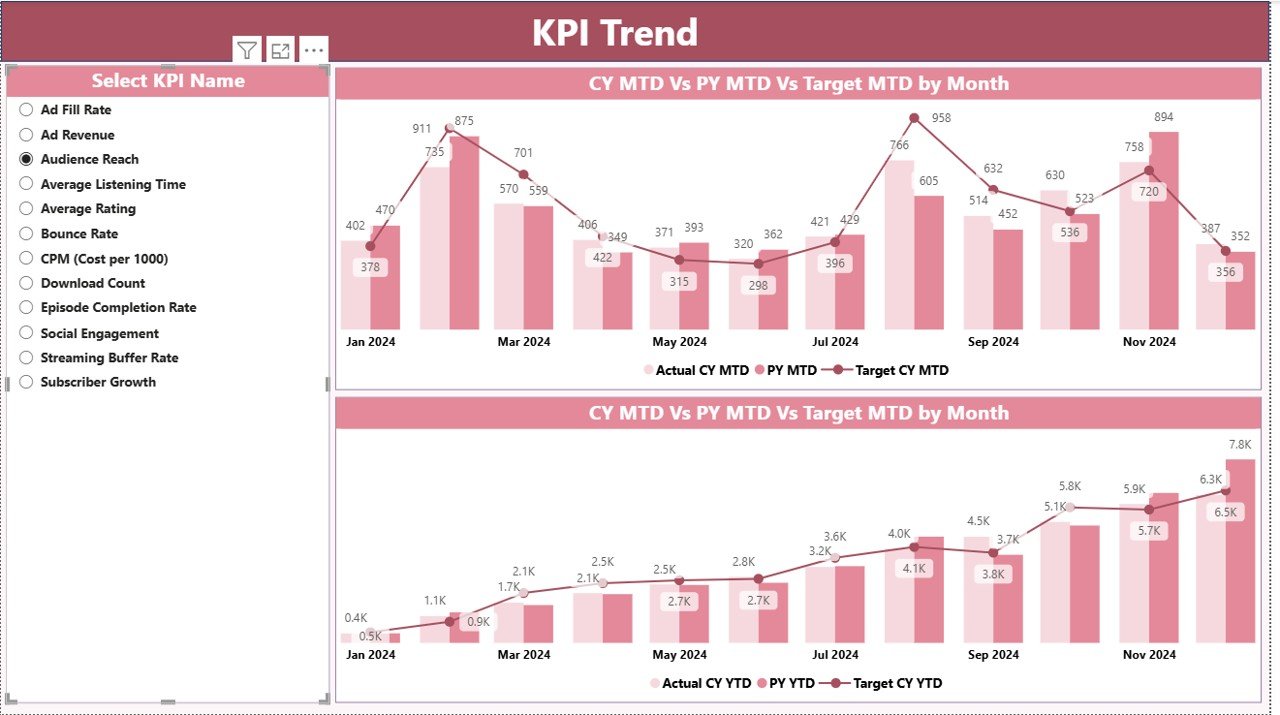
📈 Trend Analysis Charts – Visualize performance trends with MTD and YTD combo charts
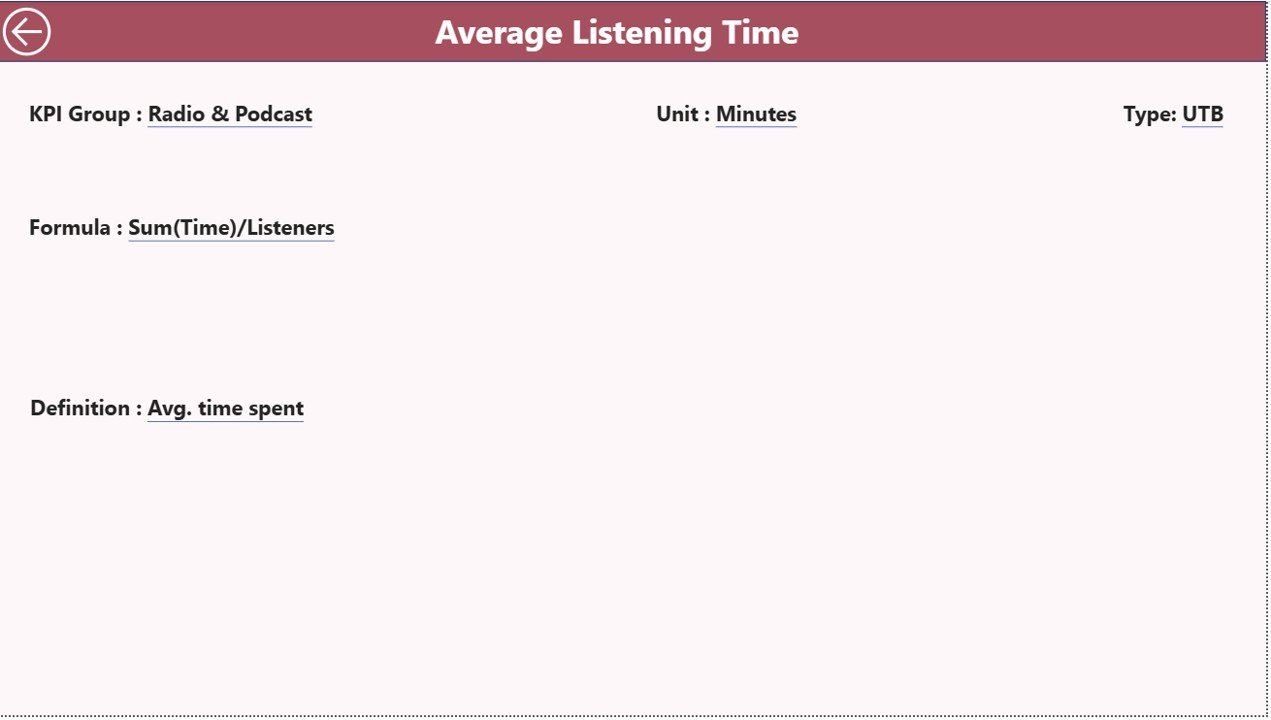
🔍 Drill-Through KPI Definitions – Understand formulas, logic, and KPI meaning instantly
⚡ Real-Time Refresh – Update numbers instantly by refreshing Power BI
🧩 Flexible KPI Structure – Add or modify KPIs easily through Excel
🎨 Clean & Professional Layout – Easy to understand, presentation-ready design
📦 What’s Inside the Radio & Podcasts KPI Dashboard
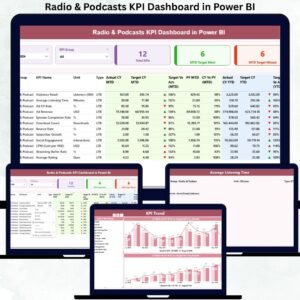
📄 Power BI Dashboard File (.pbix) with 3 interactive pages
📊 Summary Page – Complete KPI snapshot with status icons and comparisons
📈 KPI Trend Page – MTD & YTD trend charts for selected KPIs
📘 KPI Definition Page (Drill-Through) – Formula, definition, unit, and KPI logic
📑 Excel Data Source with 3 structured sheets:
-
Input_Actual – Actual MTD & YTD values
-
Input_Target – Target MTD & YTD values
-
KPI Definition – KPI metadata (Group, Formula, Unit, Type)
Everything is pre-built—you only need to enter your data.
🛠️ How to Use the Radio & Podcasts KPI Dashboard
✅ Step 1: Enter monthly actual values in the Input_Actual Excel sheet
✅ Step 2: Define targets in the Input_Target sheet
✅ Step 3: Maintain KPI structure in the KPI Definition sheet
✅ Step 4: Open the Power BI file and refresh data
✅ Step 5: Use slicers to analyze KPIs by Month and KPI Group
✅ Step 6: Review trends, target gaps, and YOY performance
✅ Step 7: Use drill-through for KPI clarity during reviews
No advanced Power BI knowledge required.
🎯 Who Can Benefit from This Radio & Podcasts KPI Dashboard?
🎙️ Radio Stations & Broadcasters
🎧 Podcast Creators & Networks
📡 Audio Streaming Platforms
📢 Media & Advertising Agencies
📊 Content & Production Teams
💰 Revenue & Sponsorship Managers
📈 Media Analysts & Decision-Makers
If you rely on audio content performance, this dashboard is built for you.
Click here to read the Detailed blog post
Watch the step-by-step video tutorial:


Reviews
There are no reviews yet.