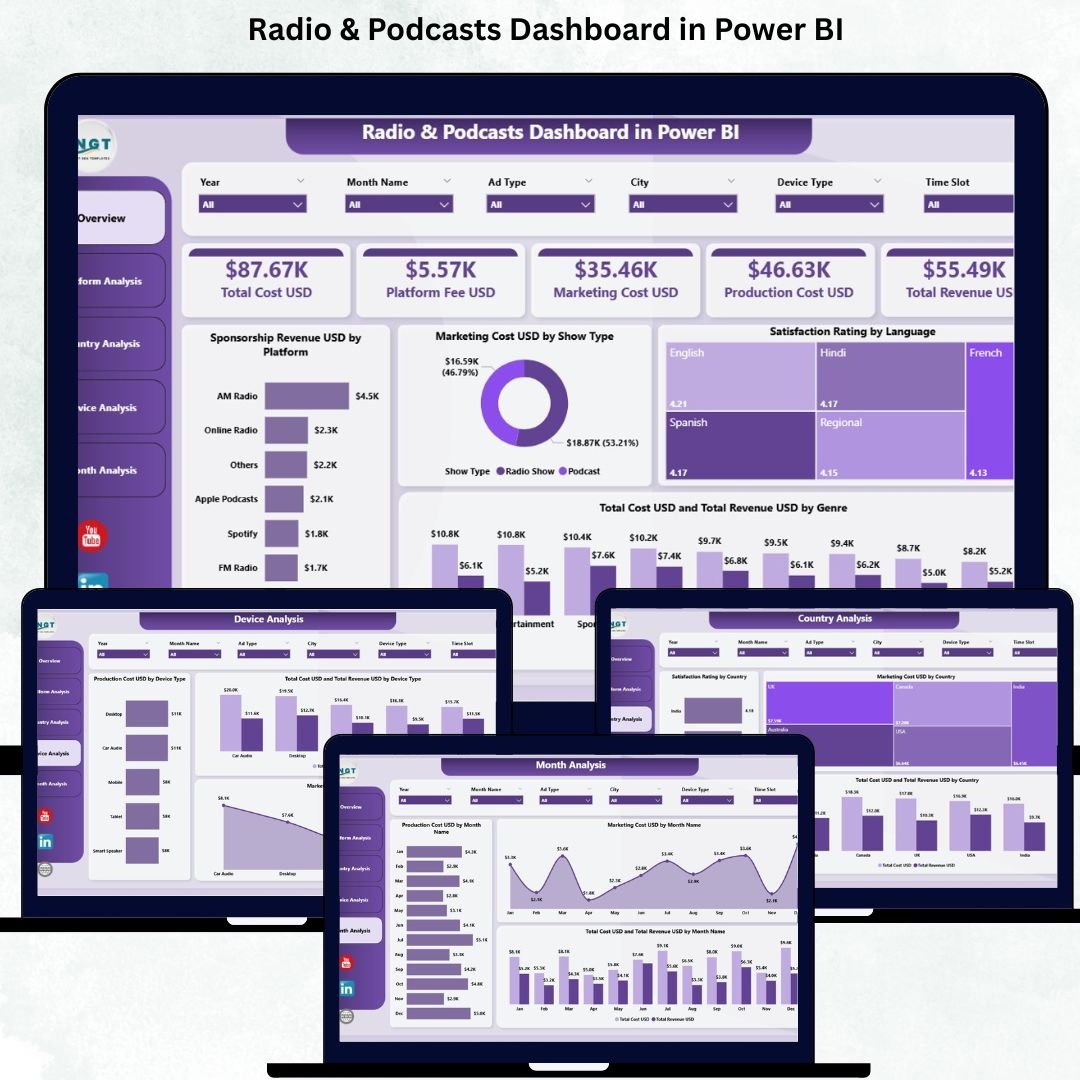
The Radio & Podcasts Dashboard is expanding faster than ever. Every day, millions of listeners tune in from different countries, devices, platforms, and audio apps. Content creators, radio stations, and podcast networks must track performance continuously—because listener behavior changes quickly, sponsorship trends shift, and marketing costs vary. Traditional spreadsheets and manual reports cannot meet the speed and accuracy the industry demands.
A Radio & Podcasts Dashboard in Power BI solves this problem completely. It transforms raw audio performance data into beautiful visuals, actionable metrics, and real-time insights. With a single click, you can understand what content works, which platforms generate more revenue, which regions perform better, and how your monthly marketing costs are behaving.
This ready-to-use dashboard is built to support radio channels, podcast creators, streaming platforms, advertisers, and media managers. It helps you remove guesswork and make confident, data-driven decisions.
🎧 Key Features of the Radio & Podcasts Dashboard in Power BI
Designed with five powerful analytical pages, this dashboard gives teams full control over revenue, cost, satisfaction scores, device usage, platform trends, and country-wise performance.
🎙️ What’s Inside the Radio & Podcasts Dashboard in Power BI?
(Each section below is built using clean visuals, slicers, and dynamic Power BI charts.)
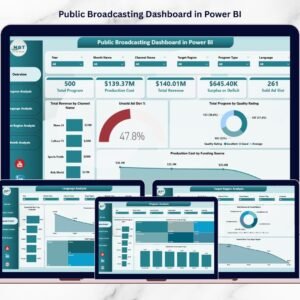
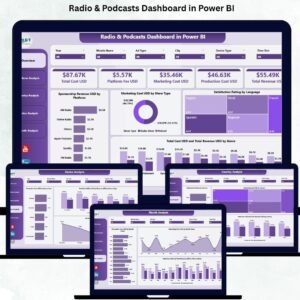
⭐ 1) Overview Page – The Command Center of the Dashboard
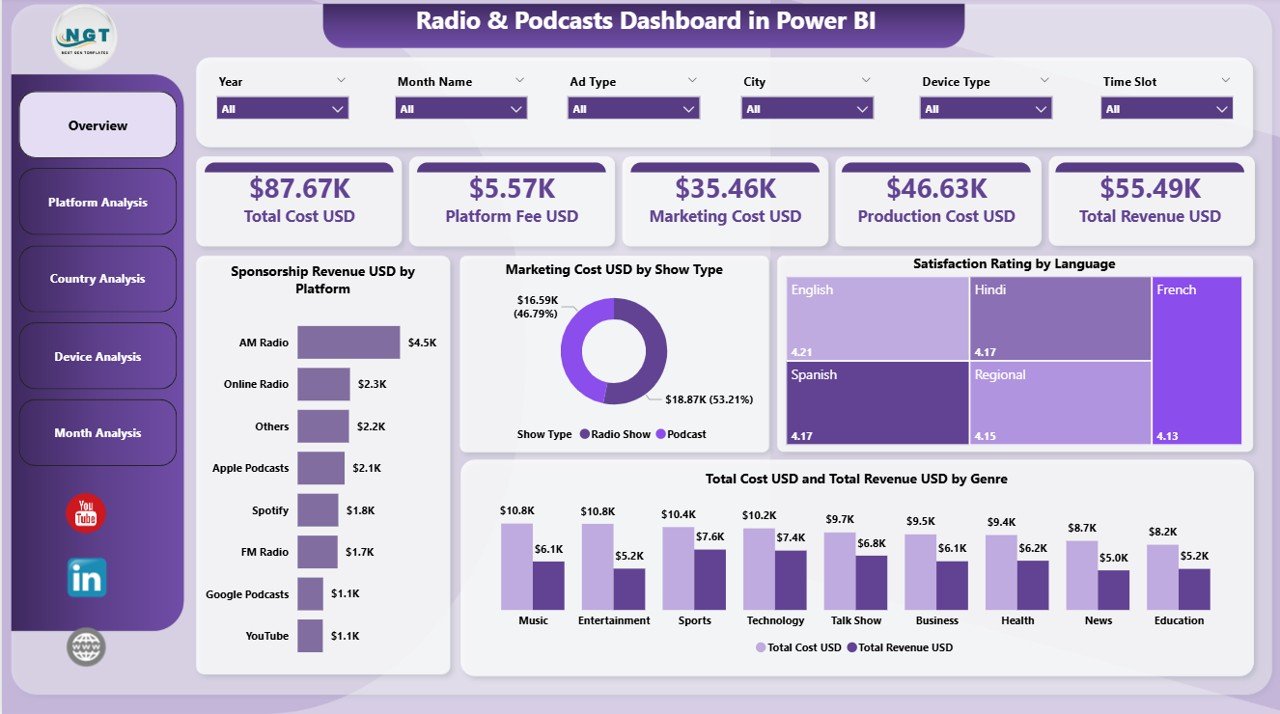
The Overview Page gives you a complete snapshot of business performance.
🔹 KPI Cards Include:
-
💰 Total Sponsorship Revenue (USD)
-
📢 Total Marketing Cost (USD)
-
⭐ Total Satisfaction Rating
-
📊 Total Cost & Total Revenue
🔹 Charts Included:
-
Sponsorship Revenue by Platform
-
Marketing Cost by Show Type
-
Satisfaction Rating by Language
-
Total Cost & Revenue by Genre
With slicers for platform, month, country, device, or show type—users get clean, instant insights.
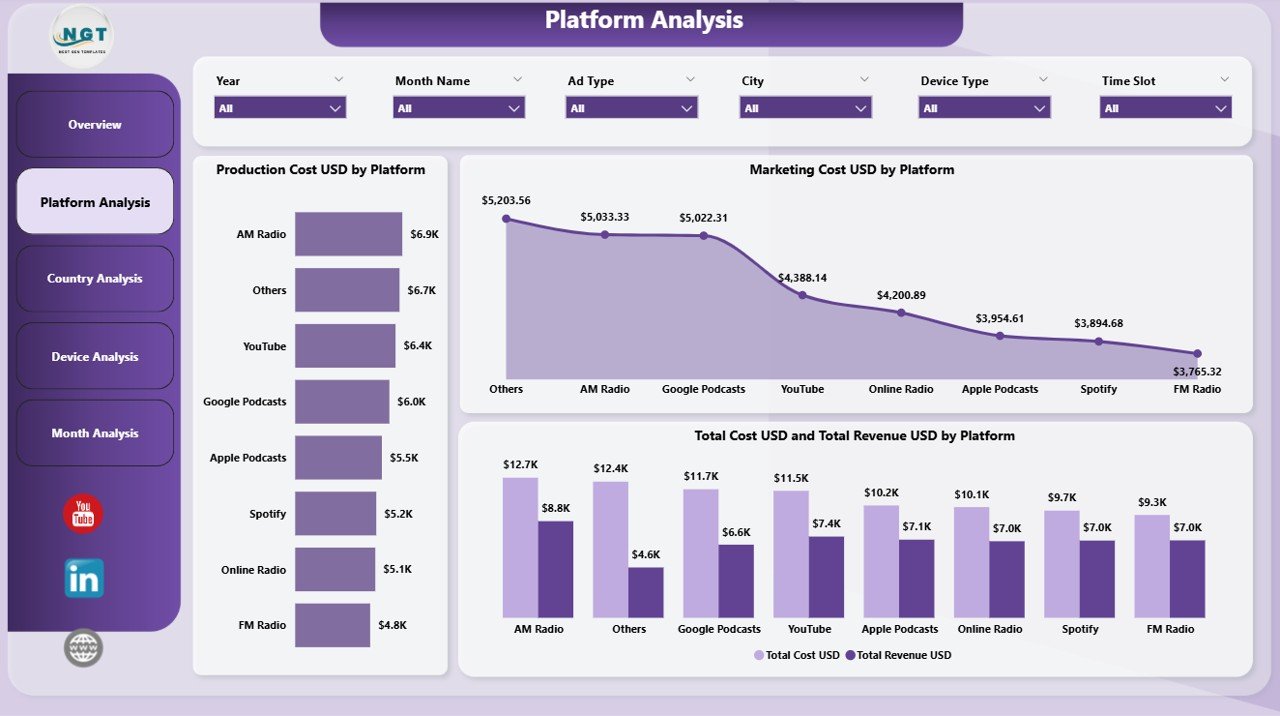
⭐ 2) Platform Analysis – Compare All Audio Platforms
The Platform Analysis Page helps you evaluate performance across listening platforms like:
🎧 Spotify
📻 FM Radio
🎵 Apple Podcasts
📺 YouTube
📱 Amazon Music
…and more.
Charts Included:
-
Production Cost by Platform
-
Marketing Cost by Platform
-
Total Cost & Revenue by Platform
This helps teams decide where to invest, promote, and publish for maximum returns.
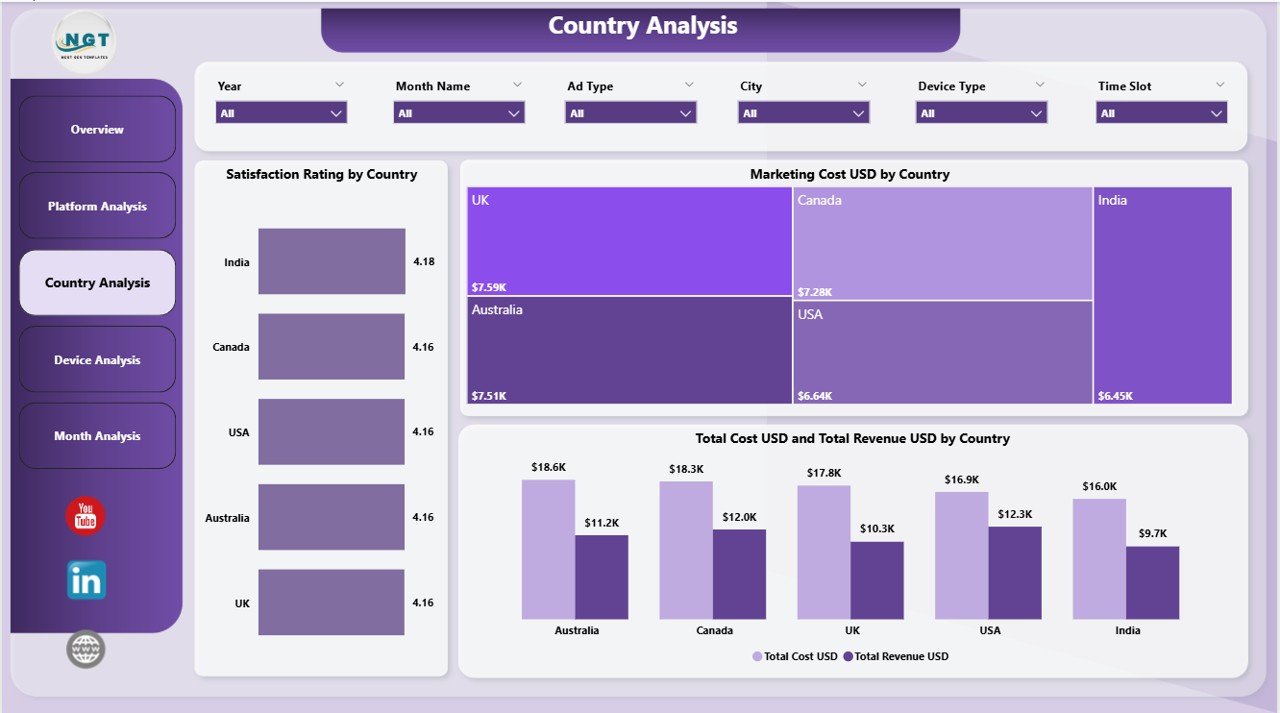
⭐ 3) Country Analysis – Track Regional Listener Behavior
Listeners behave differently across regions. The Country Analysis Page uncovers this clearly.
Charts Included:
-
⭐ Satisfaction Rating by Country
-
💸 Marketing Cost by Country
-
📊 Total Cost & Revenue by Country
This page is perfect for geo-targeted campaigns and regional content planning.
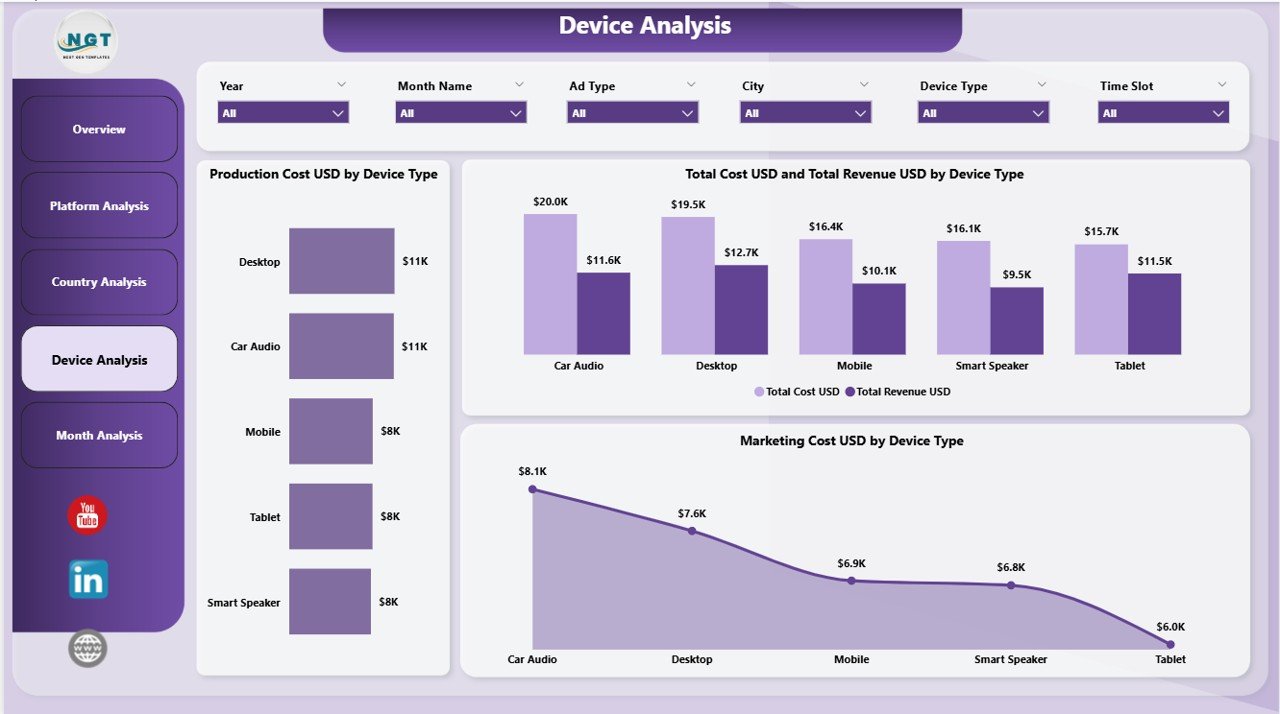
⭐ 4) Device Analysis – Understand How Your Audience Listens
Listeners use multiple devices—mobile, tablet, laptop, smart speaker, car audio, etc.
Charts Included:
-
Production Cost by Device Type
-
Marketing Cost by Device Type
-
Total Cost & Revenue by Device Type
This helps creators and tech teams optimize content quality and distribution channels.
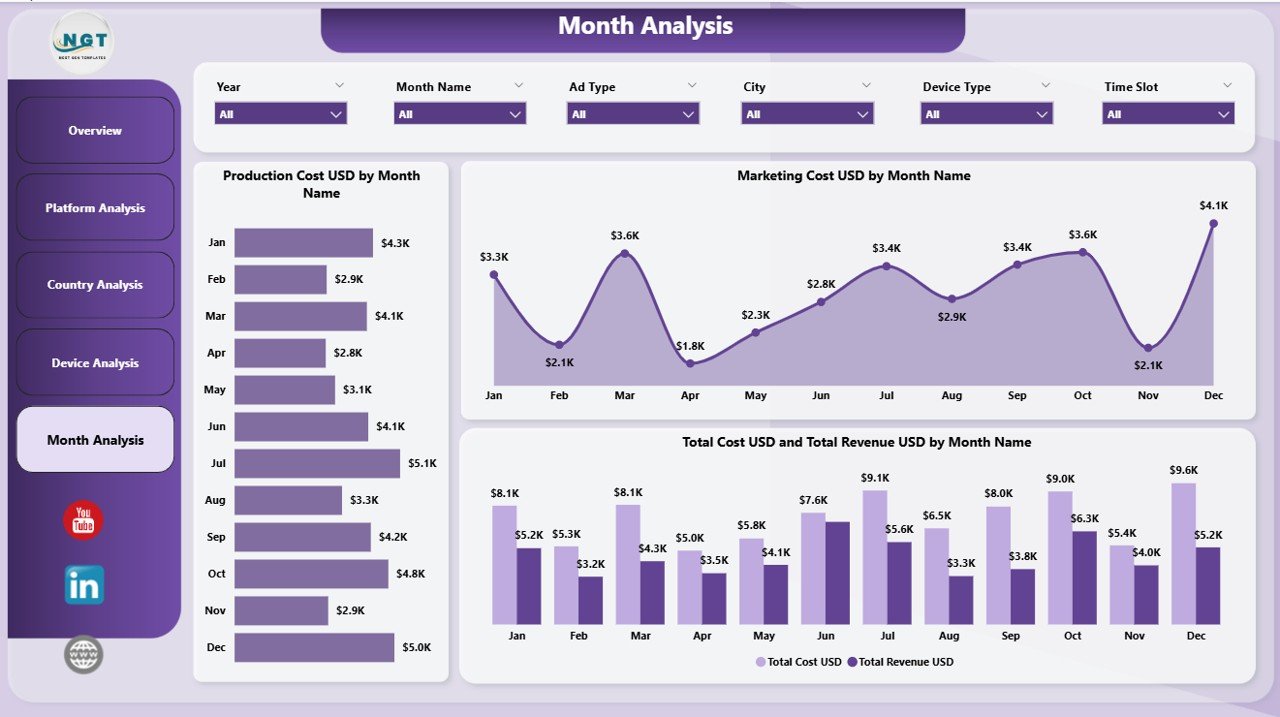
⭐ 5) Monthly Trends – Track Seasonal & Monthly Performance
This page delivers a clear, month-by-month breakdown of your financial and audience trends.
Charts Included:
-
Production Cost by Month
-
Marketing Cost by Month
-
Total Cost & Revenue by Month
It helps you track peak seasons, festival spikes, holiday slowdowns, and campaign impact.
📦 What’s Inside the Product?
-
✔ 5 fully interactive Power BI pages
-
✔ Slicers for country, platform, device, show type & month
-
✔ Real-time cards, charts & KPIs
-
✔ Complete revenue & cost comparison visuals
-
✔ Country-wise satisfaction & engagement analysis
-
✔ All data powered by a simple Excel file
-
✔ 100% customizable layout & visuals
-
✔ Beginner-friendly—no coding required
👥 Who Can Benefit From This Dashboard?
-
Radio stations (FM/AM)
-
Podcast creators & producers
-
Digital audio streaming apps
-
Media networks & content teams
-
Advertising & sponsorship teams
-
Platform managers & data analysts
-
Marketing & finance teams
-
Audio production houses
🛠 How to Use the Dashboard
-
Upload your data into the Excel file
-
Refresh the Power BI dashboard
-
Apply slicers to filter month, platform, device, country, or show type
-
Review KPIs on the Overview Page
-
Compare platforms & devices
-
Track costs vs. revenue
-
Study monthly trends before planning promotions
-
Share insights with teams for better decision-making
### Click here to read the Detailed Blog Post
📺 Visit our YouTube channel to learn step-by-step video tutorials
👉 youtube.com/@PKAnExcelExpert


Reviews
There are no reviews yet.