


Push notifications are one of the fastest and most powerful ways to engage users, drive repeat visits, and boost conversions. However, many marketing and product teams still struggle to measure push notification performance accurately. Metrics often sit across multiple tools, reports remain static, and insights arrive too late to optimize campaigns effectively.
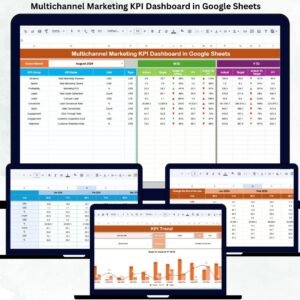
That is exactly why the Push Notification KPI Dashboard in Google Sheets becomes a must-have analytics solution.
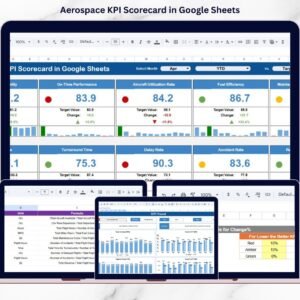
This ready-to-use dashboard converts raw push notification data into structured KPIs, clear comparisons, and actionable trends. It helps marketing teams, growth managers, CRM teams, and product owners track delivery, engagement, and performance across months—without expensive BI tools or technical complexity.
Because the dashboard is built entirely in Google Sheets, it remains easy to update, collaborative, and accessible from anywhere.

📲 Key Features of the Push Notification KPI Dashboard
📊 Centralized Performance Tracking
Monitor all push notification KPIs from a single dashboard instead of multiple tools.
🎯 Target vs Actual Comparison
Measure campaign performance against planned engagement and conversion targets.
📅 MTD & YTD Performance Visibility
Track Month-to-Date and Year-to-Date metrics effortlessly.
📈 Trend & Engagement Analysis
Identify patterns in delivery rates, open rates, and user engagement.
⚡ Auto-Updating Dashboard
All charts and KPIs refresh automatically when data changes.
📂 What’s Inside the Push Notification KPI Dashboard
The dashboard consists of 6 structured worksheet tabs, each designed to support accurate tracking and analysis.
📌 Dashboard Sheet Tab – Main Dashboard
This is the executive view where performance reviews begin.
How it works:
-
Select the month from the dropdown in cell D3
-
All KPIs update instantly
Metrics Displayed:
MTD (Month-to-Date):
-
Actual
-
Target
-
Previous Year
-
Target vs Actual
-
Previous Year vs Actual
YTD (Year-to-Date):
-
Actual
-
Target
-
Previous Year
-
Target vs Actual
-
Previous Year vs Actual
Conditional formatting with green and red arrows instantly shows improvement or decline, helping teams act quickly.
📉 KPI Trend Sheet Tab – KPI-Level Deep Dive
This sheet allows focused analysis of individual KPIs.
How it works:
-
Select a KPI from the dropdown in cell C3
Details displayed:
-
KPI Group
-
Unit of Measurement
-
KPI Type (Upper the Better / Lower the Better)
-
KPI Formula
-
KPI Definition
The month-wise trend chart highlights engagement changes, campaign impact, and optimization opportunities.
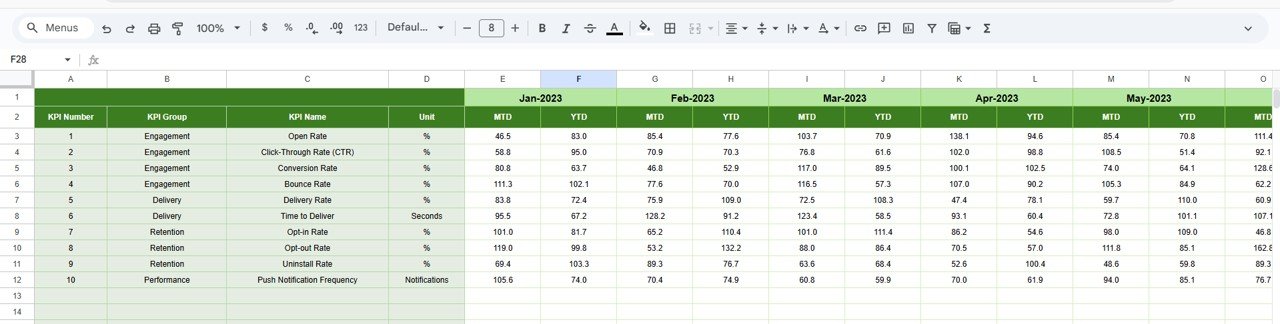
🧾 Actual Number Sheet Tab – Data Entry Sheet
This sheet captures real performance numbers.
Key functionality:
-
Select the first month of the year in cell E1
-
Enter MTD and YTD actual KPI values
-
Dashboard updates automatically
It acts as the single source of truth for campaign results.
🎯 Target Sheet Tab – Performance Goals
This sheet stores KPI targets.
Includes:
-
Monthly (MTD) targets
-
Annual (YTD) targets
Targets help teams align push notification strategies with engagement and conversion goals.
📊 Previous Year Number Sheet Tab – YoY Analysis
This sheet stores last year’s KPI data.
Benefits:
-
Year-over-year performance comparison
-
Seasonal engagement analysis
-
Benchmarking improvements
It helps teams evaluate long-term campaign effectiveness.
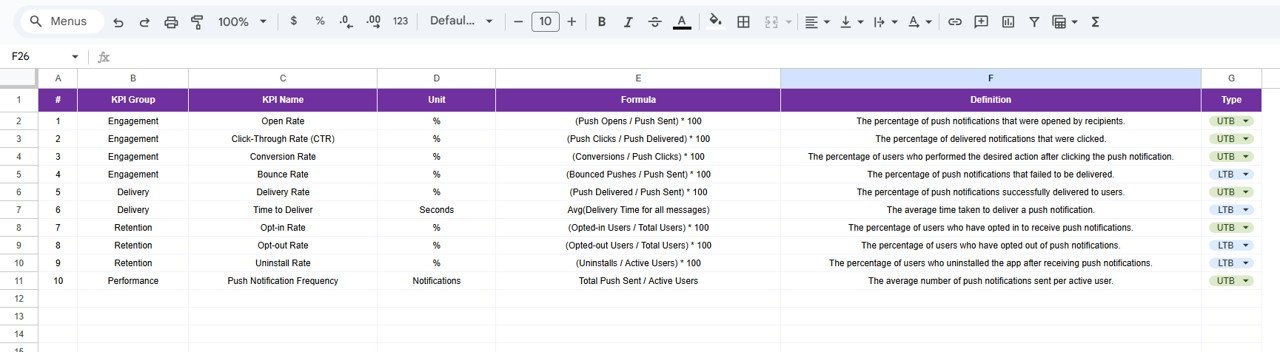
📘 KPI Definition Sheet Tab – KPI Reference Guide
This sheet ensures KPI clarity and consistency.
Includes:
-
KPI Name
-
KPI Group
-
Unit
-
Formula
-
KPI Definition
-
KPI Type (UTB / LTB)
It removes confusion and supports consistent reporting across teams.
👥 Who Can Benefit from This Push Notification KPI Dashboard
-
Digital Marketing Teams
-
Growth & Performance Marketers
-
CRM & Lifecycle Marketing Teams
-
Product Managers
-
Mobile App Marketing Teams
-
Business & Analytics Leaders
🧠 Best Practices for Using the Dashboard
-
Update push notification data regularly
-
Set realistic engagement and delivery targets
-
Monitor opt-out and engagement trends monthly
-
Use trend insights to optimize timing and frequency
-
Share dashboard insights with marketing stakeholders
### Click here to read the Detailed blog post
Watch the step-by-step video tutorial:


Reviews
There are no reviews yet.