


In today’s fast-growing urban environments, ensuring public safety requires more than manpower — it needs data intelligence. The Public Safety Dashboard in Power BI is a powerful, ready-to-use solution designed for governments, police departments, fire services, and emergency response teams to monitor incidents, measure performance, and enhance public trust.
Built on Microsoft Power BI, this dashboard consolidates data from multiple sources — such as incident logs, regional reports, and satisfaction surveys — and transforms it into actionable visual insights. With real-time tracking, interactive slicers, and automated KPIs, it empowers decision-makers to respond proactively and allocate resources efficiently.
From monitoring response rates to understanding citizen satisfaction, this dashboard helps agencies move from reactive to predictive management — ensuring faster action and greater accountability.
⚙️ Key Features of the Public Safety Dashboard in Power BI
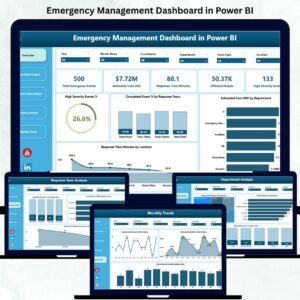
🏠 1️⃣ Overview Page – Real-Time Citywide Insights

The Overview Page acts as the command center for leaders and administrators.
-
🎚️ Slicers: Filter by Region, Department, or Time Period.
-
📈 KPI Cards: Display essential metrics like Resolved Incidents %, In-Progress Incidents %, Total Cost (USD), and Public Satisfaction.
-
📊 Charts Include:
-
Public Satisfaction by Department
-
Resolved Incident %
-
In-Progress Incident % by Region
-
Total Cost (USD) by Incident Type
-
💡 Instantly view overall public safety performance and identify trends for quick decision-making.
🧩 2️⃣ Department Analysis Page – Evaluate Team Performance
Drill down into departmental insights to measure efficiency and effectiveness.
-
Total Incidents by Department
-
Total Cost (USD) by Department
-
Resolved Incident % by Department
🏢 Identify high-performing departments, assess cost distribution, and detect areas that need operational support or training.
🔍 3️⃣ Incident Analysis Page – Deep Dive into Case Details
Understand incident types, severity, and resolution efficiency.
-
Public Satisfaction by Incident Type
-
Severity Score by Incident Type
-
Resolved Incident % by Incident Type
🔥 Pinpoint recurring issues, prioritize high-severity cases, and enhance response readiness.
🌎 4️⃣ Region Analysis Page – Compare Performance Across Areas
Visualize how different regions perform and allocate resources strategically.
-
Public Satisfaction by Region
-
Pending Incident % by Region
-
Total Cost (USD) by Region
🗺️ Discover which regions perform efficiently and where additional support is needed.
📅 5️⃣ Monthly Trends Page – Track Long-Term Improvements
Monitor performance evolution and seasonal fluctuations.
-
Resolved Incident % by Month
-
Public Satisfaction by Month
-
Total Cost (USD) by Month
📆 Spot monthly trends to forecast demand, budget requirements, and response patterns.
🌐 Why Choose Power BI for Public Safety Management?
Power BI offers unmatched advantages for public sector analytics:
✅ Real-Time Data: Instantly refresh dashboards from live databases.
✅ Cross-Department Integration: Merge police, fire, and emergency data seamlessly.
✅ Interactive Visuals: Dynamic charts with drill-throughs and slicers.
✅ Secure Collaboration: Role-based access control for sensitive information.
✅ Scalability: Works for small towns or large metro cities alike.
🚀 Advantages of the Public Safety Dashboard in Power BI
-
📊 Centralized Visibility: Unifies incident and cost data in one dashboard.
-
🕒 Faster Response: Real-time metrics enable quicker decisions.
-
💵 Cost Optimization: Detect high-cost departments or regions.
-
👥 Enhanced Accountability: Track department performance transparently.
-
💬 Citizen Trust: Measure and improve satisfaction scores effectively.
-
📈 Performance Trends: Identify recurring issues before they escalate.
👮 Who Can Benefit from This Dashboard?
-
🏙️ Municipal Governments
-
👮 Police & Fire Departments
-
🚑 Emergency Medical Services
-
🧭 Disaster Management Authorities
-
🏥 Healthcare & Public Administration Teams
✨ Ideal for any public institution striving for data-driven safety operations and greater transparency.
💡 How to Use the Dashboard
1️⃣ Import your latest incident, satisfaction, and cost data into Power BI.
2️⃣ Refresh data to update KPIs and charts automatically.
3️⃣ Use slicers to filter results by region, department, or month.
4️⃣ Review key metrics such as Resolution Rate and Public Satisfaction.
5️⃣ Share live reports via Power BI Service for real-time collaboration.
📊 Gain immediate insights for planning, budgeting, and public engagement.
🔗 Click Here to Read the Detailed Blog Post
📺 Visit Our YouTube Channel for Step-by-Step Tutorials
👉 YouTube.com/@PKAnExcelExpert


Reviews
There are no reviews yet.