Marketing without measurement is just guessing.
If your team is running campaigns, generating leads, closing sales, and spending budgets — but tracking everything in scattered spreadsheets — you’re missing the real story behind your numbers.
Which product drives the most revenue?
Which channel converts best?
Which region misses targets?
Which campaign wastes budget?
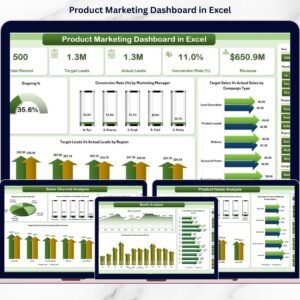
Instead of switching between multiple reports, the Product Marketing Dashboard in Excel brings everything into one powerful, interactive system.
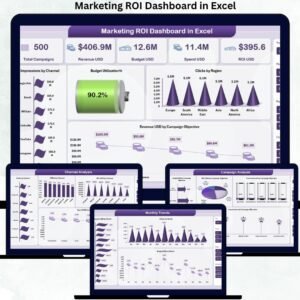
This ready-to-use dashboard helps you track Target vs Actual Sales, Target vs Actual Leads, Conversion Rate %, Revenue by Product, Revenue by Region, Revenue by Channel, and Ongoing Campaign % — all inside a single structured Excel file.
Stop reacting late. Start making smarter marketing decisions today. 🚀
🚀 Key Feature of Product Marketing Dashboard in Excel
📊 Complete 5-Page Analytical Structure
Track performance across Overview, Product, Category, Channel, and Month analysis pages.
🎯 Target vs Actual Tracking
Instantly compare sales and leads against targets to identify performance gaps.
📈 Conversion Rate Monitoring
Automatically calculate and analyze conversion rate by product, channel, and manager.
💰 Revenue Performance Analysis
Track revenue by product name, product category, sales channel, and month.
🧭 Left-Side Page Navigator
Switch between pages quickly without scrolling or confusion.
🎛 Right-Side Dynamic Slicers
Filter data by month, product, region, campaign type, or marketing manager instantly.
📉 Manager-Level Performance Tracking
Monitor campaign effectiveness by marketing manager.
⚙ Separate Data & Support Sheets
Structured backend ensures accurate calculations and stable performance.
📅 Monthly Trend Tracking
Identify seasonal spikes, growth patterns, and performance drops.
📦 What’s Inside the Product Marketing Dashboard in Excel
This dashboard includes 5 powerful analytical pages:
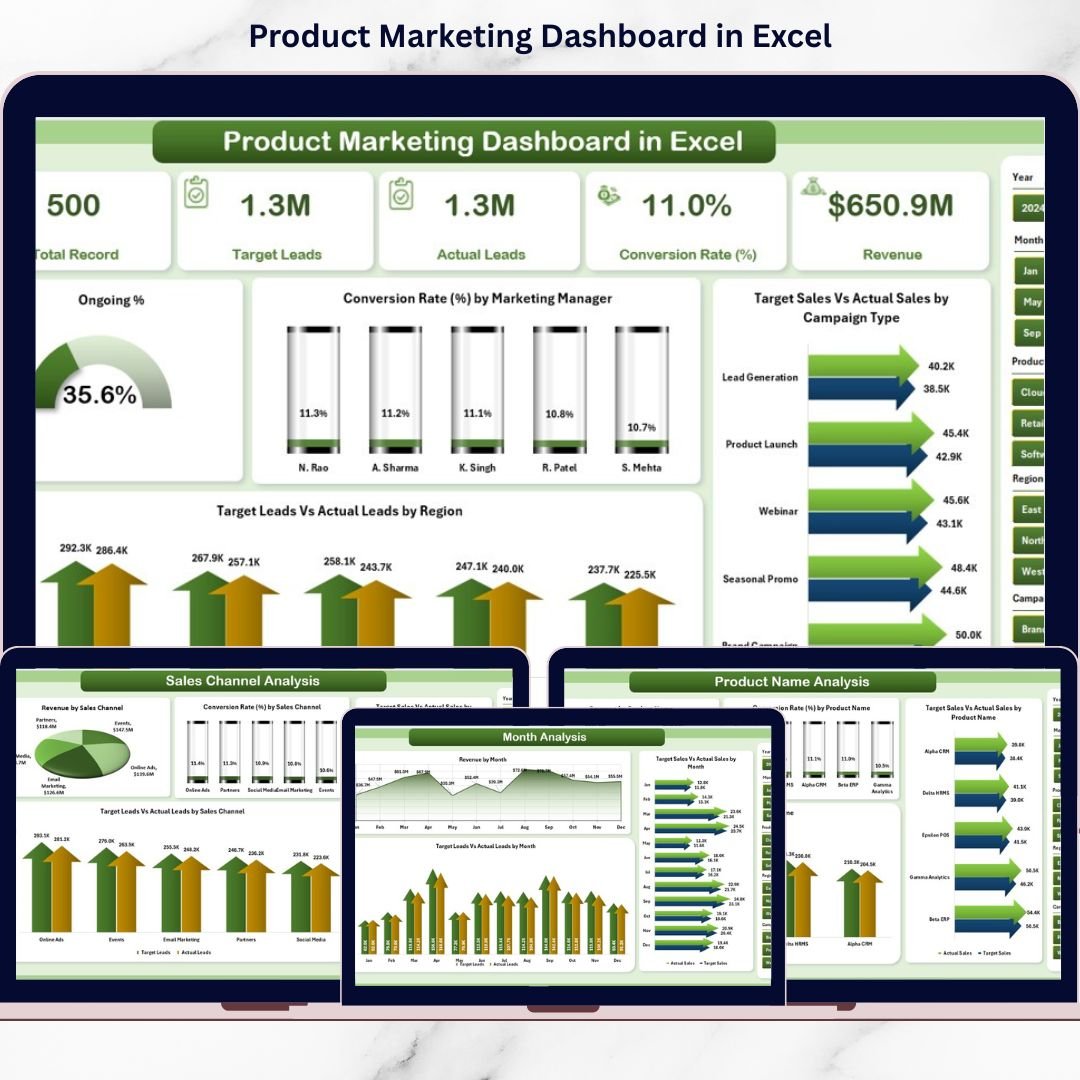
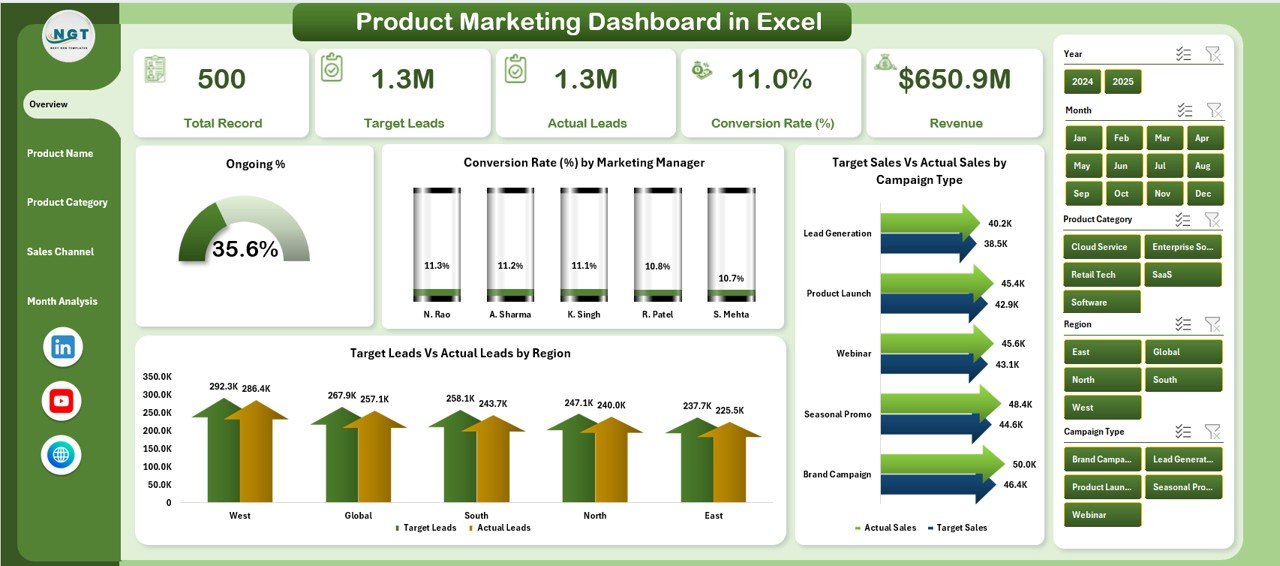
1️⃣ Overview Page
-
4 KPI Cards: Ongoing %, Conversion Rate, Target Sales vs Actual Sales, Target Leads vs Actual Leads
-
4 Charts:
-
Ongoing %
-
Conversion Rate by Marketing Manager
-
Target Sales vs Actual Sales by Campaign Type
-
Target Leads vs Actual Leads by Region
-
This page provides a high-level performance snapshot in seconds.
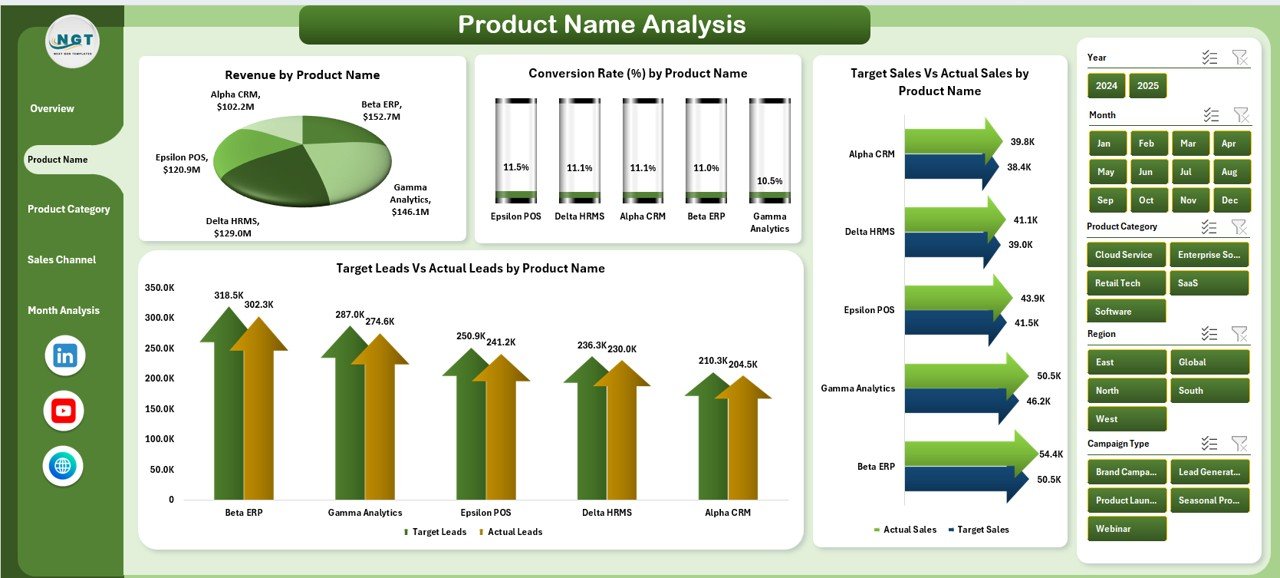
2️⃣ Product Name Analysis
-
Conversion Rate by Product
-
Target Sales vs Actual Sales by Product
-
Target Leads vs Actual Leads by Product
-
Revenue by Product
Identify top-performing and underperforming products instantly.
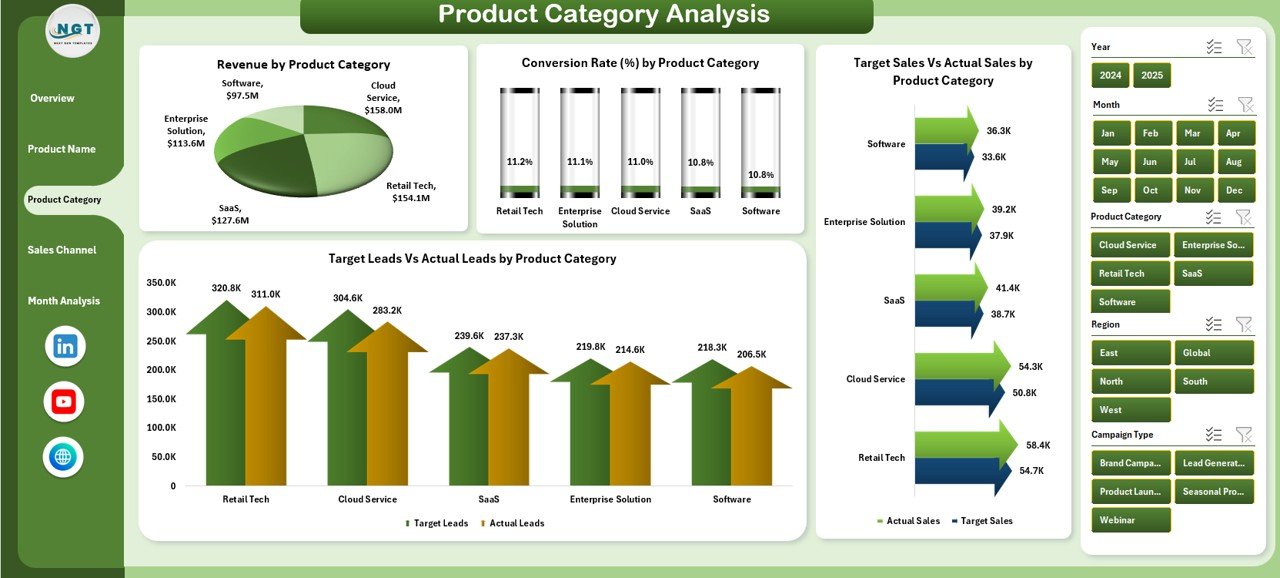
3️⃣ Product Category Analysis
-
Conversion Rate by Category
-
Target Sales vs Actual Sales by Category
-
Target Leads vs Actual Leads by Category
-
Revenue by Category
Analyze broader category-level trends for smarter pricing and promotion decisions.
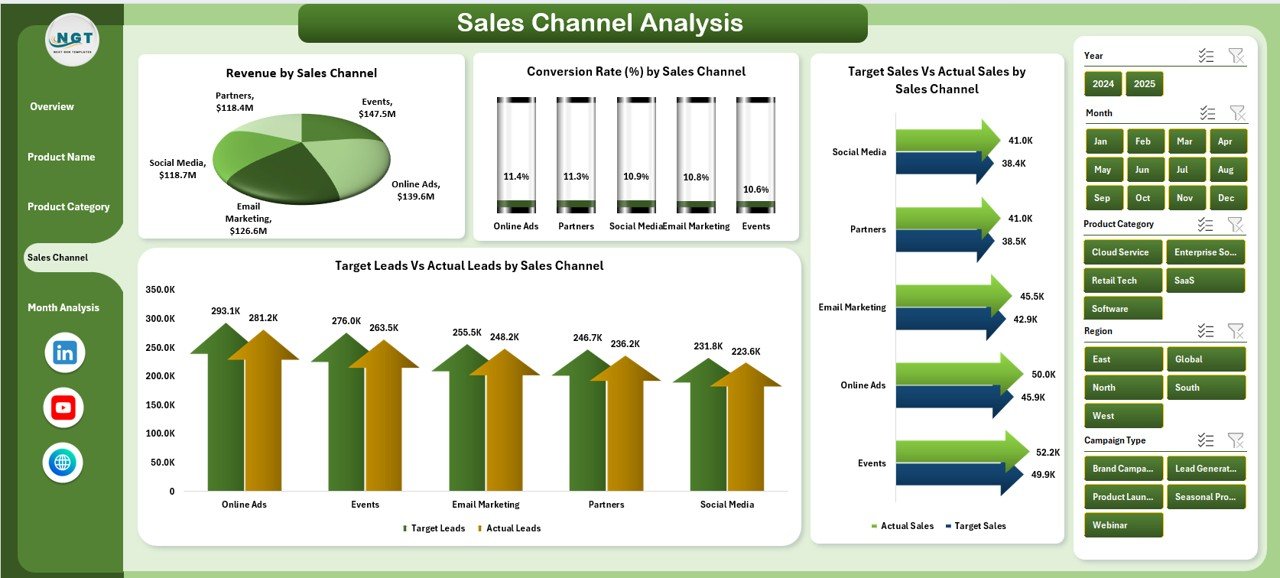
4️⃣ Sales Channel Analysis
-
Conversion Rate by Channel
-
Target Sales vs Actual Sales by Channel
-
Target Leads vs Actual Leads by Channel
-
Revenue by Channel
Allocate budget efficiently by identifying high-performing channels.
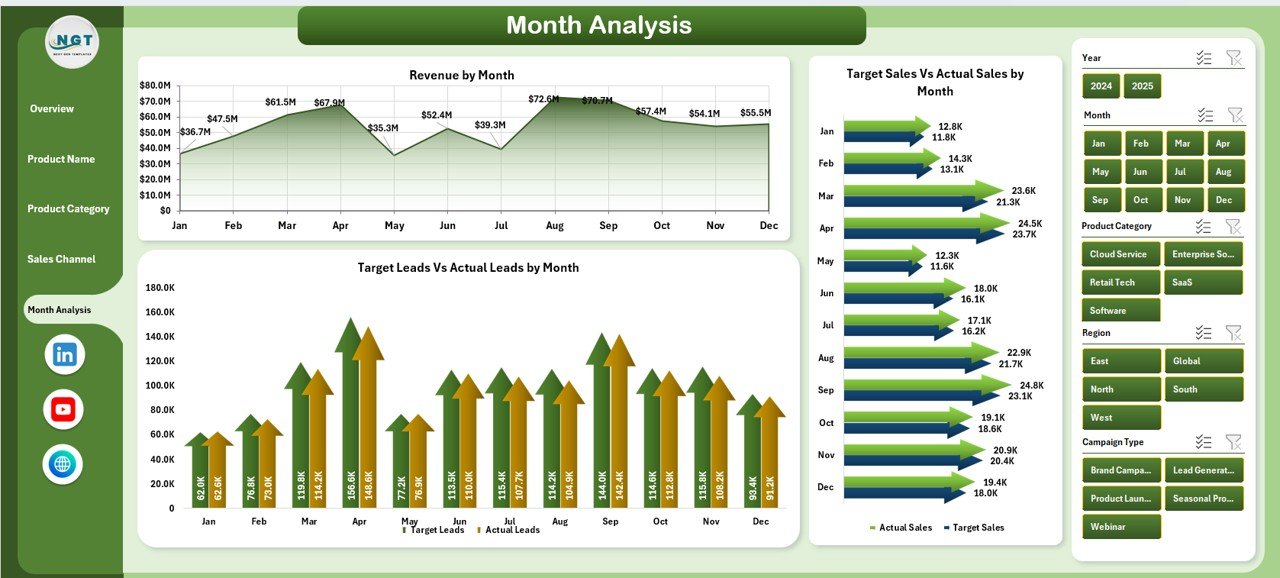
5️⃣ Month Analysis
-
Target Sales vs Actual Sales by Month
-
Target Leads vs Actual Leads by Month
-
Revenue by Month
Track growth, seasonal performance, and forecasting trends.
📌 Data Structure Included
Product Name, Product Category, Sales Channel, Campaign Type, Region, Marketing Manager, Target Sales, Actual Sales, Target Leads, Actual Leads, Revenue, Month.
🛠 How to Use the Product Marketing Dashboard in Excel
Using this dashboard is simple and practical:
1️⃣ Enter your monthly data in the structured Data Sheet
2️⃣ Review formulas in the Support Sheet (auto-calculated KPIs)
3️⃣ Refresh Pivot Tables (one click)
4️⃣ Use slicers to filter by month, product, region, or manager
5️⃣ Start with the Overview page
6️⃣ Drill down into product or channel pages
7️⃣ Take action based on insights
No coding required. No advanced Excel expertise needed. Just structured marketing intelligence.
👥 Who Can Benefit from This Product Marketing Dashboard in Excel
This dashboard is ideal for:
📊 Marketing Managers
📦 Product Managers
📈 Sales Directors
💼 Business Owners
📣 Digital Marketing Teams
📉 Campaign Analysts
Whether you run a small startup or a large enterprise, this dashboard gives you clarity, control, and confidence.
Why This Dashboard Changes the Game
When you track:
-
Conversion Rate %
-
Target Sales Achievement %
-
Target Leads Achievement %
-
Revenue by Product
-
Revenue by Channel
-
Revenue by Region
-
Ongoing Campaign %
You stop guessing and start optimizing.
You increase ROI.
You improve accountability.
You eliminate underperforming campaigns.
You scale what works.
Marketing becomes data-driven — not assumption-driven. 🔥
Click here to read the Detailed blog post
Visit our YouTube channel to learn step-by-step video tutorials
YouTube Channel