The printing and publishing industry runs on speed, precision, and cost control. Clients expect fast turnaround. Raw material prices fluctuate. Margins stay tight. And one unnoticed cost increase can silently reduce profitability.
What if you could track revenue, printing cost, profit margin %, delivery performance, client segmentation, product performance, and print technology efficiency — all inside one powerful Power BI dashboard?
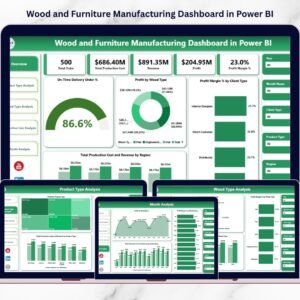
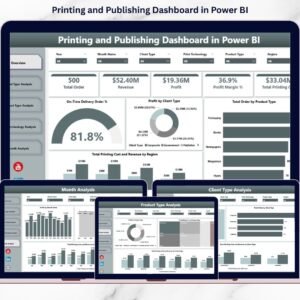
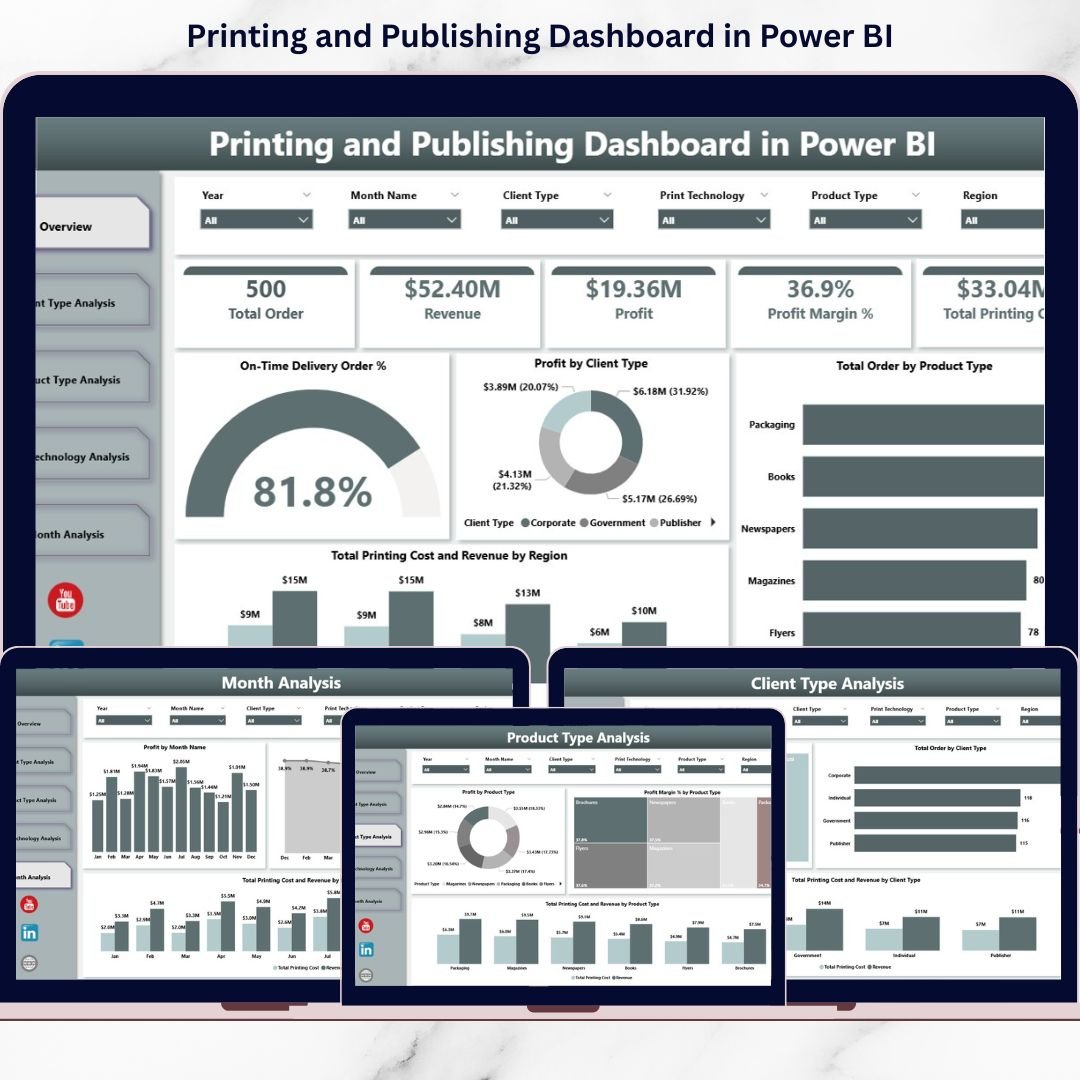
Introducing the Printing and Publishing Dashboard in Power BI — a ready-to-use, interactive reporting solution designed specifically for printing houses, publishers, and commercial printing businesses.
This dashboard transforms raw printing data into dynamic visuals and actionable insights. Instead of consolidating scattered Excel reports, you can analyze performance instantly using slicers, KPI cards, and interactive charts.
No manual calculations. No reporting chaos. Just smart, structured business intelligence.
🚀 Key Feature of Printing and Publishing Dashboard in Power BI
📊 5 Fully Interactive Pages – Overview, Client Type, Product Type, Print Technology, and Month Analysis.
🎯 Powerful KPI Cards – Instantly monitor On-Time Delivery %, Profit, Revenue, Cost, and Order performance.
📈 Profit Margin % Tracking – Measure profitability clearly across clients, products, and technologies.
🧩 Dynamic Slicers – Filter by Region, Client Type, Product Type, Print Technology, and Month.
💰 Cost vs Revenue Comparison – Detect profit leaks instantly.
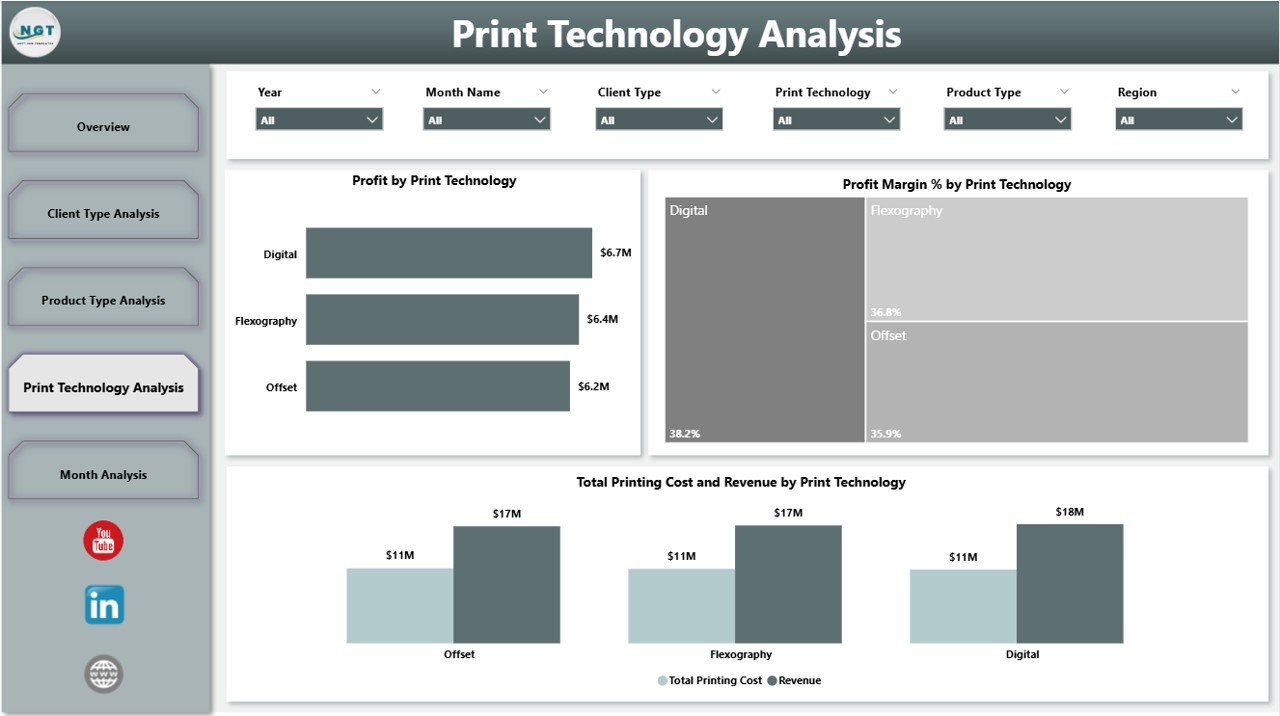
⚙️ Print Technology Efficiency Analysis – Evaluate ROI of offset, digital, flexographic, and other methods.
📆 Monthly Trend Insights – Identify seasonal demand and growth patterns.
🔄 Real-Time Visual Updates – Interactive visuals update instantly when filters change.
📦 What’s Inside the Printing and Publishing Dashboard in Power BI
This ready-to-use Power BI file includes 5 structured analytical pages:
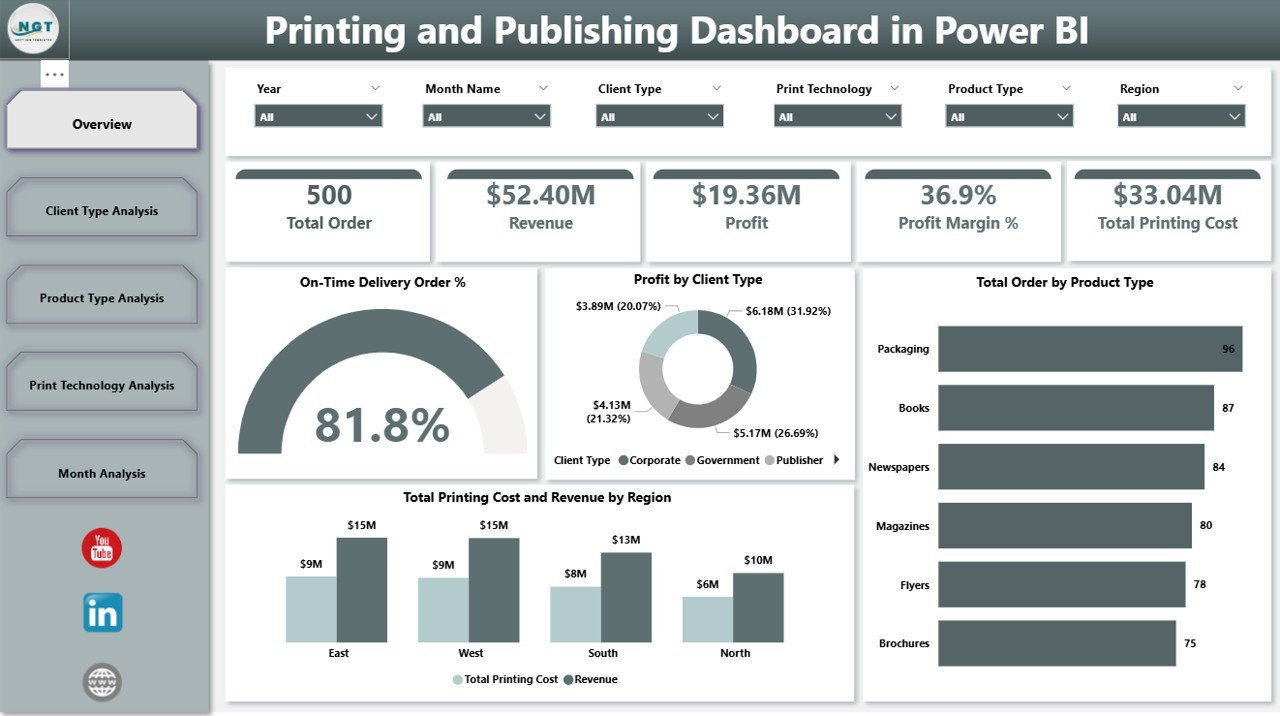
1️⃣ Overview Page – Complete Business Visibility
-
Slicers for Region, Client Type, Product Type, Print Technology, and Month
-
Key KPI Cards:
-
On-Time Delivery %
-
Profit by Client Type
-
Total Orders by Product Type
-
Total Printing Cost
-
Revenue by Region
-
This page gives leadership an instant snapshot of overall performance.
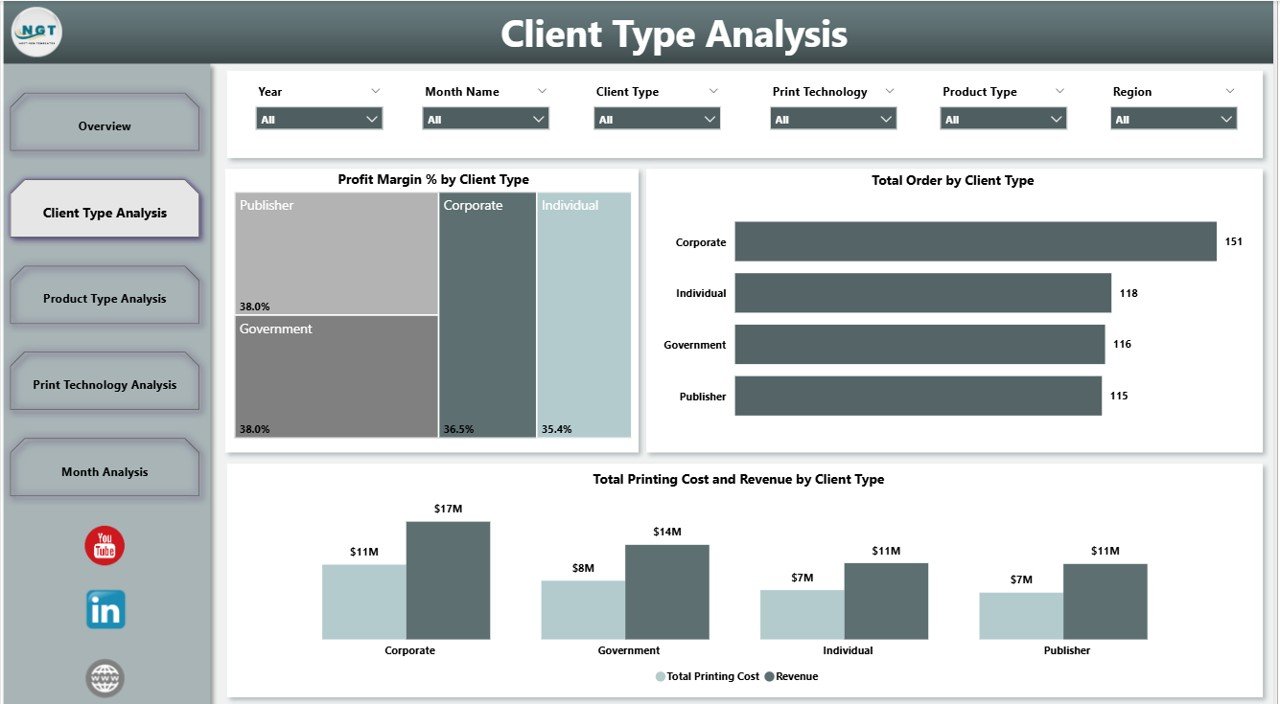
2️⃣ Client Type Analysis
-
Profit Margin % by Client Type
-
Total Orders by Client Type
-
Printing Cost vs Revenue by Client Type
Identify your most profitable customer segments and optimize pricing strategies.
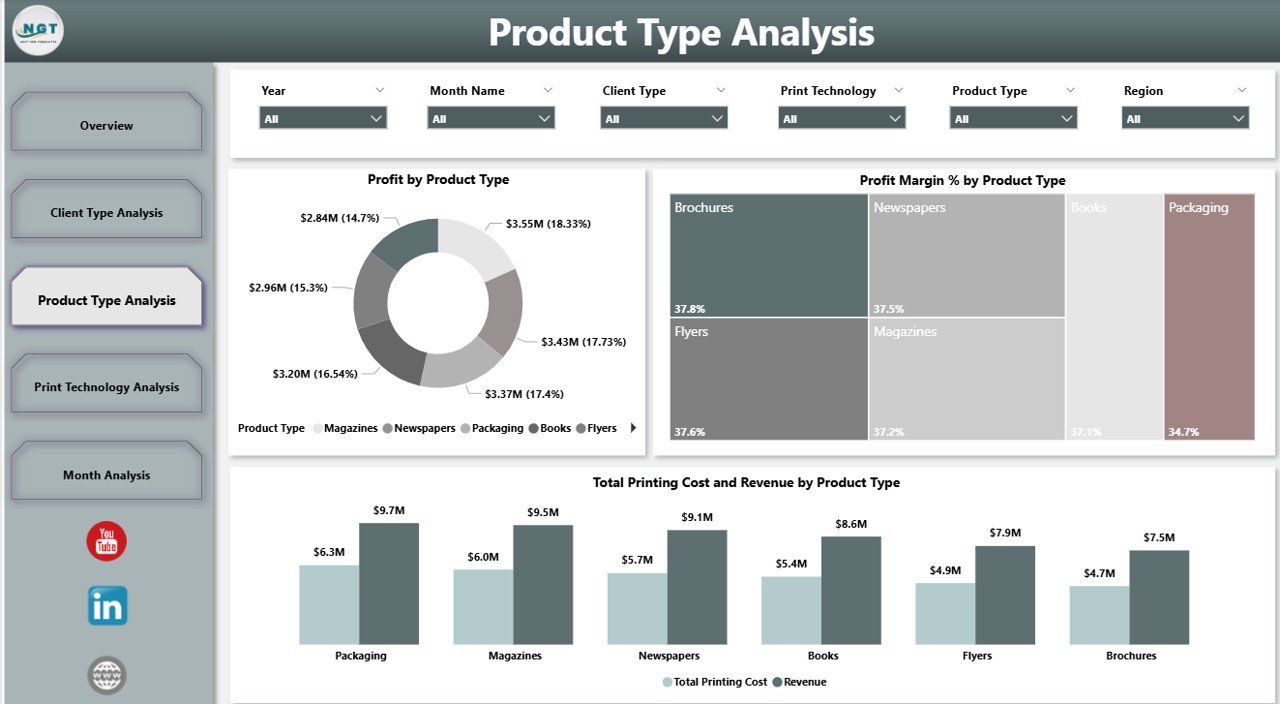
3️⃣ Product Type Analysis
-
Profit Margin % by Product Type
-
Profit by Product Type
-
Printing Cost vs Revenue by Product Type
Focus on high-margin products and eliminate low-performing lines.
4️⃣ Print Technology Analysis
-
Profit Margin % by Print Technology
-
Profit by Print Technology
-
Printing Cost vs Revenue by Technology
Make smarter investment decisions in offset, digital, flexographic, screen, or gravure printing.
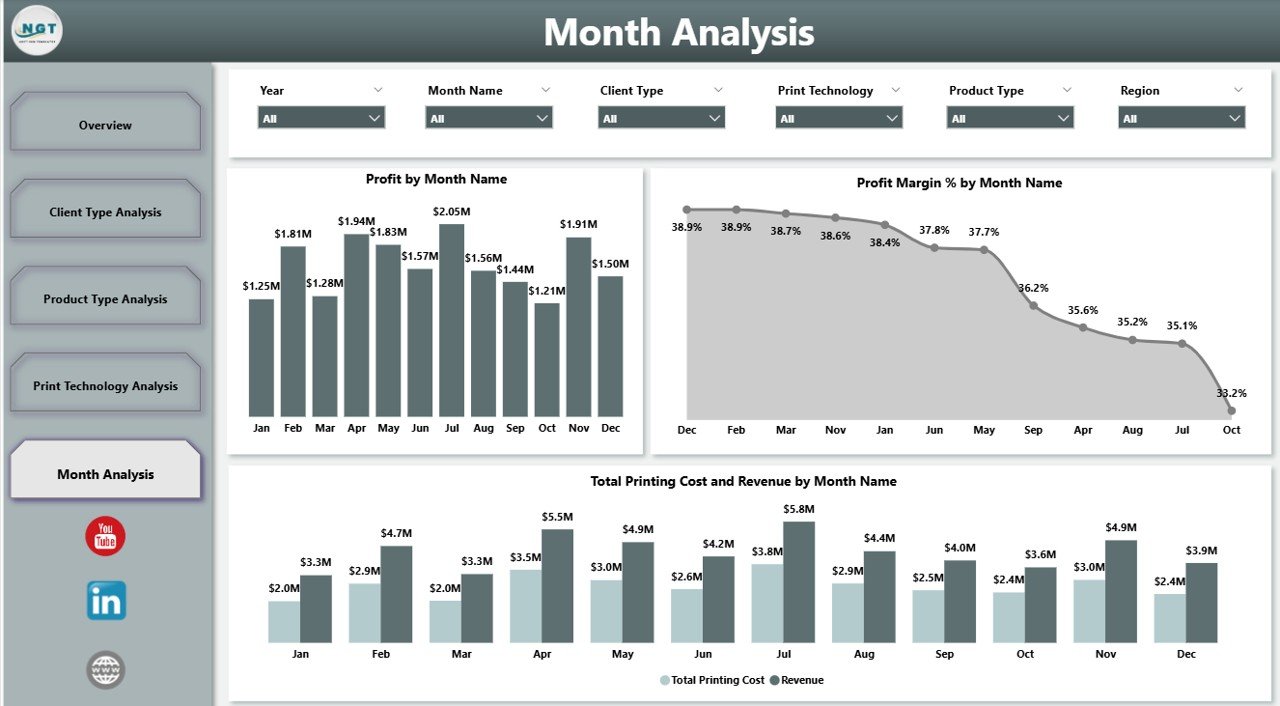
5️⃣ Month Analysis
-
Profit Margin % by Month
-
Profit by Month
-
Printing Cost vs Revenue by Month
Detect seasonal demand patterns and improve forecasting accuracy.
🛠 How to Use the Printing and Publishing Dashboard in Power BI
Using the dashboard is straightforward:
1️⃣ Import structured printing data into Power BI.
2️⃣ Ensure clean data for cost, revenue, and delivery status.
3️⃣ Refresh the dashboard regularly.
4️⃣ Use slicers to filter performance by segment.
5️⃣ Analyze KPI cards and charts for decision-making.
Because visuals update dynamically, reporting becomes fast and reliable.
👥 Who Can Benefit from This Printing and Publishing Dashboard in Power BI
✔ Printing Company Owners
✔ Publishing Houses
✔ Commercial Print Shops
✔ Packaging Printing Businesses
✔ Operations Managers
✔ Finance Managers
✔ Sales & Strategy Teams
Whether you manage a small printing unit or a multi-location publishing business, this dashboard helps you track performance professionally.
Why This Dashboard Can Transform Your Printing Business
Instead of guessing which client segment generates profit, you see exact margin percentages.
Instead of manually comparing cost and revenue, you view them side by side instantly.
Instead of reacting to slow months, you detect trends early.
From books and magazines to packaging and business cards — every product line becomes measurable. Every technology investment becomes accountable. Every region becomes analyzable.
If you want stronger margins, faster decisions, improved operational efficiency, and sustainable growth, this dashboard gives you the competitive edge.
Click here to read the Detailed blog post
Visit our YouTube channel to learn step-by-step video tutorials
👉 YouTube Channel – PKAnExcelExpert