


Managing school performance has never been easier! The Primary Schools Dashboard in Excel is a ready-to-use, data-driven solution that helps educators, principals, and administrators visualize academic and financial metrics in a single, interactive file. 📊✨
Built entirely in Microsoft Excel, this dashboard transforms raw school data into clear visuals and KPIs—letting you track teacher ratings, student engagement, exam results, and fee collections without needing complex software or coding skills.
Whether you oversee one institution or multiple branches, this dashboard simplifies performance monitoring, boosts transparency, and supports data-based decision-making at every level of school management.
🌟 Key Features of the Primary Schools Dashboard
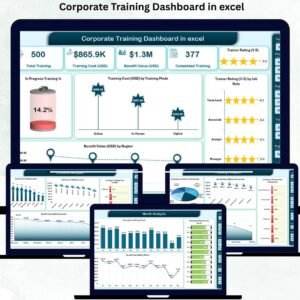
📋 1️⃣ Overview Page – Centralized Performance Summary

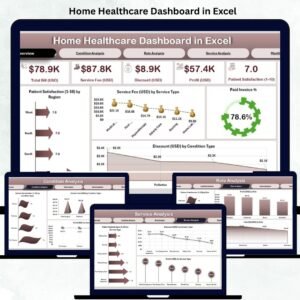
Gain instant insights into your school’s performance through KPIs and charts.
Highlights include:
-
5 KPI Cards summarizing overall school health.
-
4 Dynamic Charts:
-
📍 Teacher Rating (1–5) by Region
-
🎓 Student Scholarship Percentage
-
🧩 Student Engagement (1–10) by Exam Type
-
💰 Fee Paid vs Fee Due (USD) by School Name
🧠 Purpose: Instantly evaluate teaching quality, student engagement, and financial performance across locations.
-
🏫 2️⃣ School Analysis Page – Compare School Types
Understand performance variations between public, private, or charter schools.
Charts Displayed:
-
👩🏫 Teacher Rating (1–5) by School Type
-
💵 Fee Paid vs Fee Due (USD) by School Type
-
🎯 Student Engagement (1–10) by School Type
📈 Benefit: Identify strengths and weaknesses among school categories to guide improvement strategies.
📘 3️⃣ Subject Taught Analysis Page – Academic Insights
Analyze subject-wise trends in student performance and engagement.
Visuals Include:
-
🧑🏫 Teacher Rating (1–5) by Subject Type
-
🧮 Marks Scored by Subject Taught
-
💡 Student Engagement (1–10) by Subject Taught
🎓 Outcome: Detect high-interest subjects, monitor teaching impact, and plan remedial measures early.
🧾 4️⃣ Exam Analysis Page – Academic & Financial Performance
Get a holistic view of exam results, engagement, and parent satisfaction.
Charts Displayed:
-
Teacher Rating (1–5) by Exam Type
-
Marks Scored by Subject
-
Student Engagement (1–10) by Exam Type
-
Fee Paid vs Fee Due by Exam Type
-
Parent Satisfaction (1–10) by Exam Type
💬 Purpose: Connect academic outcomes with financial compliance and parental feedback.
📅 5️⃣ Month Analysis Page – Performance Over Time
Monitor how performance evolves each month.
Charts Included:
-
Student Engagement (1–10) by Month
-
Fee Paid vs Fee Due by Month
-
Teacher Rating (1–5) by Month
📆 Insight: Detect seasonal dips in engagement or payments and plan interventions proactively.
⚙️ 6️⃣ Support Sheet & Data Sheet – Organized Back-End
-
Data Sheet: Stores all raw inputs (teachers, exams, fees, students).
-
Support Sheet: Handles lists, dropdowns, and calculation logic.
💡 Both sheets ensure smooth automation and quick updates.
💼 Advantages of Using the Primary Schools Dashboard
✅ Centralized Data – All academic & financial information in one file.
✅ Easy to Use – No coding, just input and refresh.
✅ Smart Analytics – Interactive charts & slicers for instant insights.
✅ Saves Time – Automated formulas cut manual reporting.
✅ Customizable – Add new KPIs like Attendance % or Homework Rate.
✅ Transparent Reports – Ideal for school boards and PTA meetings.
🧠 Who Can Use This Dashboard
-
🧑🏫 Teachers – Track student progress and engagement.
-
🏫 Principals – Compare departments and school types.
-
🧮 Administrators – Monitor KPIs and fee trends.
-
👨👩👧 Parents – Review satisfaction and transparency metrics.
-
🧑💼 Education Boards – Evaluate school effectiveness regionally.
🧭 How to Use the Dashboard
1️⃣ Enter Data → Fill the Data Sheet with latest records.
2️⃣ Refresh All → Update charts and calculations instantly.
3️⃣ Navigate Pages → Switch using the left Page Navigator.
4️⃣ Apply Filters → Use slicers to focus on specific months or regions.
5️⃣ Review Insights → Spot trends and take data-driven actions.
💡 Best Practices
-
Keep data updated monthly.
-
Use consistent naming for schools and subjects.
-
Backup files before major edits.
-
Add conditional formatting for top performers.
-
Use charts in parent and board meetings.
🧩 Why Excel for School Analytics
💻 Works offline and requires no subscription.
🧠 Supports pivots, charts, and automation.
📂 Compatible with CSV & Google Sheets.
⚙️ Easy to customize for any school system.
💰 Cost-effective for education institutes of any size.
🧮 Real-World Applications
-
Track student achievement & teacher ratings.
-
Compare branches and grade performance.
-
Monitor fee collections and scholarships.
-
Share visual reports in parent-teacher meetings.
-
Plan policies based on real-time academic data.
### Click here to read the Detailed blog post
Visit our YouTube channel for step-by-step tutorials


Reviews
There are no reviews yet.