Running a preschool is about more than managing classrooms—it’s about ensuring student growth, teacher performance, and parent satisfaction are always moving in the right direction. With multiple KPIs to monitor, manual reports or static spreadsheets can quickly become overwhelming. That’s why we created the Preschool KPI Dashboard in Power BI—a powerful, ready-to-use solution that turns data into clear, actionable insights.
Built on Power BI and powered by a simple Excel backend, this dashboard helps administrators and teachers track performance in real time. Whether it’s student attendance, curriculum delivery, or parent engagement, this tool ensures you always know where your preschool stands.
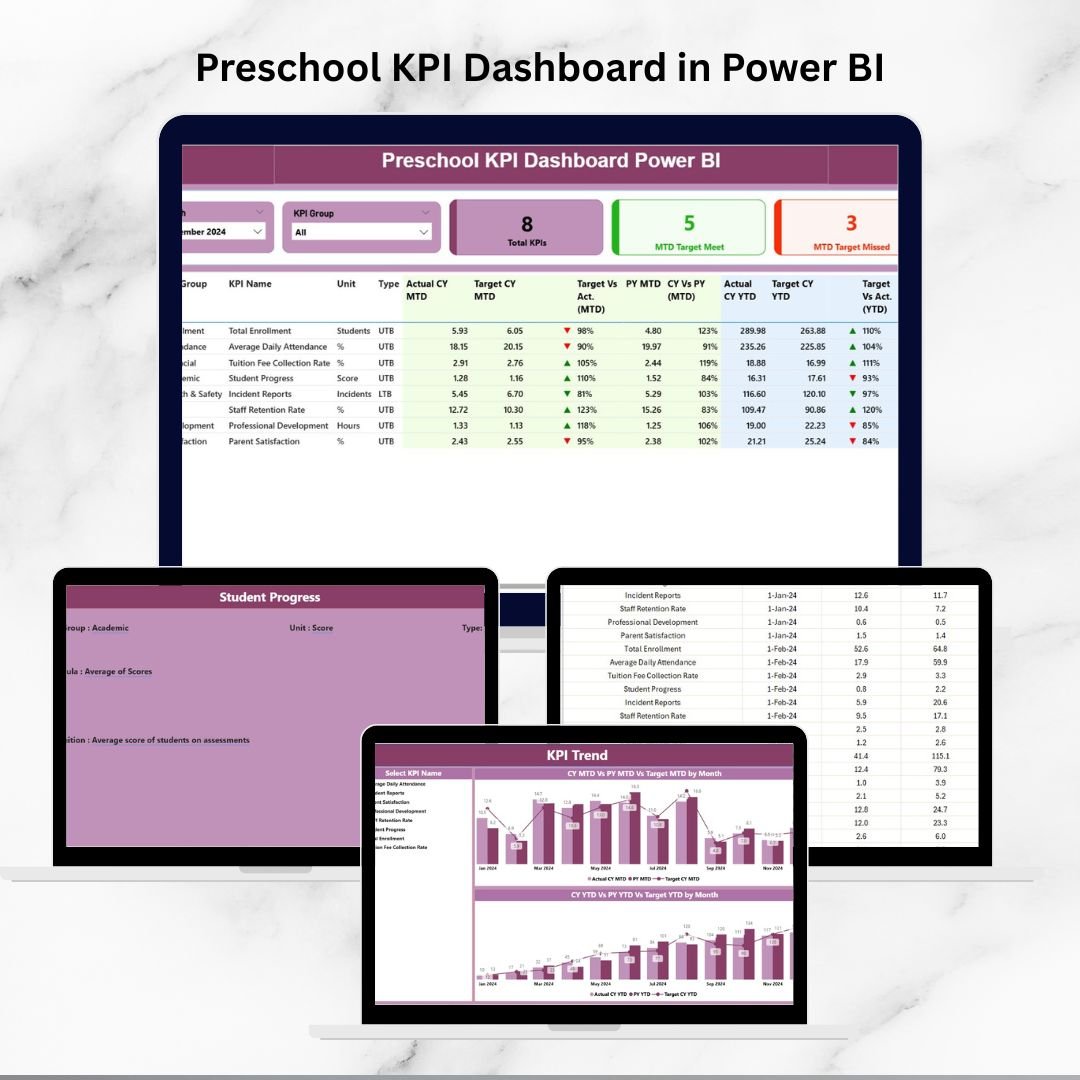
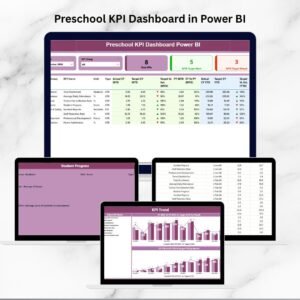
✨ Key Features of Preschool KPI Dashboard in Power BI
-
📊 3 Smart Pages – Summary, KPI Trend, and KPI Definition pages for a complete 360° view.
-
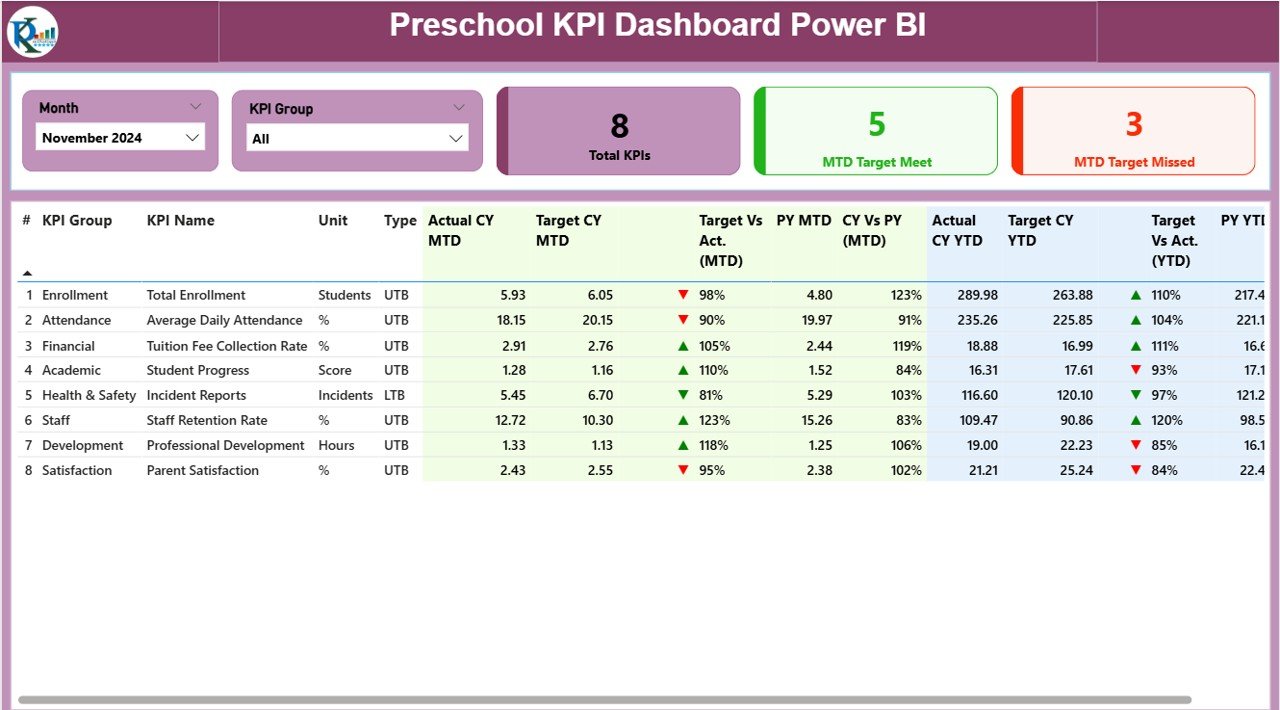
🎯 Target vs Actual Tracking – Compare Month-to-Date (MTD) and Year-to-Date (YTD) progress against set benchmarks.
-
📈 Visual Performance Icons – Green ▲ for success, Red ▼ for gaps—instantly understand results.
-
🗂 Excel-Driven Data – Easy-to-update backend with Input_Actual, Input_Target, and KPI Definition sheets.
-
⚡ Interactive Slicers – Filter by Month or KPI Group for quick comparisons.
-
🔍 KPI Drill-Through – View formulas and definitions to keep everyone aligned.
-
🛠 Customizable – Add or adjust KPIs to match your preschool’s unique needs.
-
💰 Cost-Effective – Built in Power BI and Excel, no expensive software required.
📂 What’s Inside the Preschool KPI Dashboard
-
Summary Page – Central hub with slicers, KPI cards, and detailed tables showing MTD & YTD actuals vs targets.
-
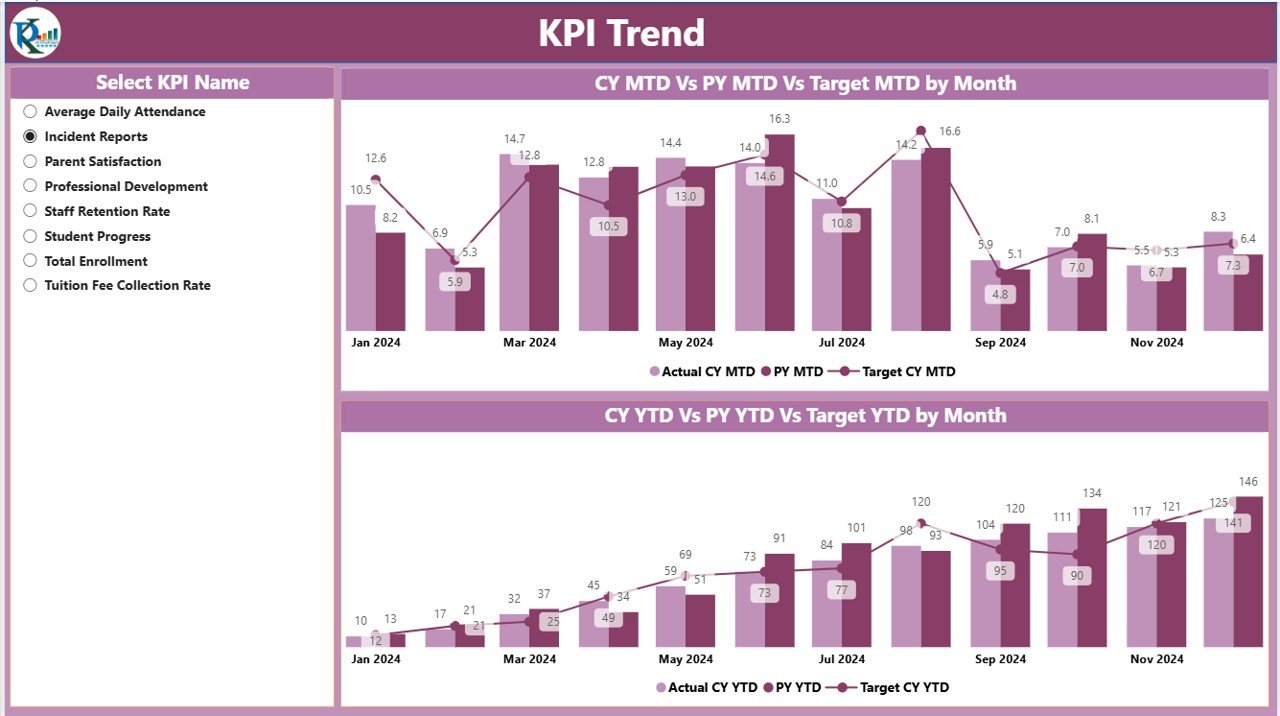
KPI Trend Page – Combo charts for MTD and YTD comparisons across Actual, Target, and Previous Year.
-
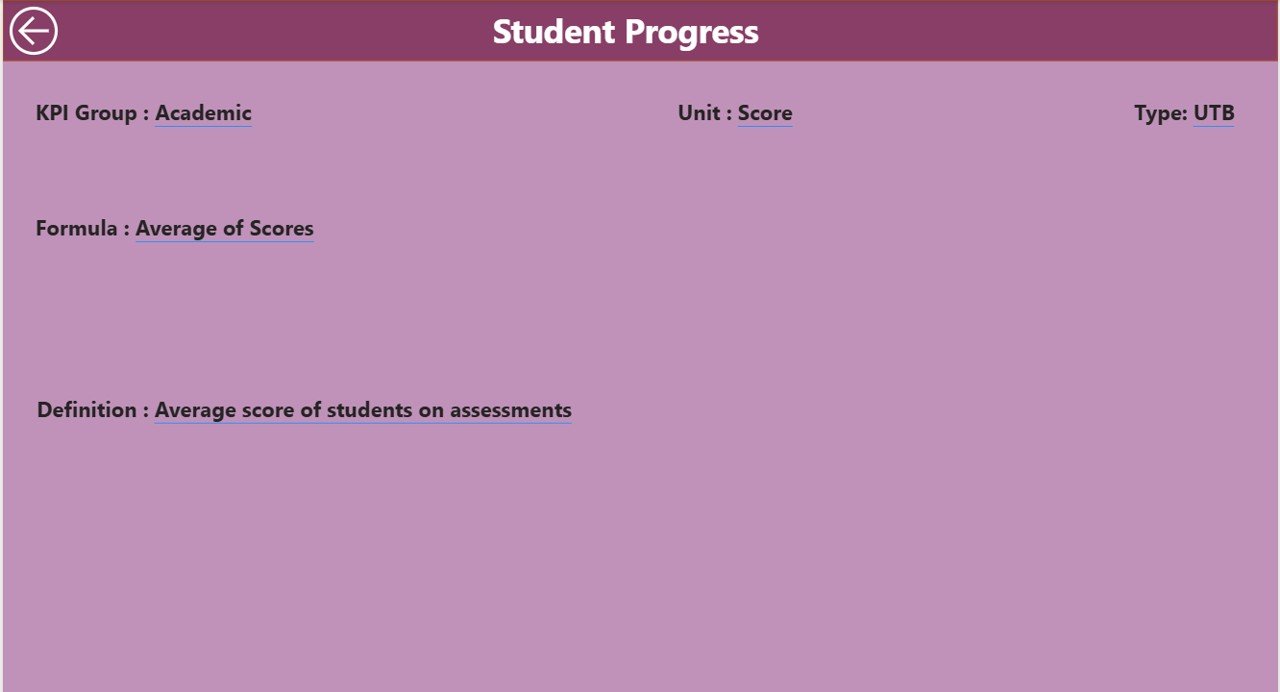
KPI Definition Page – Hidden drill-through page with KPI formulas and definitions, ensuring consistent understanding.
-
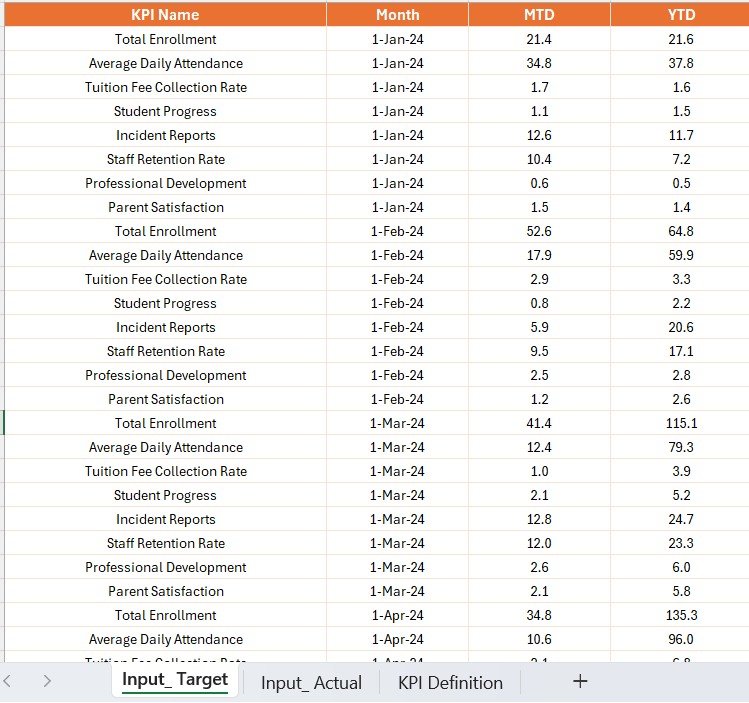
Excel Backend –
-
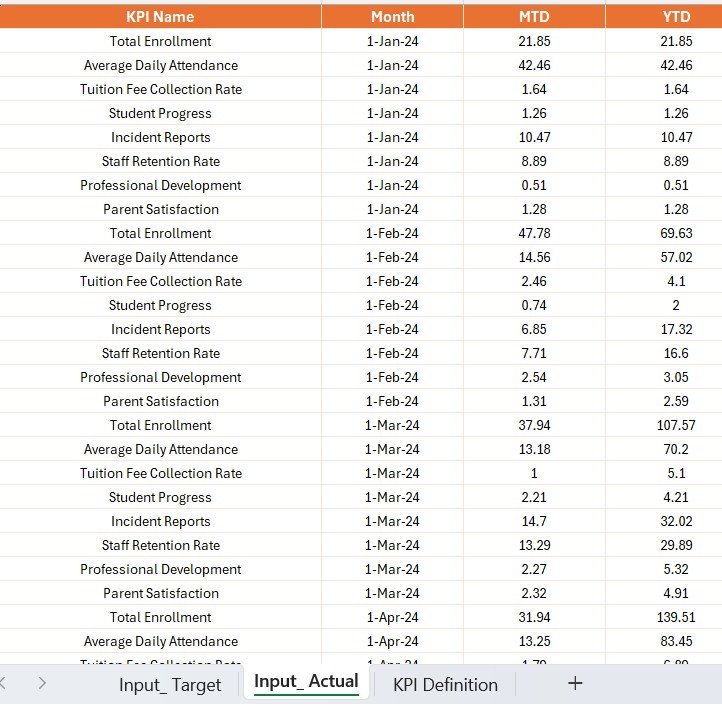
Input_Actual: Capture performance data monthly.
-
Input_Target: Define your benchmarks.
-
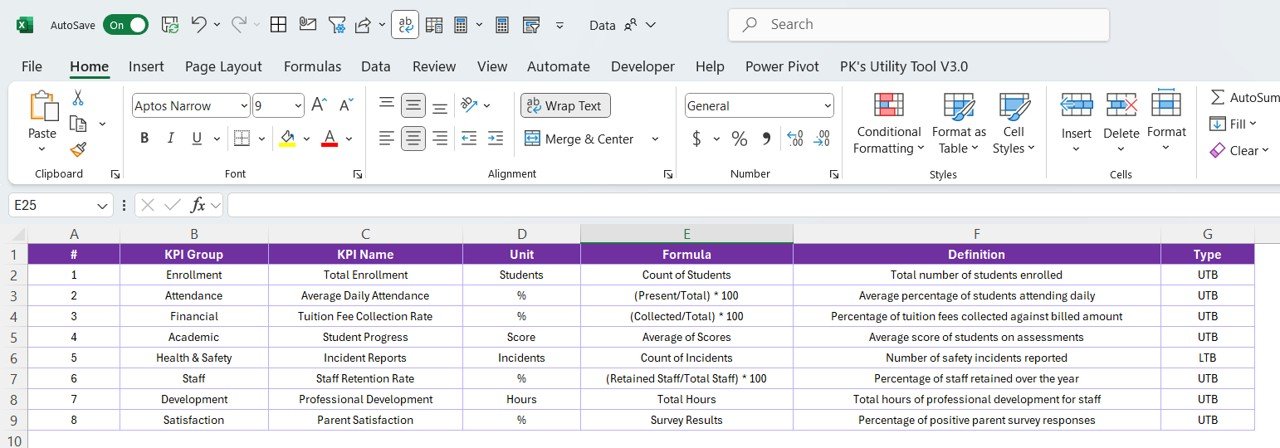
KPI Definition: Structured KPI catalog with number, group, formula, and type.
-
📖 How to Use the Preschool KPI Dashboard
-
Prepare Your Data – Input actual and target values in the Excel sheets.
-
Connect to Power BI – Load the Excel file into Power BI.
-
Review Performance – Use the Summary page for high-level analysis.
-
Drill Into Trends – Explore the KPI Trend page for deeper monthly or yearly insights.
-
Standardize KPIs – Use the Definition page to align teachers, staff, and administrators.
👥 Who Can Benefit from This Dashboard?
-
👩🏫 Preschool Administrators – Monitor operations and improve accountability.
-
🧑🏫 Teachers – Track class attendance, curriculum progress, and feedback.
-
👨👩👧 Parents – Gain transparent updates on their child’s learning journey.
-
🏫 School Management Teams – Ensure consistent improvement across staff and students.
With this dashboard, your preschool can balance educational excellence with efficient management.


Reviews
There are no reviews yet.