Running a plastics manufacturing unit without real-time KPI visibility often leads to higher scrap, missed targets, rising costs, and slow decisions. Machines behave differently every day, quality fluctuates, material usage varies, and manual reports fail to keep up.
That is exactly why the Plastics Manufacturing KPI Dashboard in Excel becomes a game-changer.
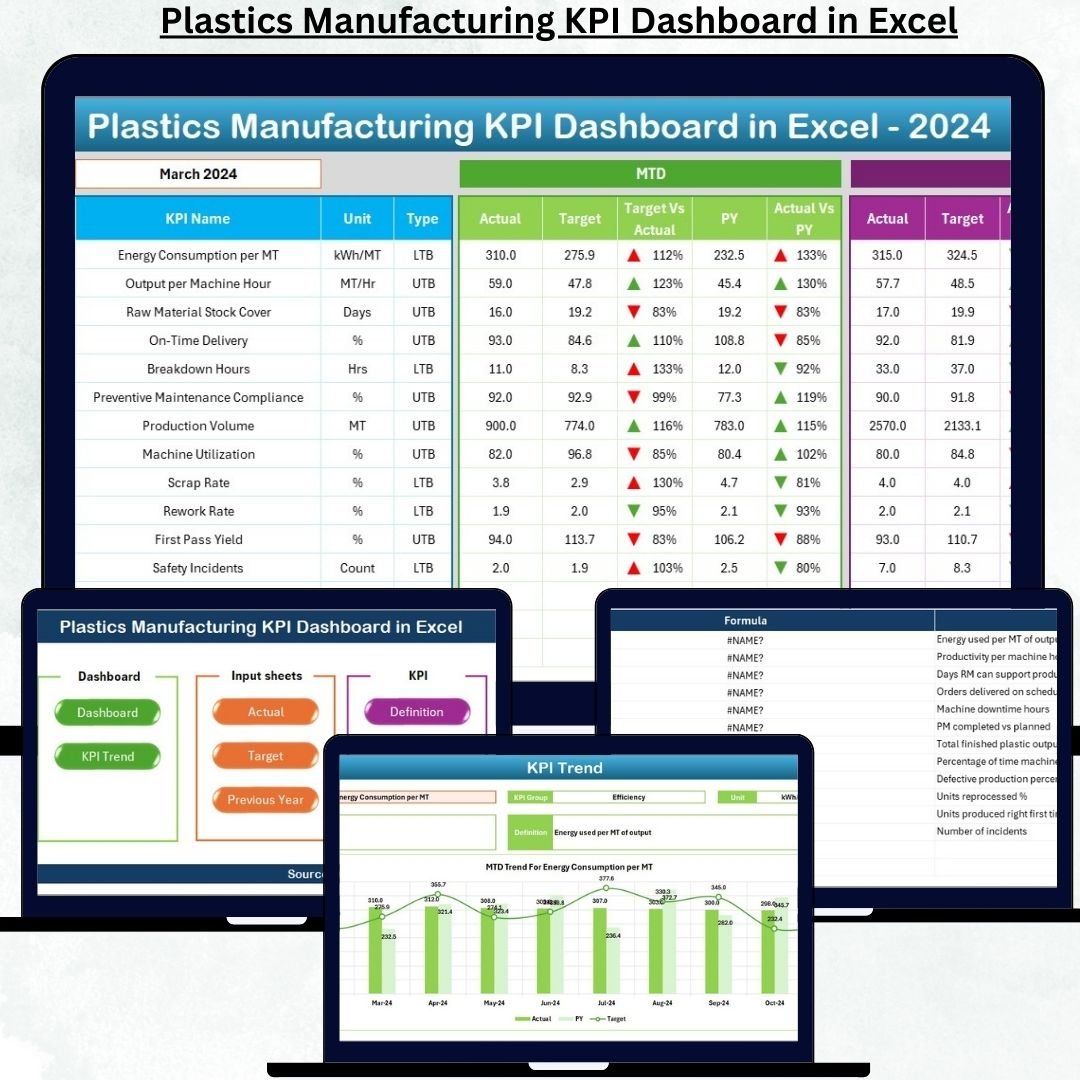
This ready-to-use Excel dashboard converts your raw production data into clear KPIs, trend insights, and performance comparisons—all inside Excel. No Power BI. No coding. No complex tools. Just pure, actionable performance intelligence designed for plastics manufacturers.
Whether you manage injection molding, extrusion, blow molding, or thermoforming operations, this dashboard gives you a complete performance cockpit to monitor MTD, YTD, targets, and year-over-year comparisons in one place.
🚀 Key Features of Plastics Manufacturing KPI Dashboard in Excel
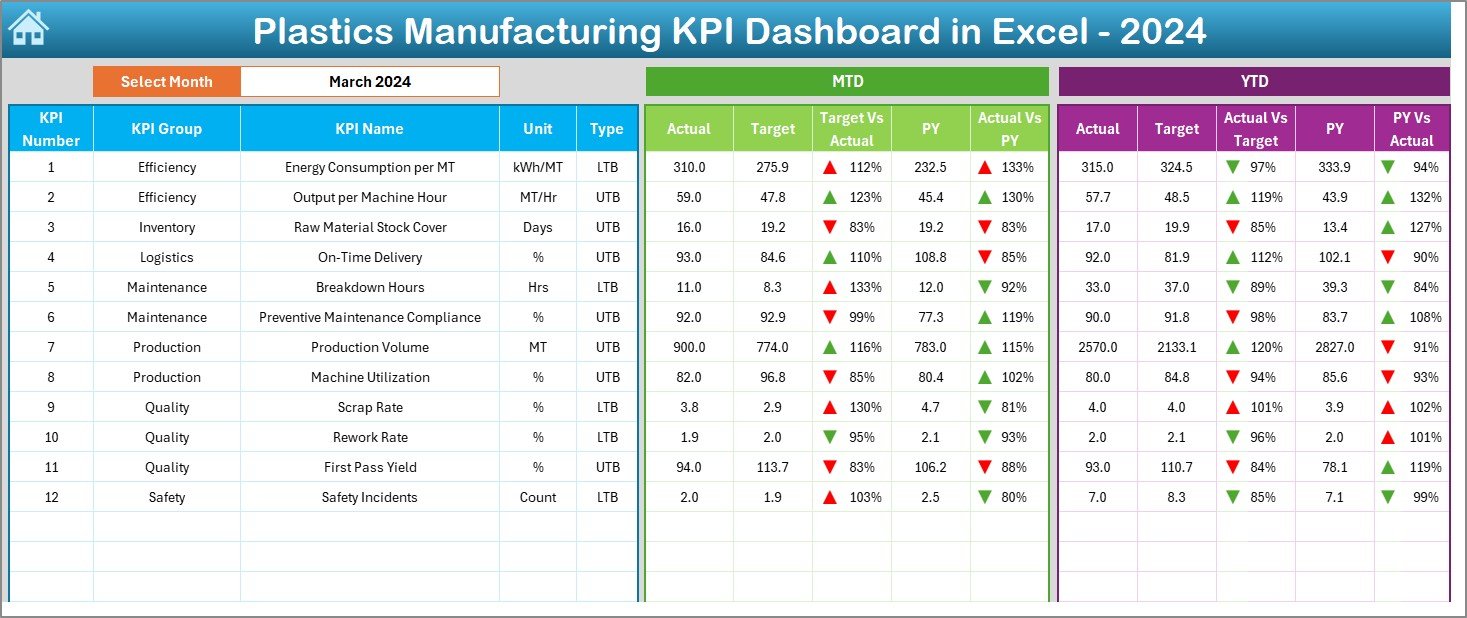
✅ Dynamic Month Selection – Instantly switch months using a dropdown and watch the entire dashboard update automatically.
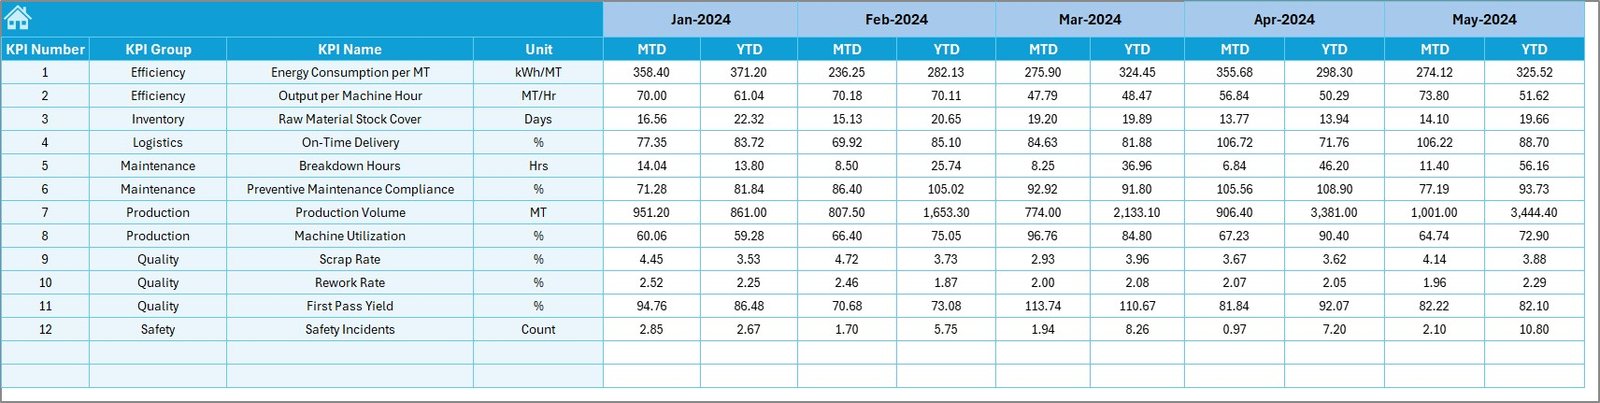
✅ MTD & YTD Performance Tracking – Monitor current month and year-to-date KPIs side by side for better control.
✅ Target vs Actual Analysis – Identify gaps instantly using automated comparisons and visual indicators.
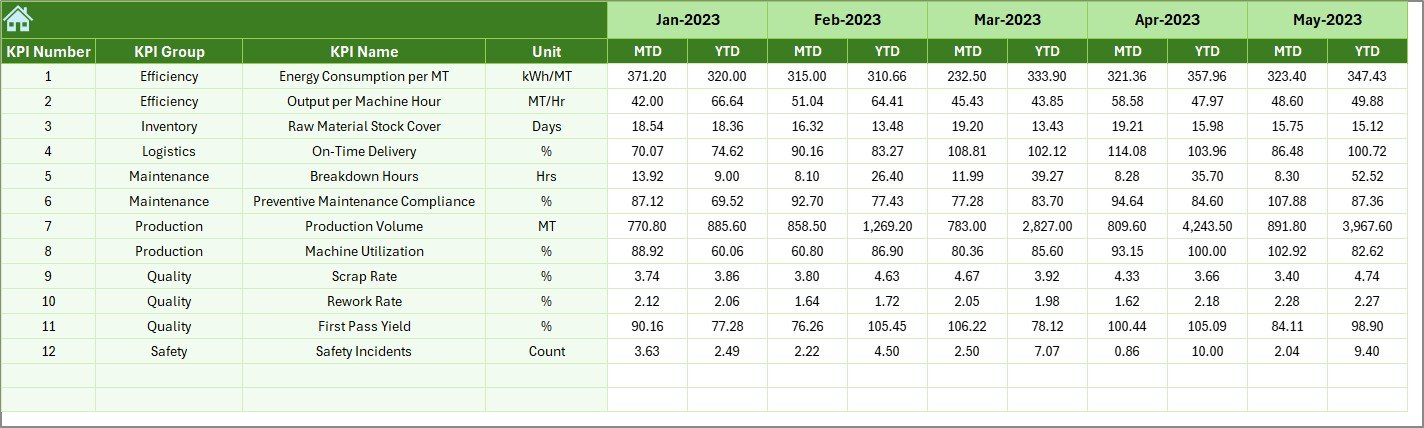
✅ Previous Year Comparison – Measure improvements or declines against last year’s performance.
✅ Conditional Formatting Alerts – Up/down arrows highlight performance risks and achievements visually.
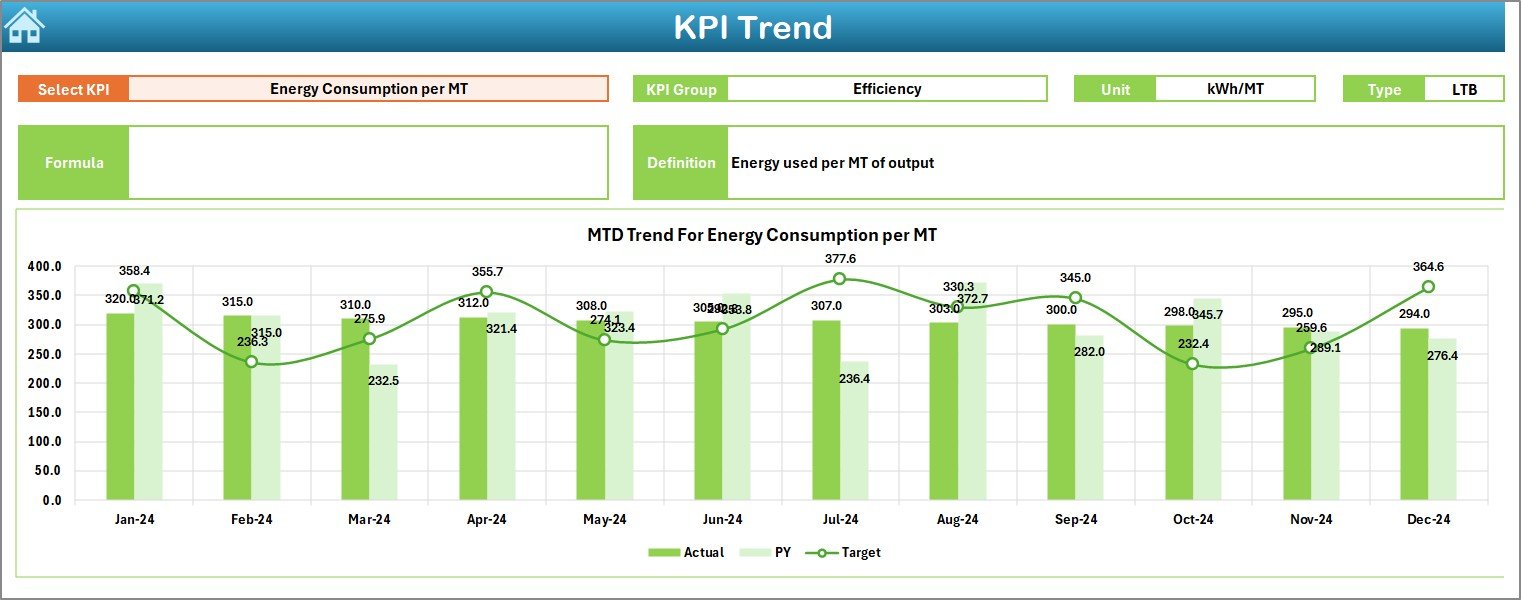
✅ Built-in Trend Analysis – Understand KPI movement over time with MTD and YTD trend charts.
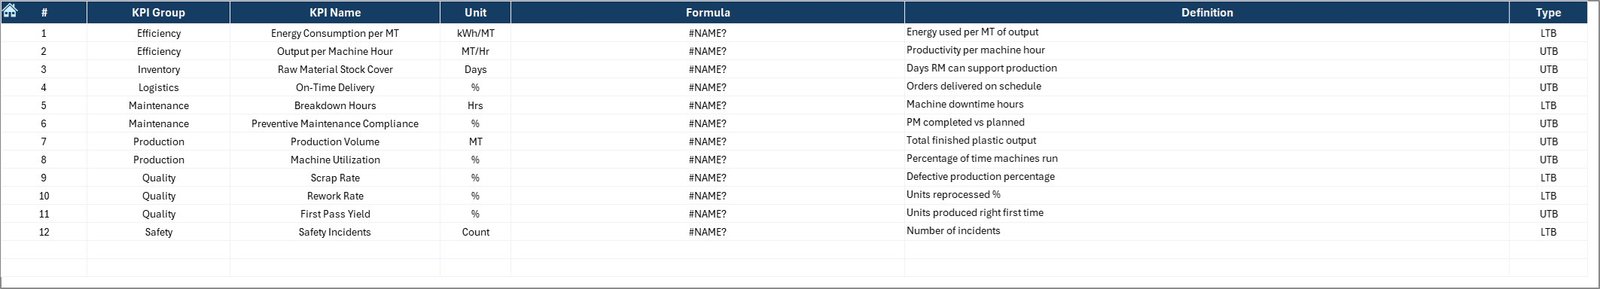
✅ Standard KPI Definitions – Avoid confusion with a centralized KPI definition library.
📦 What’s Inside the Plastics Manufacturing KPI Dashboard in Excel
This digital product includes 7 professionally structured Excel worksheets, each designed for a specific purpose:
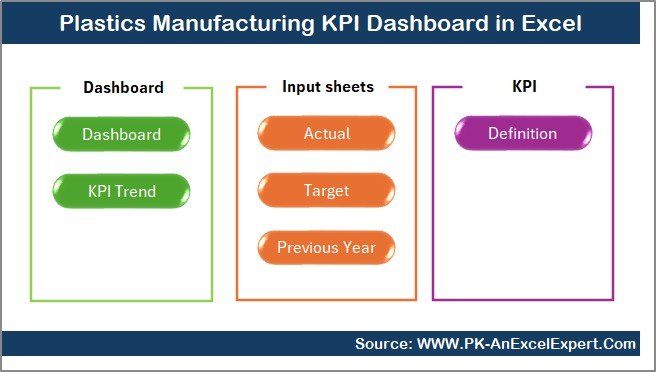
📊 Summary Page – Navigation hub with one-click buttons to move across all sections.
📊 Dashboard Sheet – Central performance view showing all core KPIs with MTD, YTD, targets, and comparisons.
📈 Trend Analysis Sheet – KPI-wise monthly trends with charts and KPI details.
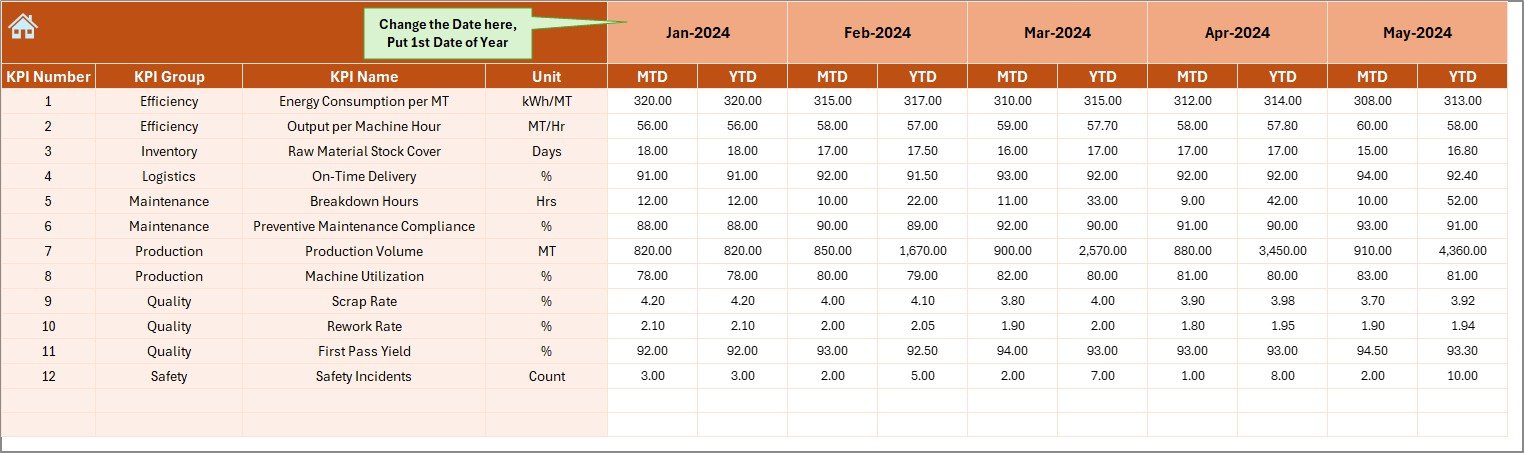
📝 Actual Input Sheet – Simple format to enter monthly actual numbers without errors.
🎯 Target Sheet – Dedicated sheet for setting monthly and yearly KPI targets.
📆 Previous Year Sheet – Stores last year’s data for accurate YoY analysis.
📚 KPI Definition Sheet – Central KPI dictionary including formula, unit, group, and definition.
Each sheet is interlinked, ensuring automatic updates across the dashboard.
🧭 How to Use the Plastics Manufacturing KPI Dashboard in Excel
1️⃣ Enter monthly Actual MTD & YTD values in the Actual Input Sheet
2️⃣ Update target numbers in the Target Sheet
3️⃣ Add previous year data for comparison
4️⃣ Select the required month on the Dashboard
5️⃣ Review KPI cards, arrows, and summaries
6️⃣ Analyze performance trends using the Trend Sheet
7️⃣ Take corrective actions based on insights
No advanced Excel skills required—your team can start using it immediately.
👥 Who Can Benefit from This Plastics Manufacturing KPI Dashboard
🏭 Production Managers – Track output, downtime, and utilization
📊 Plant Heads – Monitor overall plant efficiency and performance gaps
✅ Quality Teams – Control defect rates, rejection %, and yield
💰 Cost & Operations Teams – Identify cost overruns and inefficiencies
📈 Senior Management – Review performance quickly without raw data analysis
Whether it is a small unit or a multi-line manufacturing plant, this dashboard scales with your needs.
📘 Click here to read the Detailed blog post
Watch the step-by-step video tutorial:
👉 Visit our YouTube channel to learn step-by-step video tutorials
Youtube.com/@PKAnExcelExpert


Reviews
There are no reviews yet.