Pipeline infrastructure projects involve complex operations, strict safety standards, and continuous performance monitoring. However, managing infrastructure KPIs through scattered spreadsheets and manual reports often leads to delayed decisions and limited project visibility.
That is exactly why the Pipeline Infrastructure KPI Dashboard in Excel is a powerful solution for infrastructure teams, engineering companies, and pipeline operators.
This ready-to-use Excel dashboard template allows organizations to monitor construction progress, maintenance performance, safety indicators, operational efficiency, and cost performance from one centralized interface.
Instead of analyzing multiple reports, managers can instantly evaluate KPI performance through interactive charts, automated calculations, and dynamic performance indicators.
As a result, teams gain better visibility into infrastructure performance, enabling faster decisions and improved operational control.
🚀 Key Feature of Pipeline Infrastructure KPI Dashboard in Excel
📊 Interactive KPI Dashboard
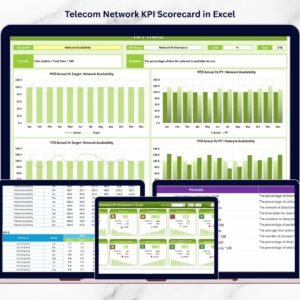
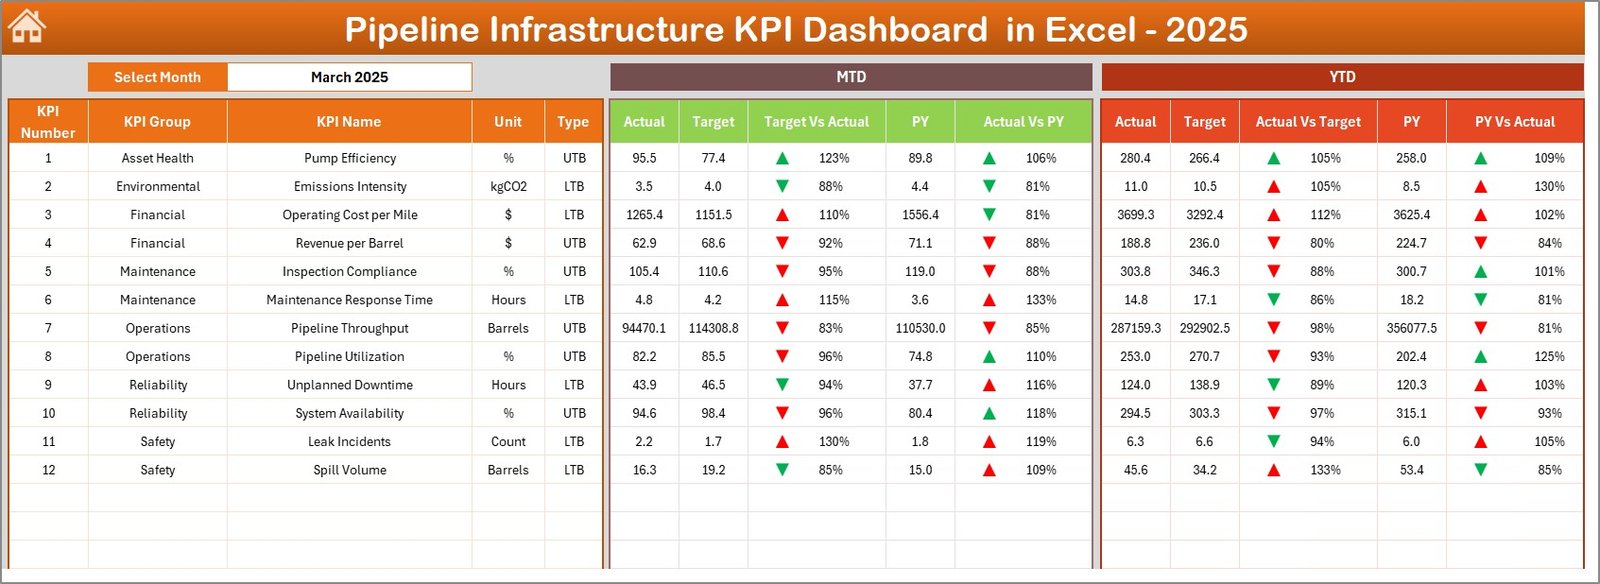
Monitor key pipeline infrastructure metrics through a visually structured dashboard displaying MTD and YTD performance.
📅 Monthly Performance Tracking
Select any month from the dropdown menu and instantly update the entire dashboard for quick analysis.
📈 MTD and YTD KPI Monitoring
Track monthly and yearly performance using automated KPI calculations and visual indicators.
🎯 Target vs Actual Performance Comparison
Easily evaluate whether operational performance meets defined targets.
📉 Previous Year Performance Benchmarking
Compare current results with previous year data to identify improvement opportunities.
🔔 Conditional Formatting Indicators
Up and down arrows visually indicate performance improvement or decline.
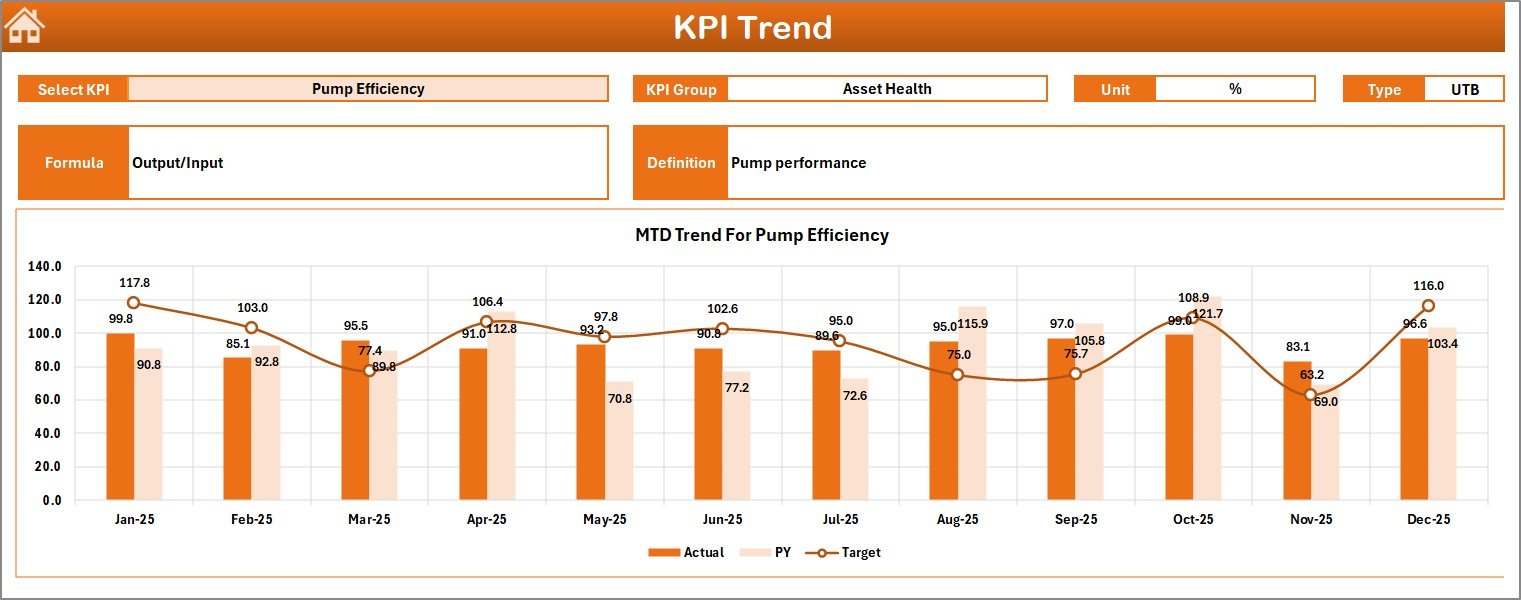
📊 Dynamic KPI Trend Charts
Analyze KPI performance trends using interactive charts that compare actual, target, and historical values.
🧭 Easy Navigation Interface
The Summary sheet includes navigation buttons that allow users to move across dashboard pages quickly.
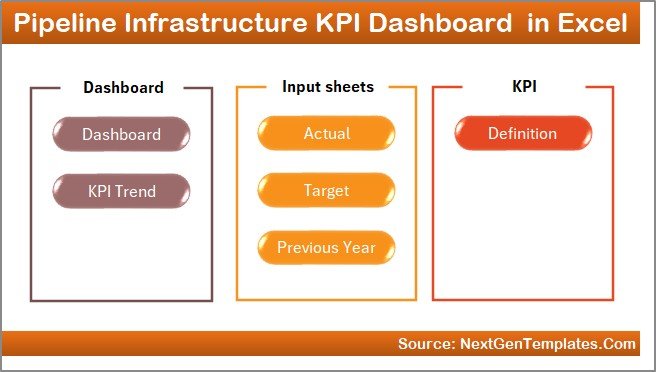
📦 What’s Inside the Pipeline Infrastructure KPI Dashboard in Excel
This Excel dashboard includes seven structured worksheets designed to deliver complete KPI performance monitoring.
📄 Summary Page (Navigation Hub)
Acts as the index page of the dashboard with navigation buttons to access all worksheets quickly.
📊 Dashboard Sheet (Main KPI Monitoring Page)
Displays all KPI metrics including MTD Actual, Target, Previous Year, and YTD performance comparisons.
📈 Trend Analysis Sheet
Provides visual trend analysis charts to evaluate KPI performance over time.
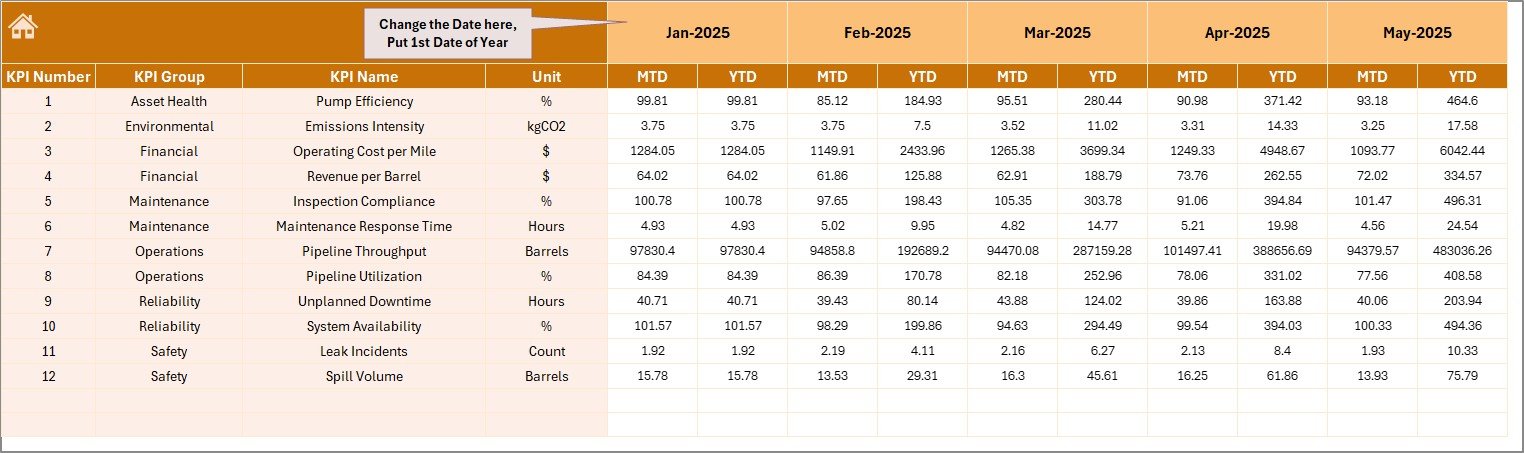
✏️ Actual Numbers Input Sheet
Used for entering real operational KPI data such as MTD and YTD performance numbers.
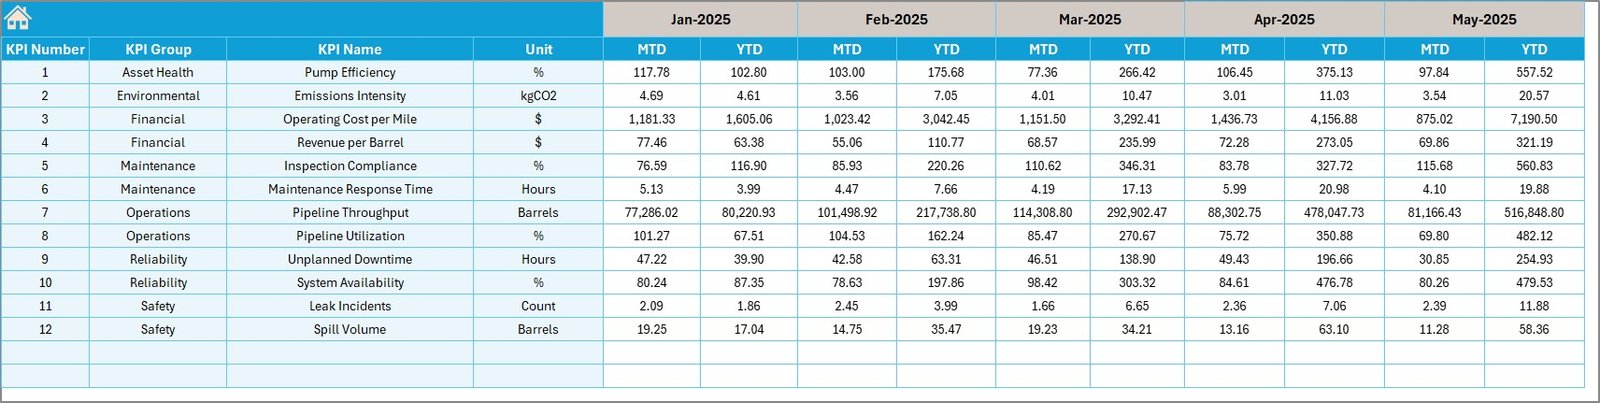
🎯 Target Sheet
Stores KPI performance targets used for benchmarking and evaluation.
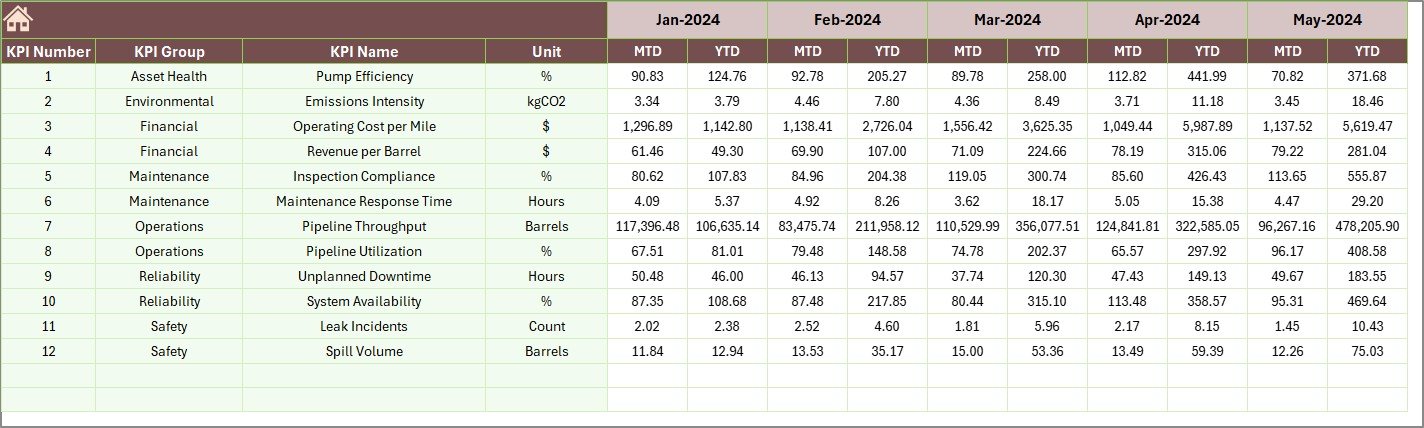
📚 Previous Year Data Sheet
Contains historical KPI values for year-over-year performance comparison.
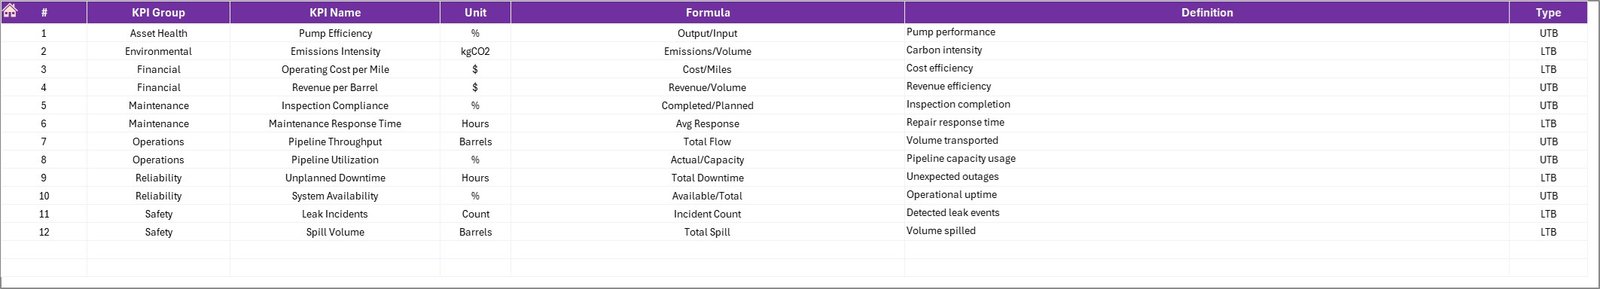
🧾 KPI Definition Sheet
Documents each KPI with its name, group, unit, formula, and definition to ensure consistent measurement.
Together, these sheets create a complete infrastructure KPI monitoring system inside Excel.
⚙️ How to Use the Pipeline Infrastructure KPI Dashboard in Excel
Using this dashboard is simple and does not require advanced Excel expertise.
Step 1 – Define Your KPIs
List all pipeline infrastructure KPIs such as construction progress, maintenance efficiency, safety metrics, and cost performance.
Step 2 – Enter KPI Definitions
Add KPI name, formula, and unit in the KPI Definition sheet.
Step 3 – Set Monthly Targets
Enter KPI performance targets in the Target sheet.
Step 4 – Add Previous Year Data
Input historical KPI numbers to enable year-over-year analysis.
Step 5 – Enter Actual KPI Data
Update monthly operational performance numbers in the Actual Numbers Input sheet.
Step 6 – Analyze Dashboard Insights
Select a month and instantly review KPI performance through the dashboard charts and indicators.
Within minutes, managers can transform raw operational data into clear infrastructure performance insights.
👥 Who Can Benefit from This Pipeline Infrastructure KPI Dashboard
This dashboard is designed for professionals responsible for managing infrastructure performance.
👷 Pipeline Infrastructure Project Managers – Monitor project performance and operational efficiency.
🏗️ Pipeline Construction Companies – Track construction progress, costs, and productivity.
⛽ Oil & Gas Pipeline Operators – Evaluate operational KPIs and maintenance performance.
🏭 Utility Infrastructure Organizations – Monitor pipeline systems and infrastructure operations.
📊 Infrastructure Consultants & Analysts – Analyze KPI trends and operational metrics.
⚙️ Operations & Maintenance Managers – Track equipment performance and maintenance efficiency.
Because it runs entirely in Excel, the dashboard is easy to implement without expensive BI tools.
Organizations gain centralized reporting, faster decision-making, and improved project visibility.
Click here to read the Detailed blog post
Watch the step-by-step video tutorial: