In the Pharmaceutical KPI Dashboard, accuracy, consistency, and compliance are non-negotiable. Every month, teams must track sales, production, quality, compliance, and operational KPIs without delay. However, many pharma companies still rely on scattered Excel files, manual consolidation, and static reports. As a result, insights arrive late, decisions slow down, and risks increase.
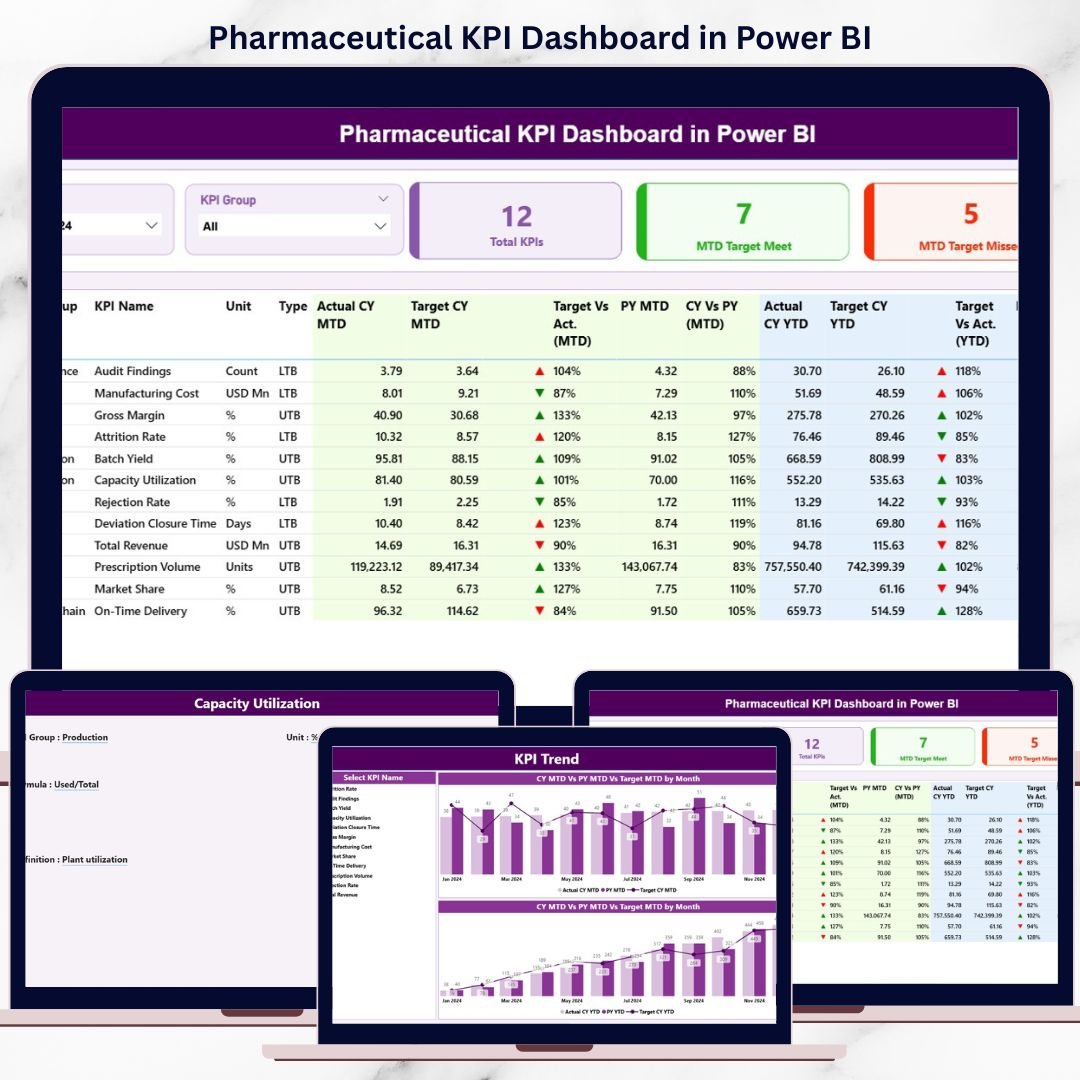
The Pharmaceutical KPI Dashboard in Power BI is a ready-to-use, interactive performance management solution designed to eliminate these challenges. Instead of juggling multiple reports, you get a single, centralized dashboard that shows MTD, YTD, Target vs Actual, and CY vs PY performance for all critical pharmaceutical KPIs.
This dashboard empowers leadership and operational teams to move from manual reporting to real-time, insight-driven decision-making.
🚀 Key Features of Pharmaceutical KPI Dashboard in Power BI
📊 Centralized KPI Monitoring – Track all pharmaceutical KPIs in one interactive dashboard
📅 MTD & YTD Performance Tracking – Monitor short-term and long-term performance effortlessly
🎯 Target vs Actual Comparison – Instantly identify KPIs that meet or miss targets
📈 CY vs PY Analysis – Measure improvement or decline against previous year values
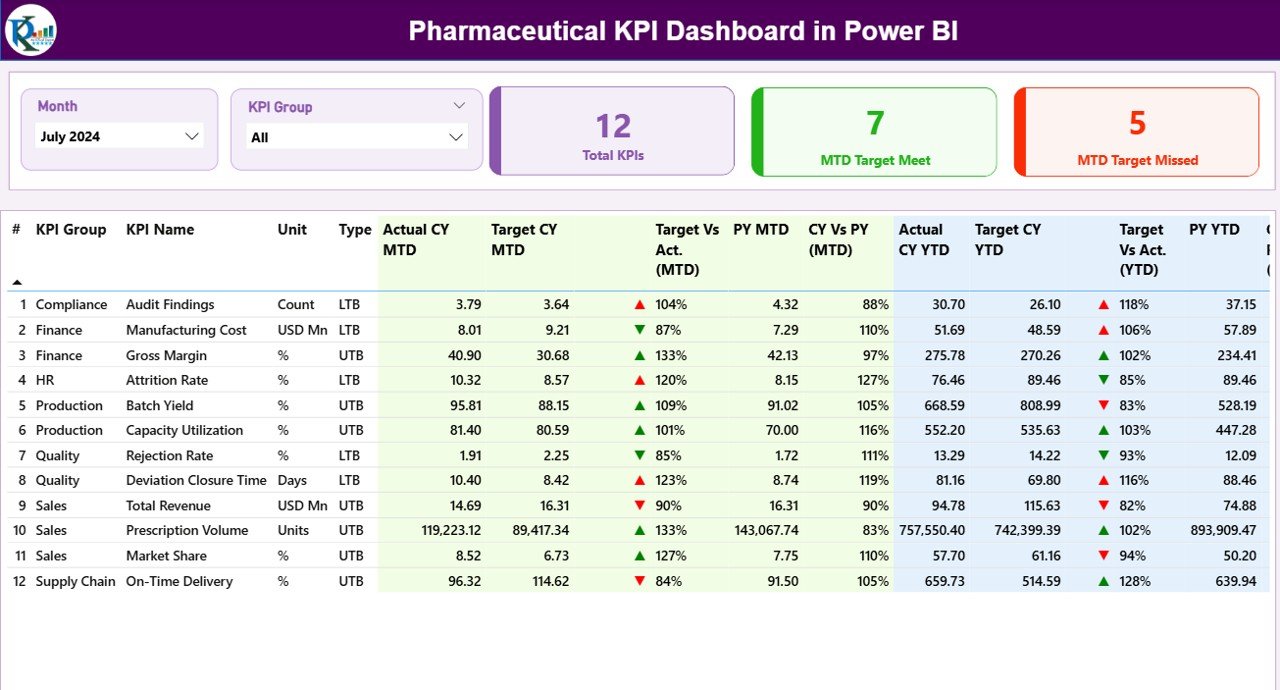
🧩 Month & KPI Group Slicers – Filter performance dynamically for focused analysis
🔔 Visual Status Indicators – Green ▲ and Red ▼ icons highlight KPI performance instantly
🔄 Excel-Based Data Source – Update data in Excel and refresh Power BI
🧠 User-Friendly Design – No advanced Power BI skills required
📦 What’s Inside the Pharmaceutical KPI Dashboard in Power BI
📁 Power BI (.pbix) File with a professionally designed KPI dashboard
📊 Summary Page acting as the main control panel
📌 KPI Cards showing:
-
Total KPIs Count
-
MTD Target Meet Count
-
MTD Target Missed Count
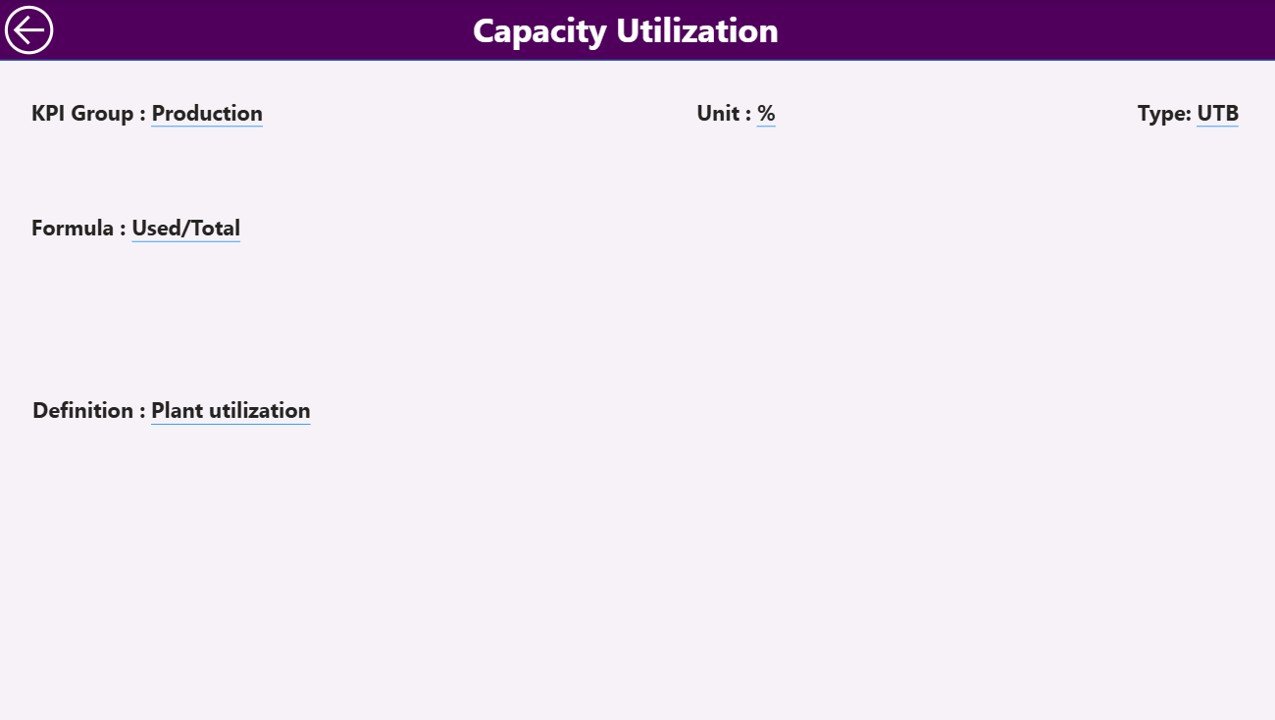
📋 Detailed KPI Table with:
-
KPI Number
-
KPI Group
-
KPI Name
-
Unit
-
KPI Type (LTB / UTB)
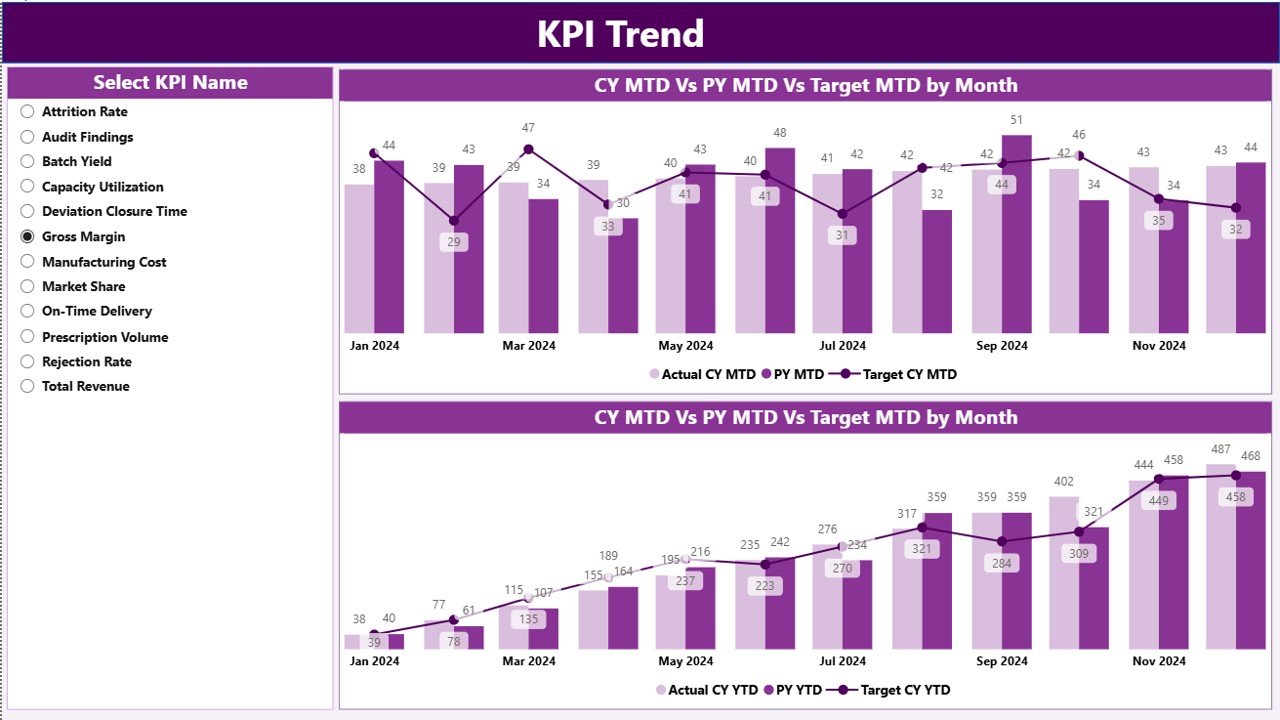
📈 MTD Performance Section including:
-
Actual CY MTD
-
Target CY MTD
-
Target Status Icons
-
Target vs Actual %
-
PY MTD
-
CY vs PY %
📊 YTD Performance Section including:
-
Actual CY YTD
-
Target CY YTD
All visuals are structured to deliver clarity without complexity.
🧠 How to Use the Pharmaceutical KPI Dashboard in Power BI
1️⃣ Update KPI data in the connected Excel data file
2️⃣ Open the Power BI dashboard file
3️⃣ Click Refresh to update all visuals
4️⃣ Select the Month using the slicer
5️⃣ Filter KPIs using the KPI Group slicer
6️⃣ Review MTD, YTD, Target, and Previous Year performance
7️⃣ Use icons and percentages to identify action areas
This workflow saves hours every month and ensures reliable reporting.
👥 Who Can Benefit from This Pharmaceutical KPI Dashboard in Power BI
🧪 Pharmaceutical Companies – Gain complete KPI visibility
📈 Sales & Commercial Teams – Track performance against targets
🏭 Production Managers – Monitor operational KPIs
🧫 Quality & Compliance Teams – Track compliance-related indicators
💼 Business Analysts – Analyze KPI trends interactively
👔 Senior Management & Executives – Get instant performance snapshots
This dashboard is suitable for small, mid-size, and large pharmaceutical organizations.
🔗 Click here to read the Detailed Blog Post
🎥 Visit our YouTube channel to learn step-by-step video tutorials
https://www.youtube.com/@PKAnExcelExpert


Reviews
There are no reviews yet.