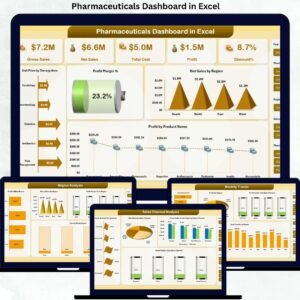
In the fast-paced world of pharmaceuticals, staying ahead of operational, financial, and inventory metrics is vital. That’s exactly where the Pharmaceutical Dashboard in Excel steps in—a fully interactive and professionally designed Excel tool that helps pharmaceutical businesses track everything from revenue and profit to stock levels and expiry risks. 📊💼
This ready-to-use dashboard simplifies your entire data landscape. With a few clicks, you can view insights on sales trends, profit margins, sales rep performance, and potential inventory issues. Whether you’re running a pharmaceutical store, managing distribution, or heading operations—this Excel dashboard empowers you to make smarter, faster, data-backed decisions.
✨ Key Features of the Pharmaceutical Dashboard in Excel
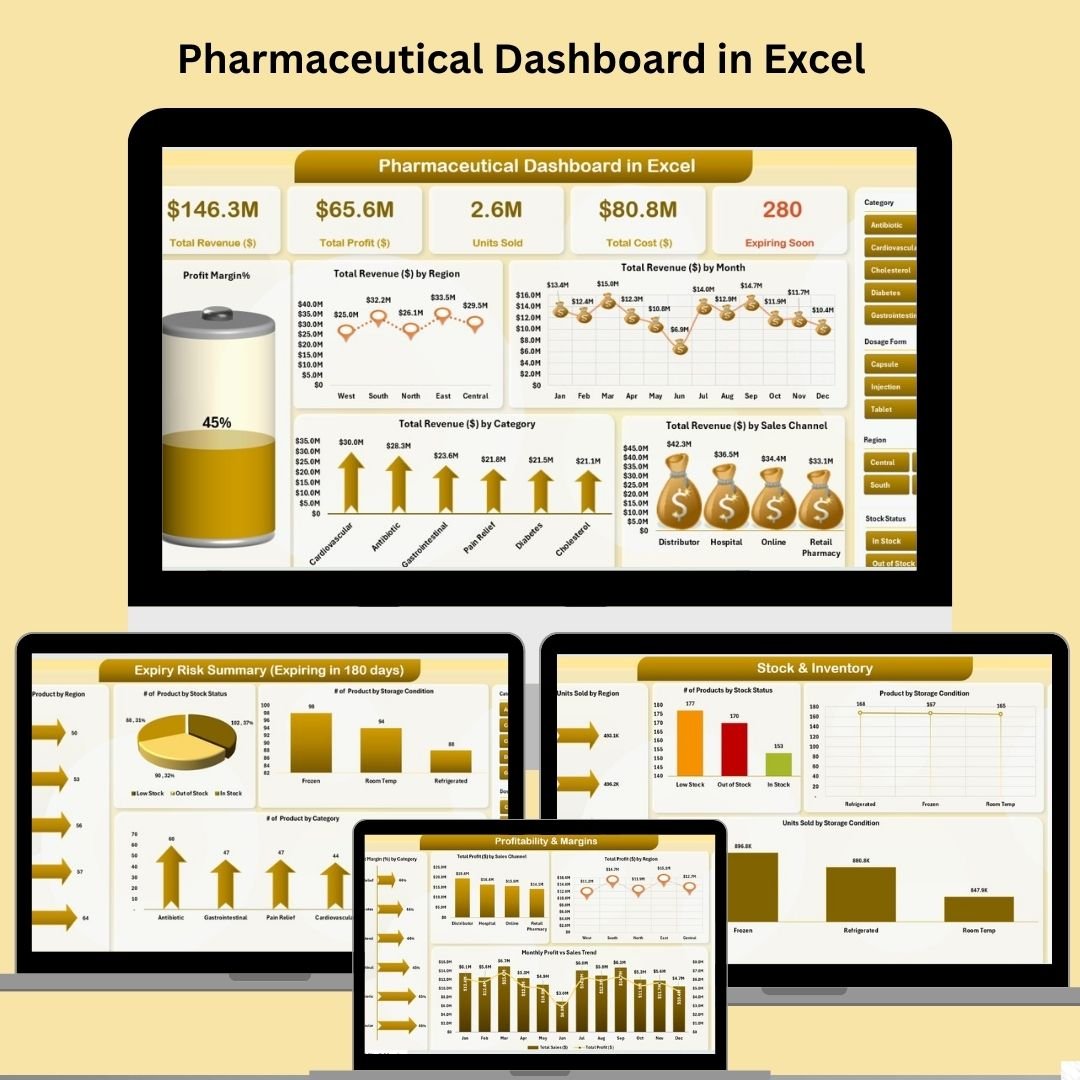
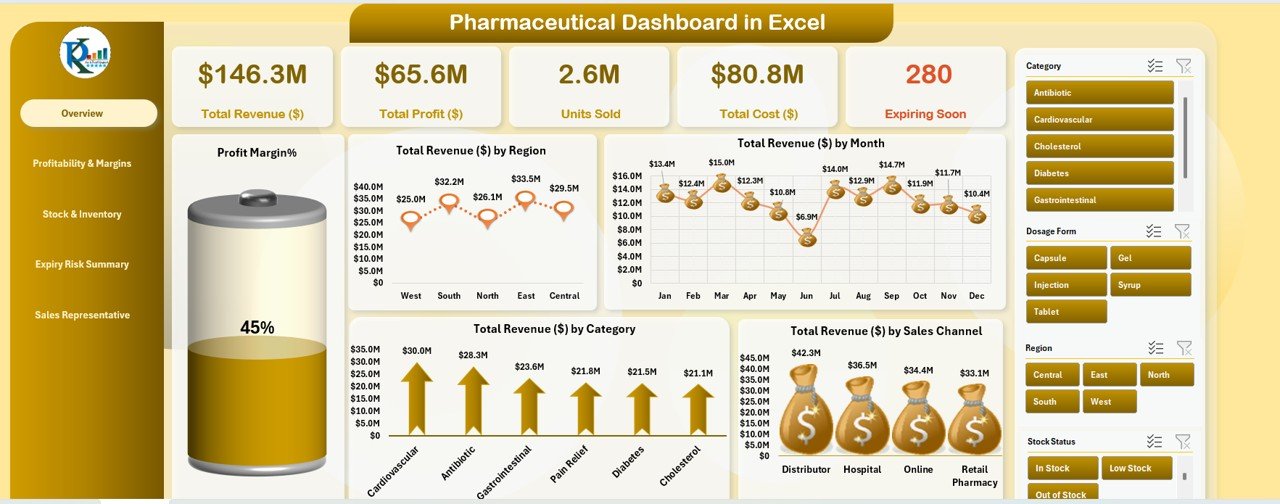
📌 Overview Sheet – High-Level Business Snapshot
-
KPI Cards: Total Revenue, Total Profit, Total Cost, Units Sold, and Expiring Soon Products
-
Charts: Profit Margin Battery Chart, Revenue by Region/Month/Category/Sales Channel
-
Slicers: Quickly filter and drill down by region, category, and channel
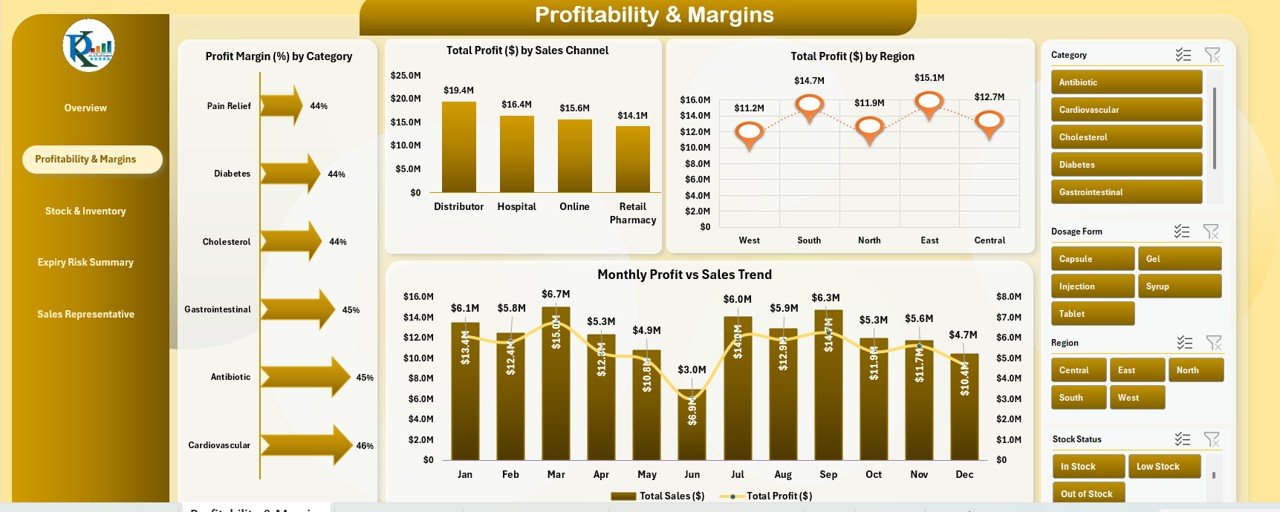
💰 Profitability & Margins Sheet
-
Track profit margins by product category
-
Analyze total profit by sales channel and region
-
Review monthly profit vs. sales performance with trend visuals
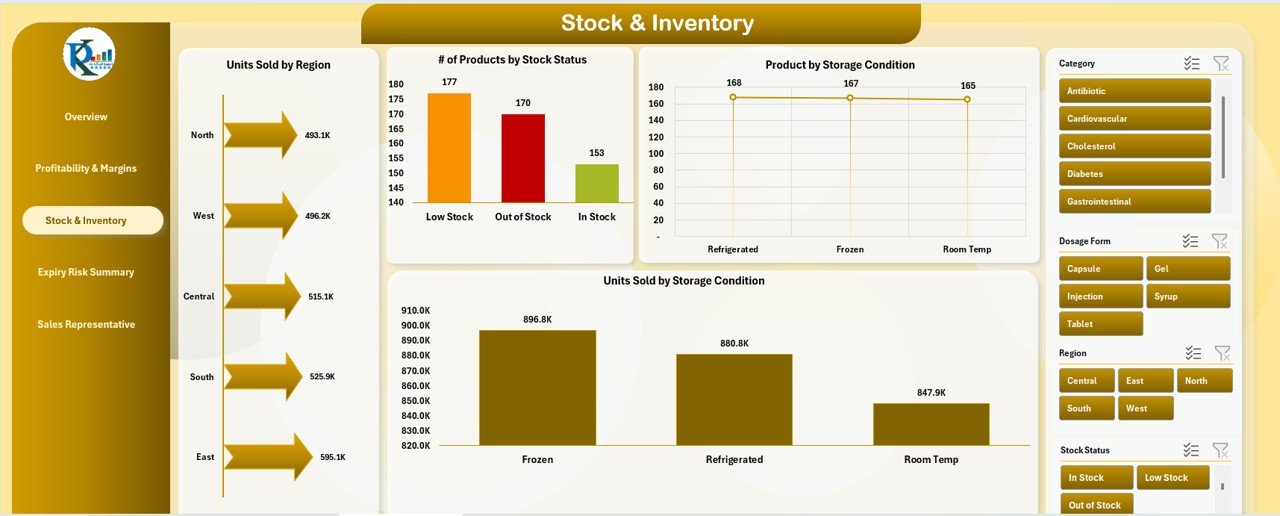
📦 Stock & Inventory Sheet
-
Monitor units sold by region and stock status
-
Visualize product distribution by storage condition
-
Identify which storage environments perform best in sales
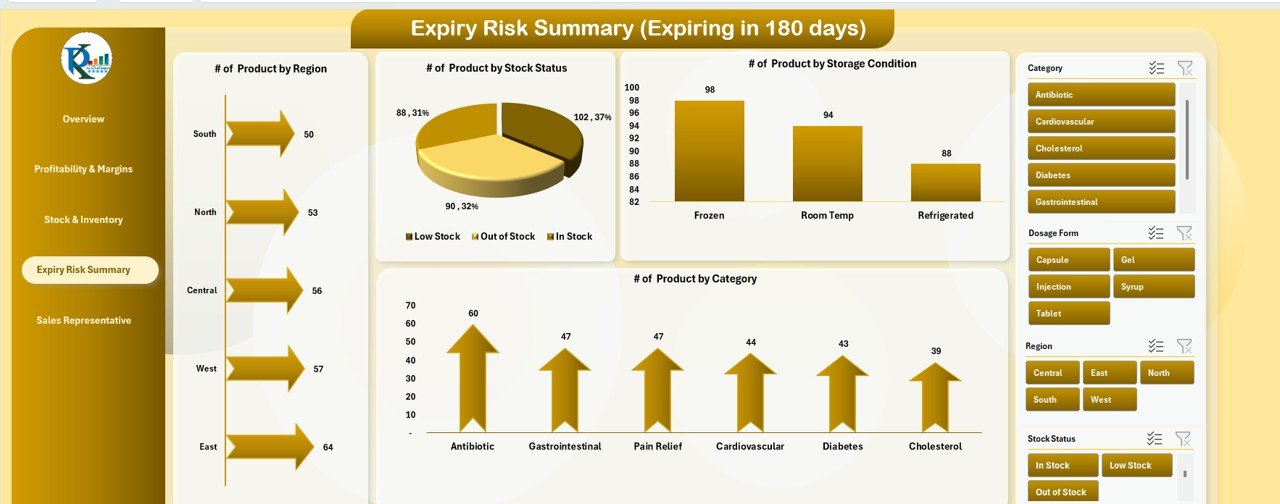
📆 Expiry Risk Summary Sheet
-
Spot products nearing expiry by region, stock status, storage, and category
-
Take timely action to prevent waste and ensure compliance
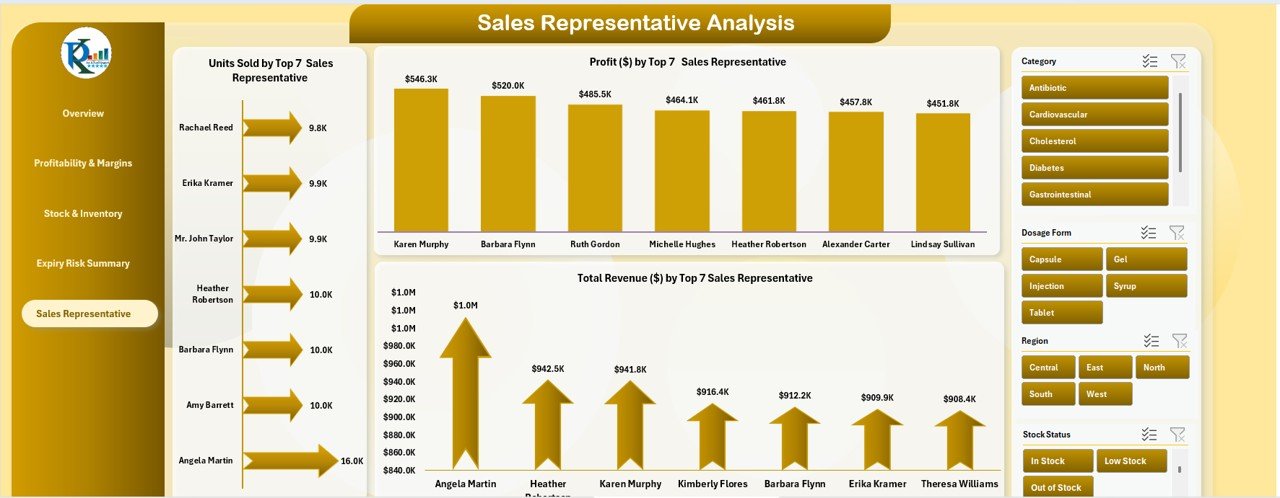
🧑💼 Sales Representative Analysis Sheet
-
View top 7 sales representatives by units sold, revenue generated, and profit
-
Pinpoint top performers and realign underperforming teams
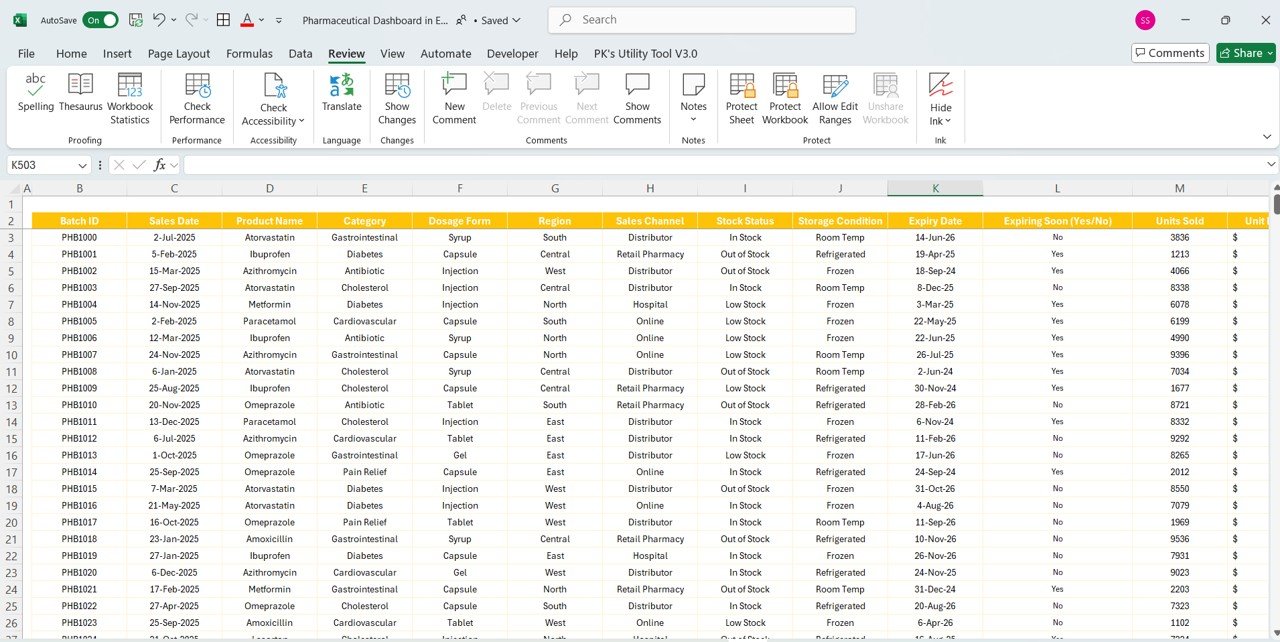
🧾 Data Sheet – Easy Data Entry
-
Enter batch details, sales info, category, region, product type, and more
-
Includes fields like Expiry Date, Expiring Soon flag, Stock Status, and Total Cost
-
Fully linked to auto-refresh all dashboard charts and metrics
📂 What’s Inside the Pharmaceutical Dashboard?
You get 6 highly functional, connected Excel worksheets:
1️⃣ Overview Sheet – KPI Cards + Charts for quick business insights
2️⃣ Profitability & Margins – Dive into category/channel/region-based profits
3️⃣ Stock & Inventory – Stay ahead of stock levels and selling trends
4️⃣ Expiry Risk Summary – Minimize loss by tracking near-expiry products
5️⃣ Sales Rep Analysis – Measure and improve sales team effectiveness
6️⃣ Data Sheet – Centralized input form for all sales and product information
Each sheet is visually designed, formula-linked, and slicer-enabled for real-time analytics.
🛠️ How to Use the Pharmaceutical Dashboard
📥 Step 1: Open the Data Sheet and enter your product and sales data
📊 Step 2: Use filters and slicers to customize your view
📈 Step 3: Analyze insights from each sheet to drive smarter decisions
📦 Step 4: Monitor expiry risks and inventory conditions regularly
💼 Step 5: Use rep performance data to optimize your sales strategy
No complicated formulas or coding—just clean, ready-to-use Excel brilliance.
👨⚕️ Who Can Benefit from This Product?
This dashboard is ideal for:
✅ Pharmaceutical Store Managers – Track sales and expiring stock
✅ Sales Heads – Review rep performance and region-wise growth
✅ Inventory Controllers – Maintain optimal stock levels and storage standards
✅ Operations Executives – Gain a bird’s-eye view of business health
✅ Distributors – Optimize movement across product categories and channels
If your business touches any part of the pharma supply chain—this dashboard will streamline your decisions.
🔗 Click here to read the Detailed blog post
🎥 Visit our YouTube channel to learn step-by-step video tutorials


Reviews
There are no reviews yet.