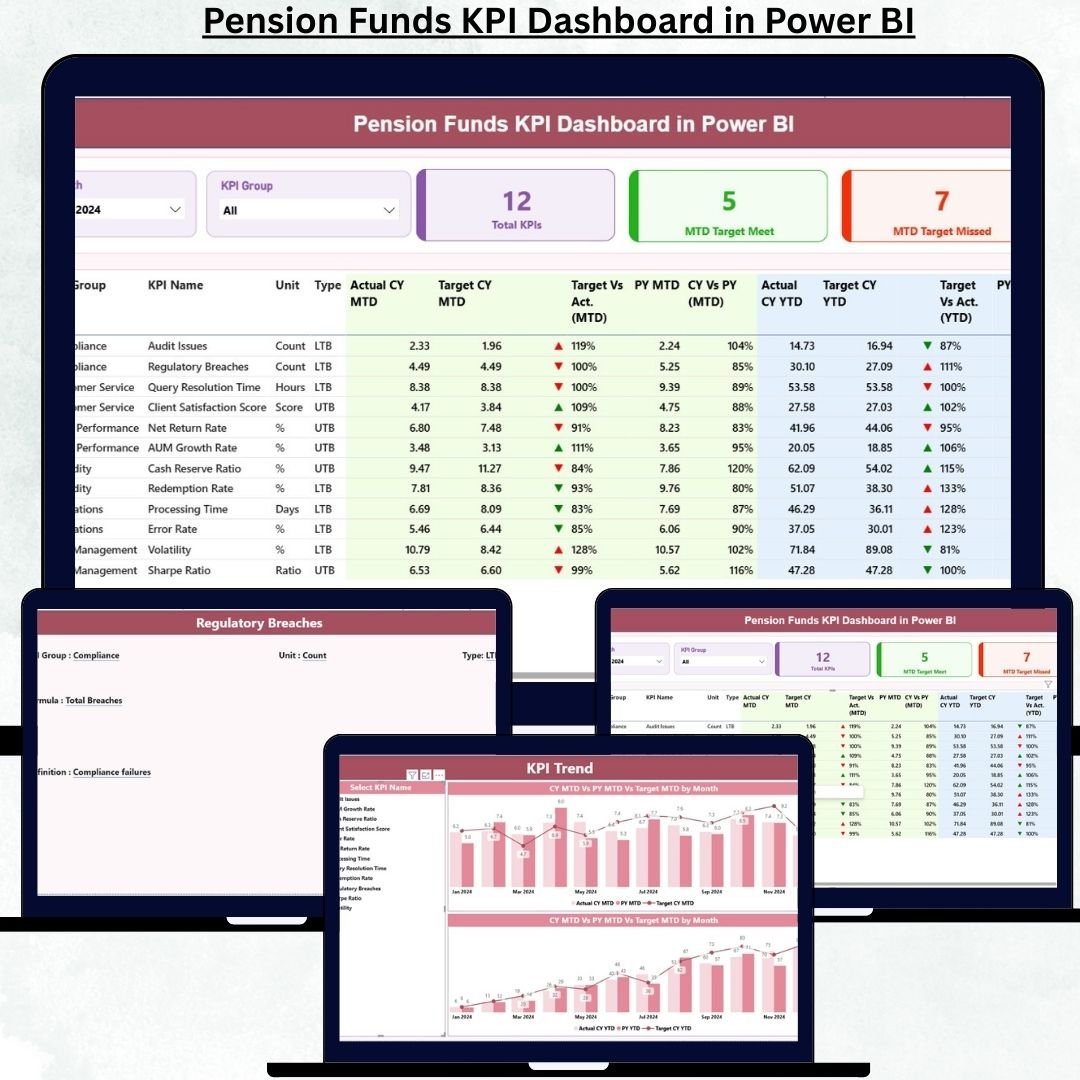
Managing pension funds requires precision, transparency, and long-term strategic control. Even small deviations in performance can create significant future risks for retirees, organizations, and regulators. That is exactly why the Pension Funds KPI Dashboard in Power BI is designed as a powerful, ready-to-use performance monitoring solution for pension fund professionals.
This dashboard transforms raw Excel data into clear, interactive, and decision-ready insights. Instead of relying on static spreadsheets, delayed reports, or manual calculations, you get a single analytical cockpit that highlights performance gaps, trends, and achievements instantly. Built on Power BI with Excel as the data source, this dashboard offers the perfect balance of simplicity and analytical power.
Whether you manage pension operations, investments, compliance, or executive reporting, this dashboard helps you stay proactive, accurate, and confident in every decision.
## ✅ Key Features of Pension Funds KPI Dashboard in Power BI
📊 Executive-Friendly Summary View – Instantly track all pension KPIs from one centralized dashboard
📅 Month & KPI Group Slicers – Analyze performance by month or category with just one click
🎯 MTD & YTD Performance Tracking – Monitor short-term and long-term results side by side
🔄 Target vs Actual Comparison – Identify target gaps immediately using calculated ratios
📈 Previous Year Benchmarking – Compare current performance with last year effortlessly
🚦 Visual Performance Indicators – Green and red arrows instantly highlight success or risk
📉 Interactive Trend Analysis – Understand how KPIs are evolving over time
📘 Integrated KPI Definition Page – Maintain clarity, governance, and KPI consistency
💡 Excel-Based Data Input – No complex systems or coding required
🔒 Scalable & Customizable Design – Easily add new KPIs or reporting periods
## 📂 What’s Inside the Pension Funds KPI Dashboard
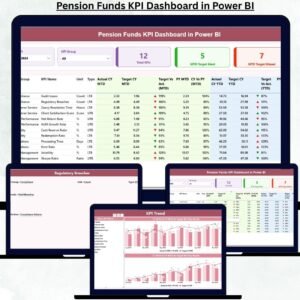
This Power BI dashboard includes three structured pages, each serving a clear analytical purpose.
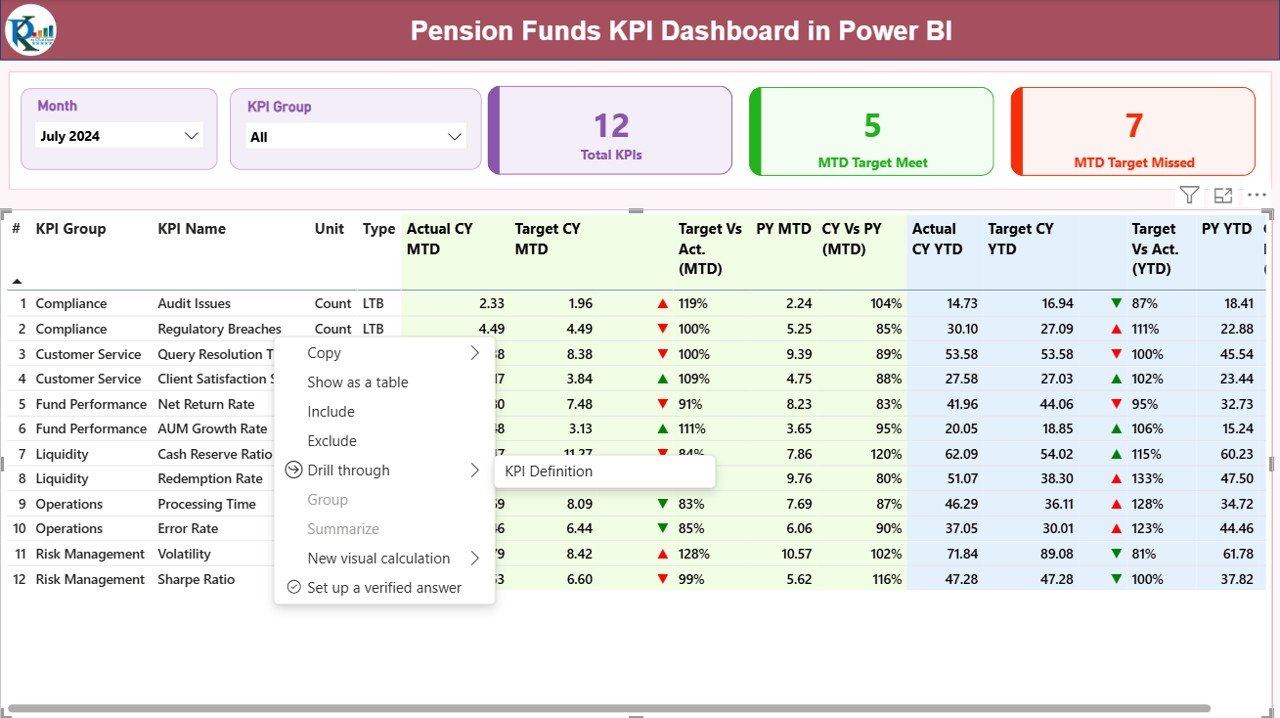
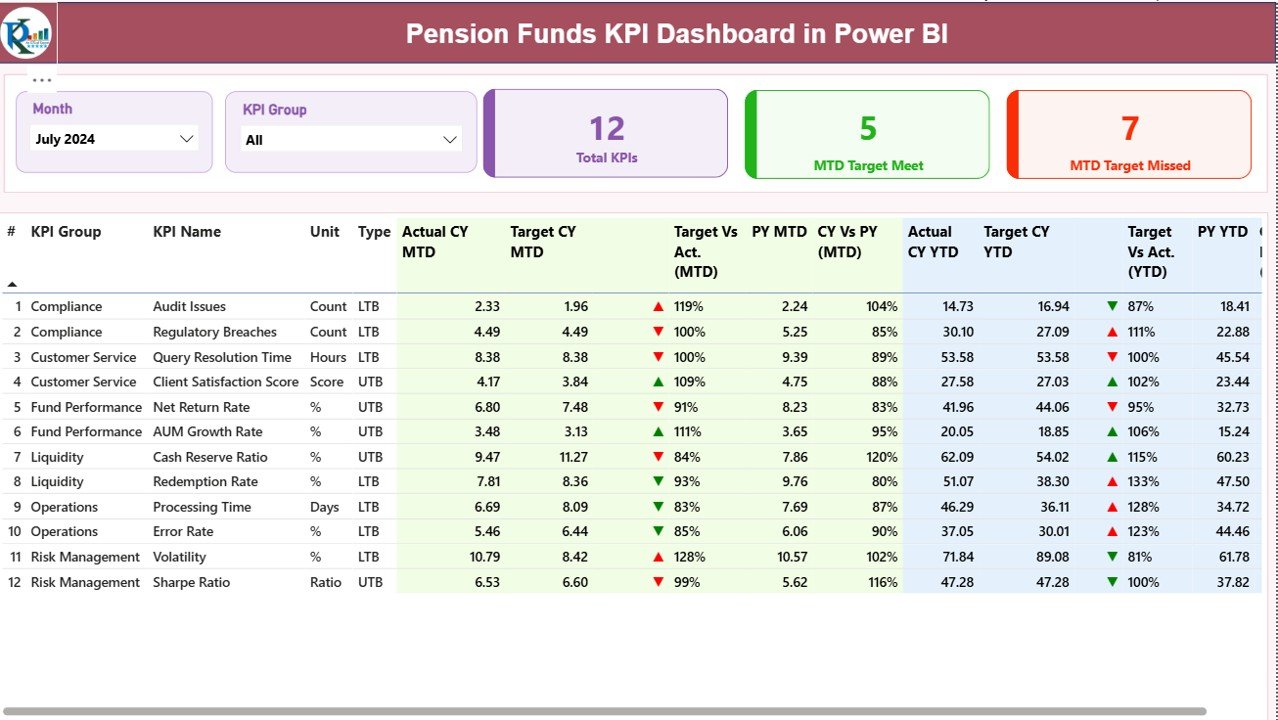
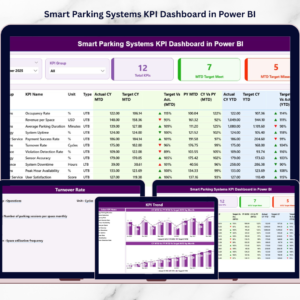
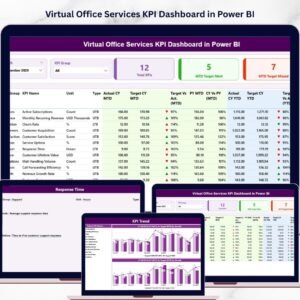
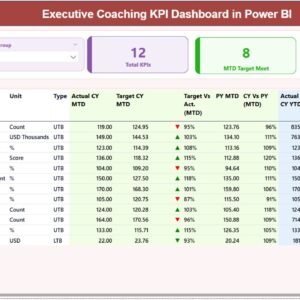
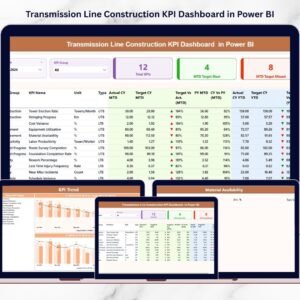
✅ Summary Page
Acts as the command center of the dashboard. It displays month and KPI group slicers, high-level KPI cards (Total KPIs, Target Met, Target Missed), and a detailed KPI table covering MTD and YTD actuals, targets, previous-year values, and performance indicators.
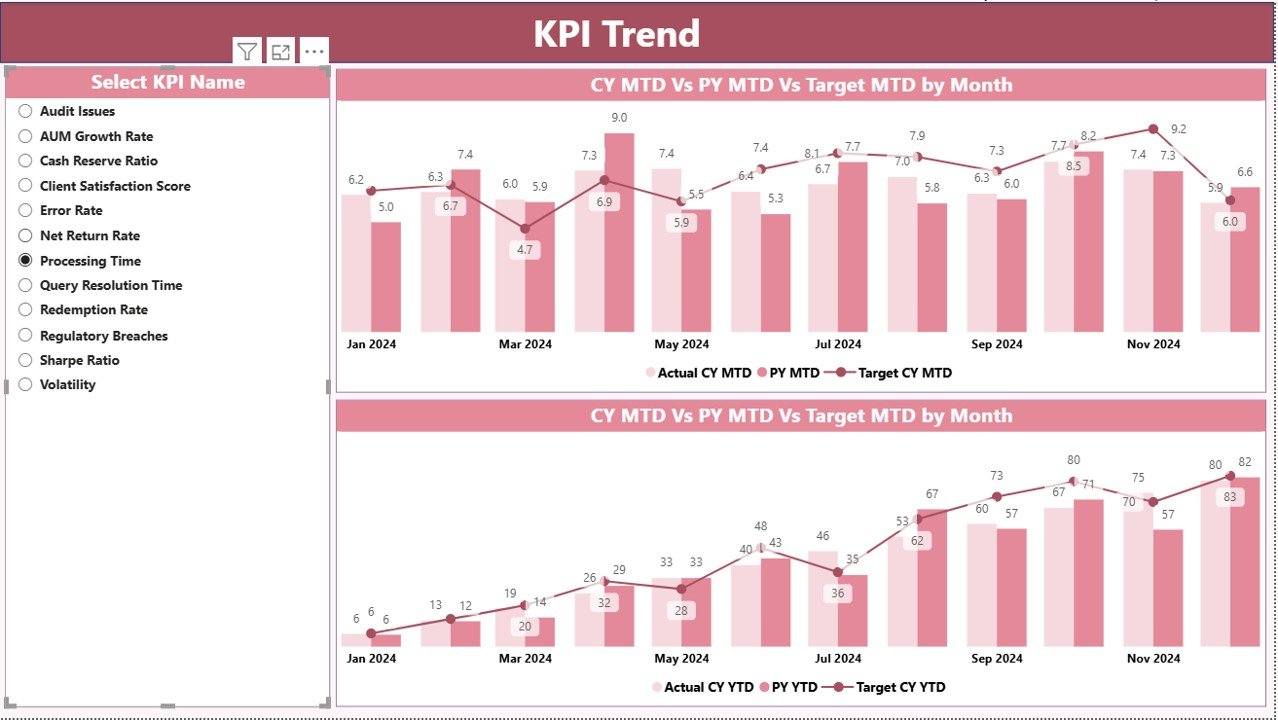
✅ KPI Trend Page
Focuses on performance trends over time. It includes combo charts for MTD and YTD performance, comparing current year actuals, previous year actuals, and target values. A KPI slicer allows instant KPI-level analysis.
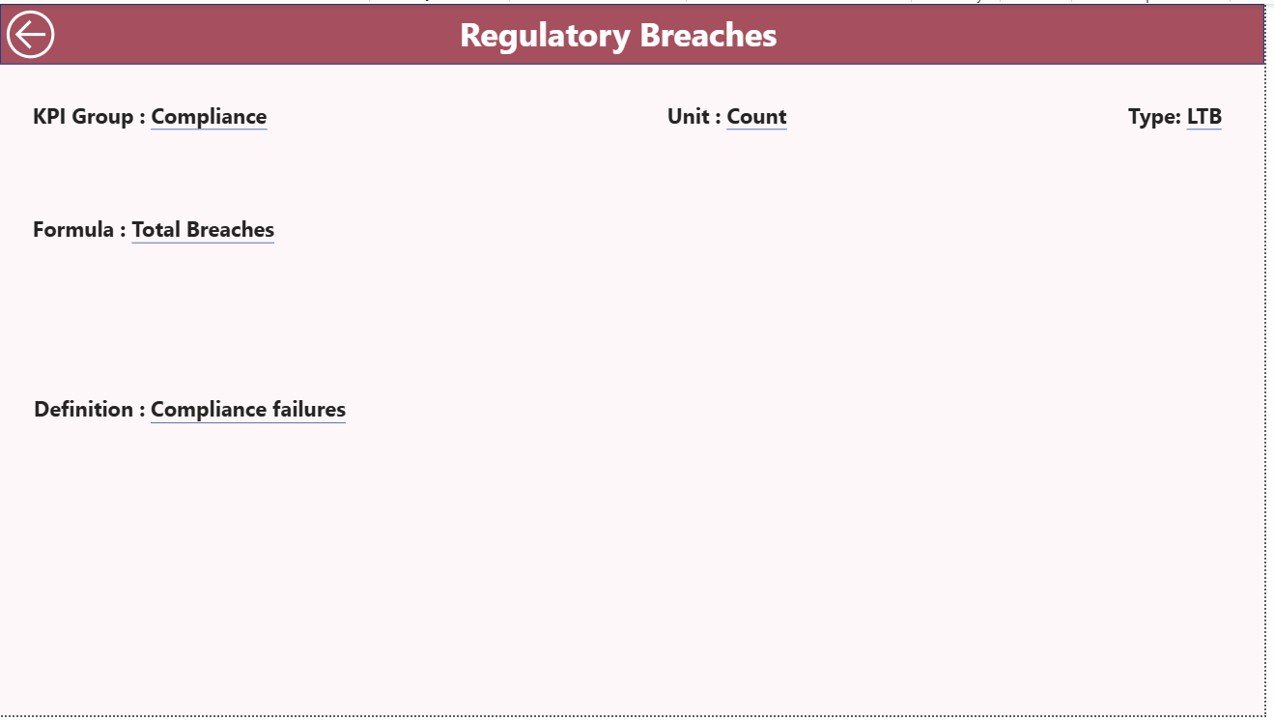
✅ KPI Definition Page
A drill-through governance page that stores KPI formulas, definitions, units, groups, and types (LTB / UTB). This ensures consistent understanding across teams and supports audits and compliance.
## ▶️ How to Use the Pension Funds KPI Dashboard
Using the dashboard is simple and efficient:
1️⃣ Update actual and target values in the structured Excel sheets
2️⃣ Maintain KPI definitions in the KPI Definition sheet
3️⃣ Refresh the Power BI file
4️⃣ Instantly view updated dashboards, KPIs, and trends
No advanced Power BI knowledge or coding skills are required.
## 👥 Who Can Benefit from This Pension Funds KPI Dashboard
🏦 Pension Fund Managers
📊 Investment & Performance Analysts
💼 Finance Controllers
✅ Compliance & Risk Teams
📑 Audit Committees
👔 Senior Leadership & Executives
Both small and large pension organizations can easily adapt this dashboard to their reporting needs.
Click here to read the Detailed blog post


Reviews
There are no reviews yet.