Managing pension funds requires precision, transparency, and strong governance. Fund managers must continuously track performance, ensure compliance, compare targets versus actuals, and communicate results clearly to stakeholders. However, traditional reporting methods—static Excel files, manual calculations, and delayed MIS reports—often slow down decision-making and increase risk.
That is exactly why the Pension Fund KPI Dashboard in Power BI is an essential solution for modern pension fund management ✅.
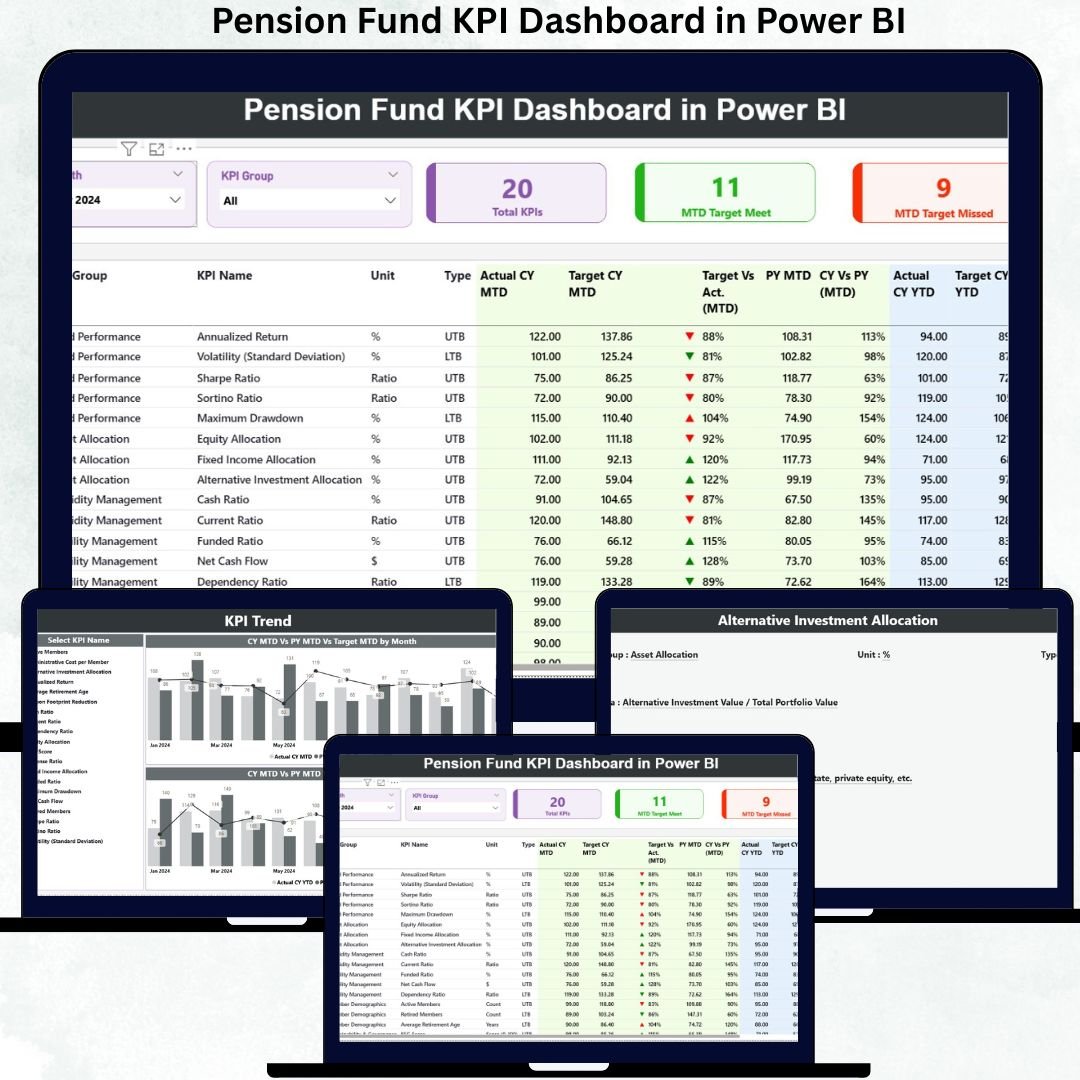
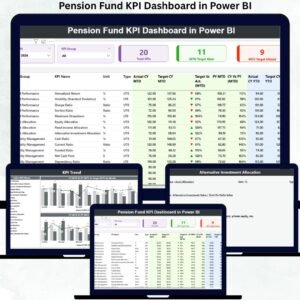
The Pension Fund KPI Dashboard in Power BI is a ready-to-use, interactive analytics dashboard designed to monitor, compare, and evaluate key pension fund KPIs in a structured and visual format. It transforms Excel-based pension data into clear KPI tables, intuitive indicators, and trend-based visuals—all inside Power BI.
Instead of navigating through multiple reports, fund managers can instantly track MTD and YTD performance, evaluate target achievement, compare current year versus previous year, and identify underperforming KPIs early. Most importantly, everything is centralized, transparent, and presentation-ready.
Because the dashboard uses Excel as the data source, it remains flexible, scalable, and easy to maintain, without complex databases or coding.
✅ Key Features of Pension Fund KPI Dashboard in Power BI
📌 Centralized KPI Monitoring – Track all pension KPIs in one structured dashboard
🎯 Target vs Actual Analysis – Clear MTD & YTD performance comparison
📅 Month Selection Slicer – Instantly switch reporting periods
📂 KPI Group Filtering – Analyze KPIs by category or function
📈 Trend Analysis – CY vs PY vs Target comparison using combo charts
🔼🔽 Smart Indicator Arrows – Instantly spot target meets and misses
📖 KPI Definition Drill-Through – Full transparency with formulas & definitions
📊 Excel-Driven Data Model – Easy monthly updates without Power BI complexity
📦 What’s Inside the Pension Fund KPI Dashboard in Power BI
✅ Summary Page (Main Control Panel)
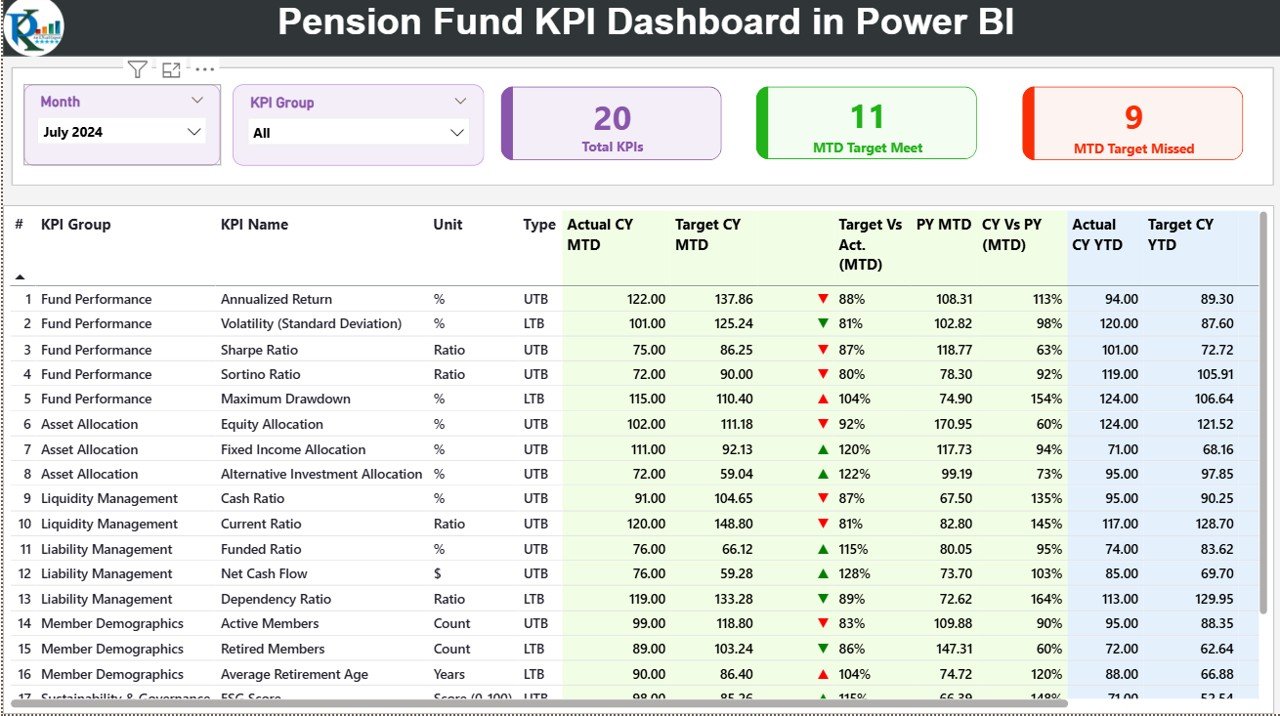
This is the core reporting page where decision-making starts.
-
Month slicer & KPI Group slicer
-
Three KPI Cards:
-
Total KPI Count
-
MTD Target Met Count
-
MTD Target Missed Count
-
-
Detailed KPI Performance Table including:
-
KPI Number, Group, Name, Unit, Type (LTB / UTB)
-
Actual CY MTD & Target CY MTD
-
Target vs Actual (MTD)
-
CY vs PY (MTD)
-
Actual CY YTD & Target CY YTD
-
Target vs Actual (YTD)
-
CY vs PY (YTD)
-
-
Conditional formatting with ▲▼ indicators for instant insight
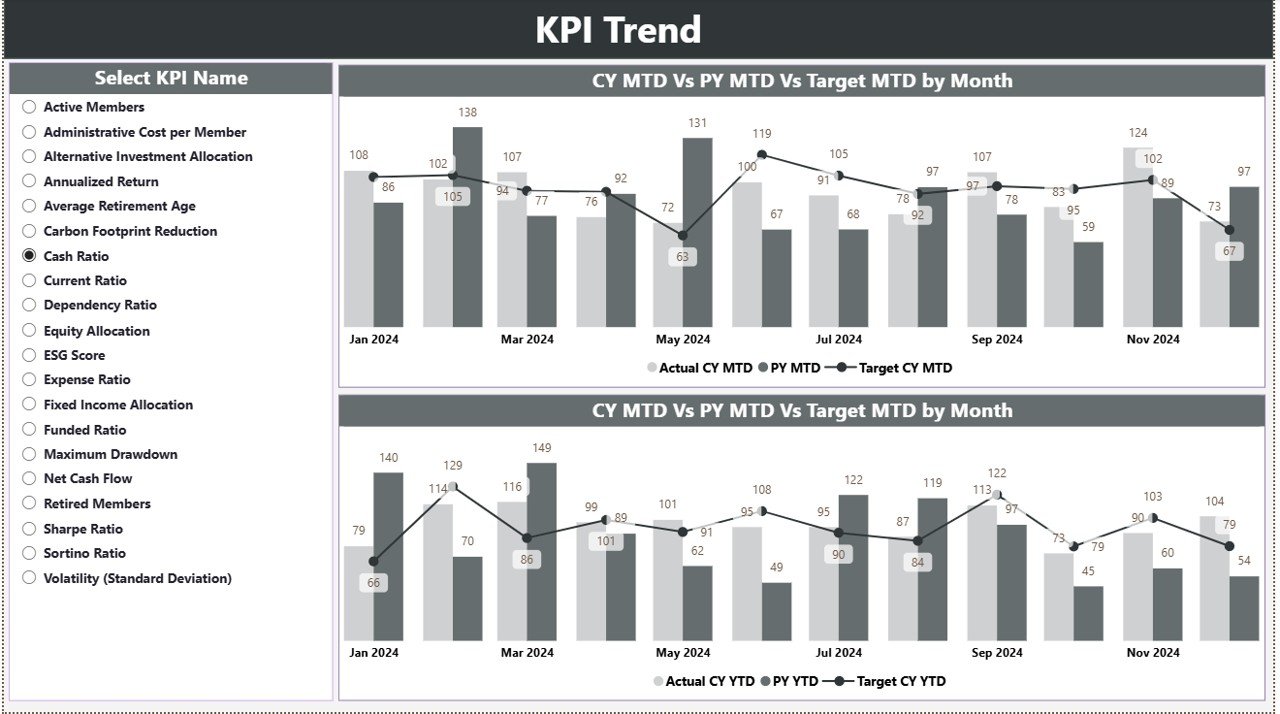
✅ KPI Trend Page
This page answers the most important question: How is performance moving over time?
-
MTD Trend Combo Chart (Actual CY vs PY vs Target)
-
YTD Trend Combo Chart (Actual CY vs PY vs Target)
-
KPI Name slicer to analyze one KPI at a time
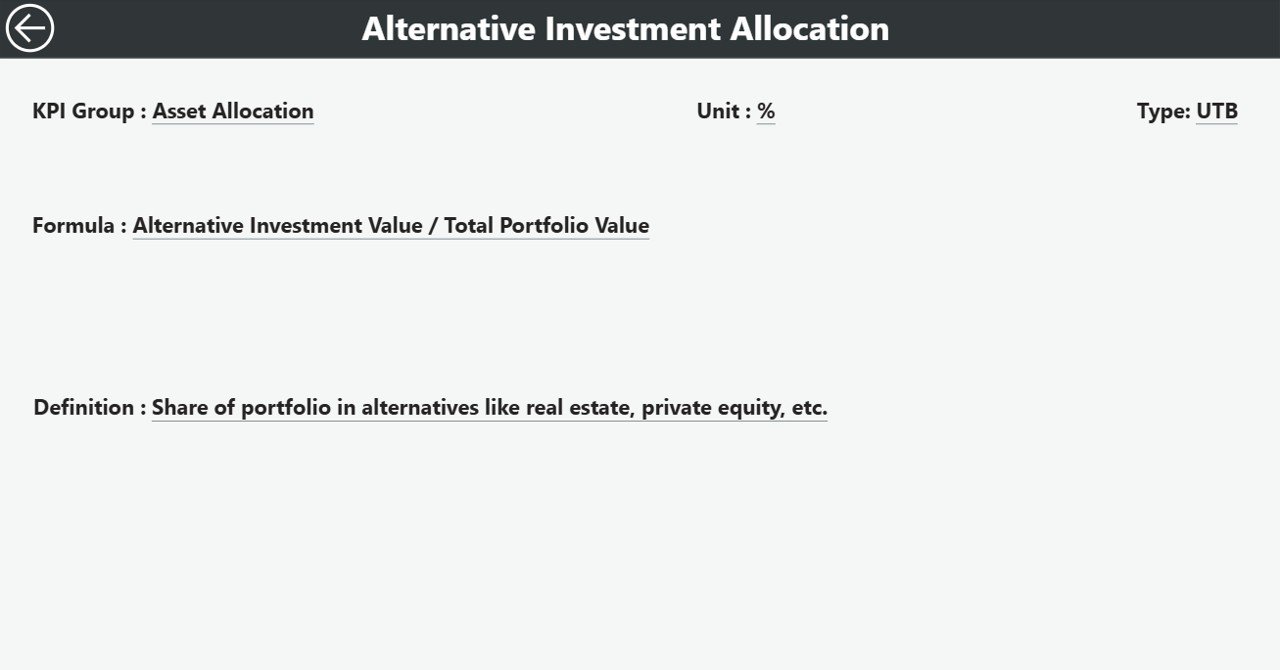
✅ KPI Definition Page (Drill-Through)
Transparency matters in pension reporting.
-
KPI Formula
-
KPI Definition
-
Unit & KPI Type
-
Back button to return to Summary
🛠️ How to Use the Pension Fund KPI Dashboard in Power BI
1️⃣ Enter actual data in Input_Actual Excel sheet
2️⃣ Enter target data in Input_Target Excel sheet
3️⃣ Maintain KPI details in KPI Definition sheet
4️⃣ Refresh the Power BI file
5️⃣ Use slicers to analyze MTD, YTD, and trend performance
6️⃣ Present insights confidently to trustees, boards, and regulators
➡️ No DAX editing. No complex modeling required.
👥 Who Can Benefit from This Dashboard
🏦 Pension Fund Managers
📊 Investment & Performance Analysts
💼 Finance & Reporting Teams
⚖️ Risk & Compliance Teams
🧾 Trustees & Board Members
📈 Actuarial & Advisory Firms
If your organization manages pension reporting, performance monitoring, or compliance, this dashboard is built for you.
🚀 Why This Dashboard Delivers Real Value
✅ Eliminates manual KPI reporting
✅ Improves governance and transparency
✅ Highlights risks early through indicators
✅ Supports data-backed board discussions
✅ Saves time during month-end reporting
✅ Ensures consistent KPI definitions
✅ Scales easily with new KPIs or schemes
This dashboard turns pension reporting into a clear, controlled, and confident process.
📘 Click here to read the Detailed blog post
🎥 Visit our YouTube channel to learn step-by-step video tutorials
👉 https://youtube.com/@PKAnExcelExpert


Reviews
There are no reviews yet.