


The Payroll Management Dashboard in Excel is a powerful, ready-to-use analytics tool that simplifies payroll tracking, boosts accuracy, and delivers real-time financial insights.
Managing payroll can be complex — from calculating gross pay to handling deductions, allowances, and performance bonuses. This interactive Excel dashboard transforms that complexity into clarity, allowing HR professionals, finance teams, and executives to make faster, smarter decisions about employee compensation.
Whether you manage a small team or a large workforce, this dashboard helps you visualize pay distribution, monitor departmental trends, and ensure complete payroll transparency — all within Excel’s familiar interface.
✨ Key Features of the Payroll Management Dashboard in Excel
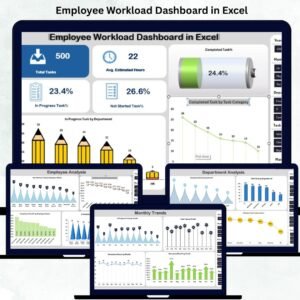
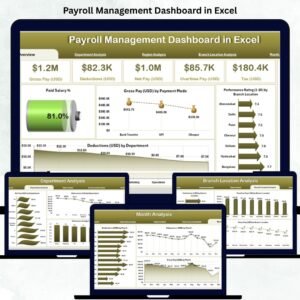
✅ 📊 Overview Page – Complete Payroll Snapshot

Gain a top-level view of all payroll KPIs instantly.
Includes:
-
Total Paid Salary – See total disbursed payroll instantly.
-
Average Gross Pay – Track the average salary across departments.
-
Total Overtime Pay – Monitor extra-hour expenses.
-
Deduction Summary – Keep tabs on tax, PF, or insurance deductions.
-
Performance Rating (1–10) – Assess pay vs performance balance.
Charts: -
Paid Salary Trend 📈
-
Gross Pay (USD) by Payment Mode 💳
-
Performance Rating by Branch Location ⭐
-
Duration (USD) by Department 🏢
💡 Understand your entire payroll health at a glance.
✅ 🏢 Department Analysis Page – Department-Wise Payroll Insight
Dive deeper into payroll distribution by department.
Charts include:
-
Net Pay (USD) by Department
-
Allowance (USD) by Department
-
Performance Rating (1–10) by Department
📈 Identify departments with efficient pay-to-performance ratios.
✅ 🌎 Region Analysis Page – Regional Payroll Comparison
Analyze payroll variations across regions.
Visuals include:
-
Net Pay (USD) by Region
-
Deduction (USD) by Region
-
Performance Rating (1–10) by Region
🌍 Pinpoint high-cost regions and optimize workforce budgeting.
✅ 🏬 Branch Location Analysis Page – Branch-Level Pay Evaluation
Get a clear picture of branch-specific payroll performance.
-
Deduction (USD) by Branch Location
-
Overtime Pay (USD) by Branch Location
-
Gross Pay (USD) by Branch Location
📊 Helps you identify high-cost branches and reward consistent performers.
✅ 📅 Month Analysis Page – Trend-Based Payroll Insights
Track monthly payroll shifts with time-series analysis.
Charts include:
-
Deduction (USD) by Month
-
Allowance (USD) by Month
-
Gross Pay (USD) by Month
📆 Detect seasonal payroll fluctuations and forecast upcoming budgets.
📦 What’s Inside the Dashboard
🧾 Pages Included:
-
Overview
-
Department Analysis
-
Region Analysis
-
Branch Analysis
-
Month Analysis
-
Data Sheet & Support Sheet
📊 Dynamic KPI Cards & Charts: Real-time updates using Excel formulas.
🎯 Interactive Slicers: Filter by Month, Department, or Region.
⚙️ Automation: Linked with Data Sheet for instant refresh.
💻 No technical skills required — simply update your payroll data and let the visuals do the work.
👥 Who Can Benefit from This Dashboard
👩💼 HR Managers – Track pay consistency and performance correlations.
💰 Finance Teams – Control payroll budgets efficiently.
🏢 Department Heads – Compare pay vs. productivity across teams.
👨💻 Business Owners – Gain transparency into total payroll cost.
📊 Executives – Make informed decisions with data-driven clarity.
💡 Advantages of Payroll Management Dashboard in Excel
✅ Centralized Payroll Data – Manage all salary components in one file.
✅ Real-Time Visualization – Charts and KPIs update automatically.
✅ Error-Free Calculations – Formulas ensure 100% accuracy.
✅ Time-Saving Automation – Generate monthly payroll summaries in minutes.
✅ Budget Forecasting – Detect trends and plan future payroll costs.
✅ Low-Cost Solution – A complete payroll management system within Excel.
⚡ From gross pay to net pay, every payroll metric is now just one click away.
🧠 Best Practices for Using This Dashboard
✔️ Update the data sheet monthly for accurate analysis.
✔️ Use consistent naming for employees and departments.
✔️ Protect formula cells from accidental edits.
✔️ Automate repetitive data imports via Power Query.
✔️ Visualize key metrics with color coding (e.g., 🔴 overspend, 🟢 under budget).
Following these practices ensures reliable and insightful payroll analytics.
🔗 Click here to read the Detailed Blog Post
🎥 Visit our YouTube channel to learn step-by-step video tutorials


Reviews
There are no reviews yet.