
The packaging industry runs on speed, precision, and cost control. Even a small delay in production, a rise in material waste, or a missed quality target can directly impact profitability and customer trust. Yet, many packaging manufacturers still rely on disconnected Excel files, manual reporting, and delayed reviews. Because of this, critical performance gaps often go unnoticed until they become expensive problems.
That is exactly where the Packaging Industry KPI Dashboard in Power BI becomes a game-changing performance management solution.
This ready-to-use dashboard transforms raw Excel data into powerful, interactive insights using Power BI. Instead of spending hours compiling reports, decision-makers gain instant visibility into production efficiency, quality performance, cost control, and target achievement. As a result, teams can act faster, smarter, and with confidence.
Built for real-world manufacturing environments, this dashboard tracks MTD and YTD performance, compares Actual vs Target, and highlights year-over-year trends—all in one centralized Power BI report.
🚀 Key Features of the Packaging Industry KPI Dashboard in Power BI
📊 Centralized KPI Monitoring
Track all production, quality, cost, and efficiency KPIs in a single Power BI dashboard instead of juggling multiple spreadsheets.
📅 Dynamic Month & KPI Group Slicers
Filter performance instantly by selecting the required month and KPI category—no manual effort required.
📈 MTD & YTD Performance Tracking
Monitor short-term results while staying aligned with annual business goals.
🎯 Target vs Actual Analysis
Automatically calculate performance gaps and achievement percentages for faster decision-making.
📉 Previous Year Comparison
Compare current performance with last year to identify trends, improvements, and gaps.
🚦 Visual Status Indicators
Green and red arrows instantly show whether KPIs are meeting expectations or need attention.
📂 What’s Inside the Packaging Industry KPI Dashboard in Power BI
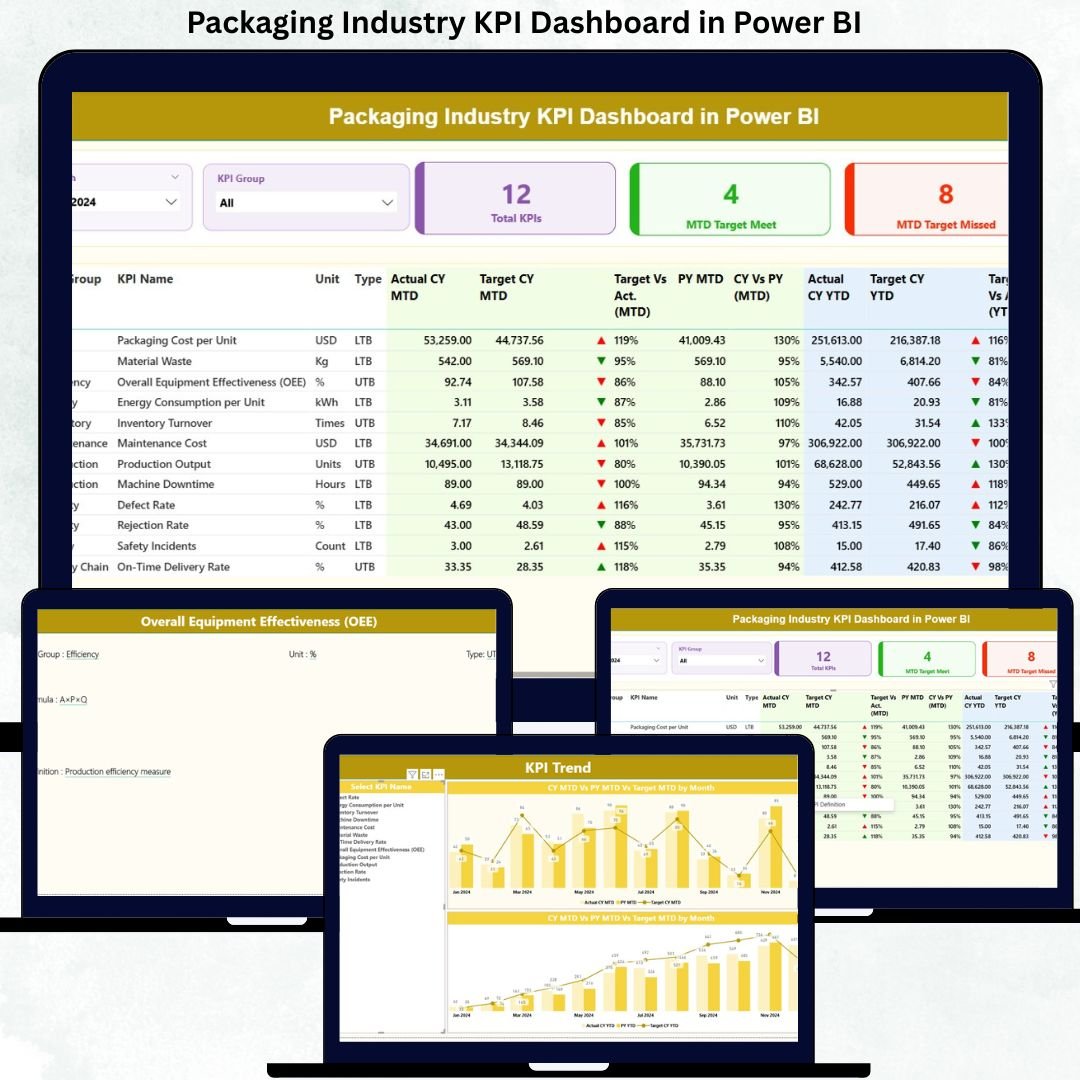
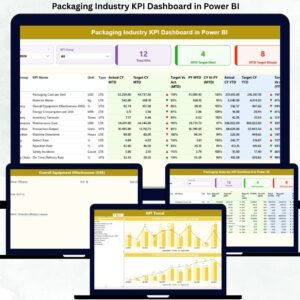
This digital product includes a professionally designed 3-page Power BI report:
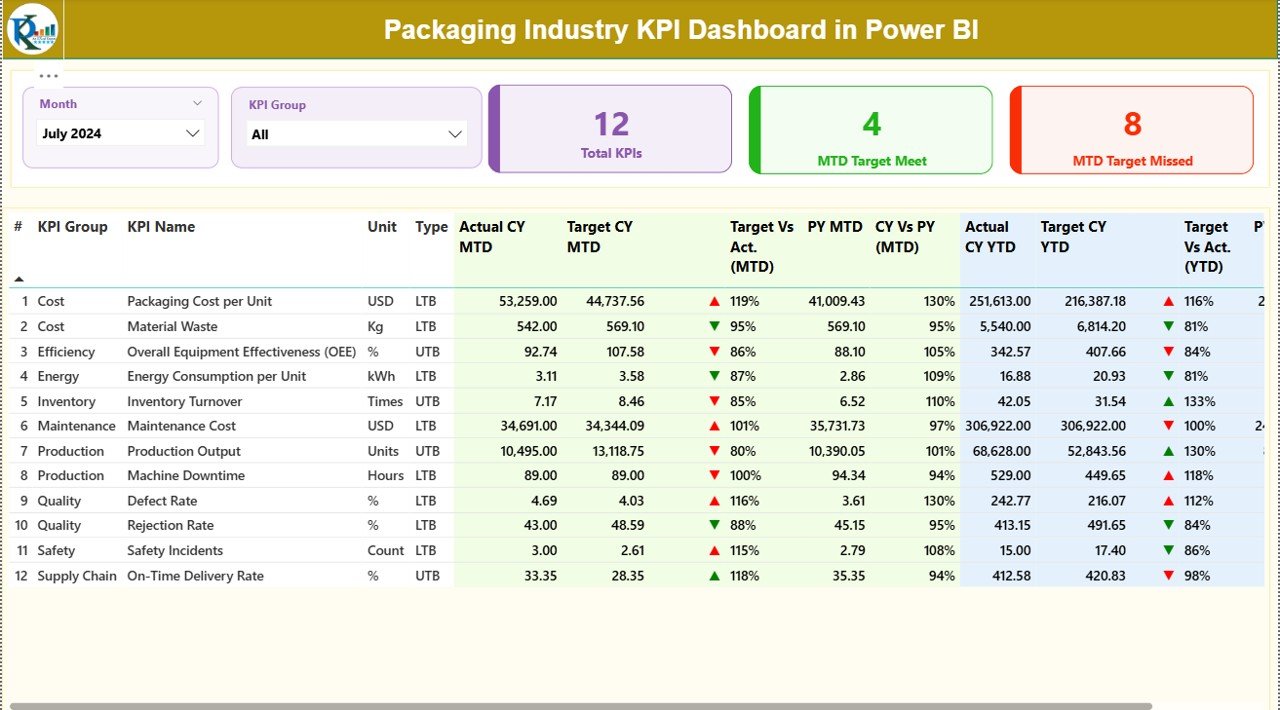
📌 Summary Page
Acts as the control center with month and KPI group slicers, KPI count cards, and a detailed KPI performance table showing MTD, YTD, targets, previous year values, and status indicators.
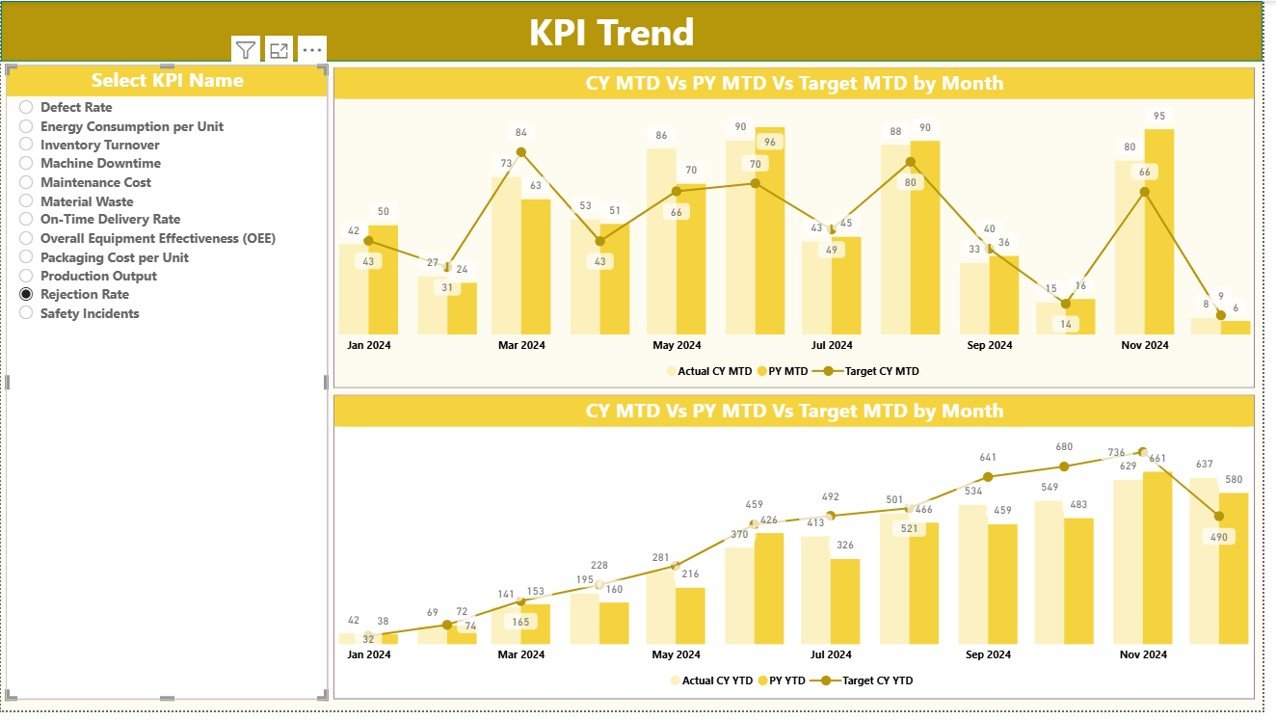
📌 KPI Trend Page
Displays combo charts for selected KPIs, comparing Actual CY, Actual PY, and Target values for both MTD and YTD analysis.
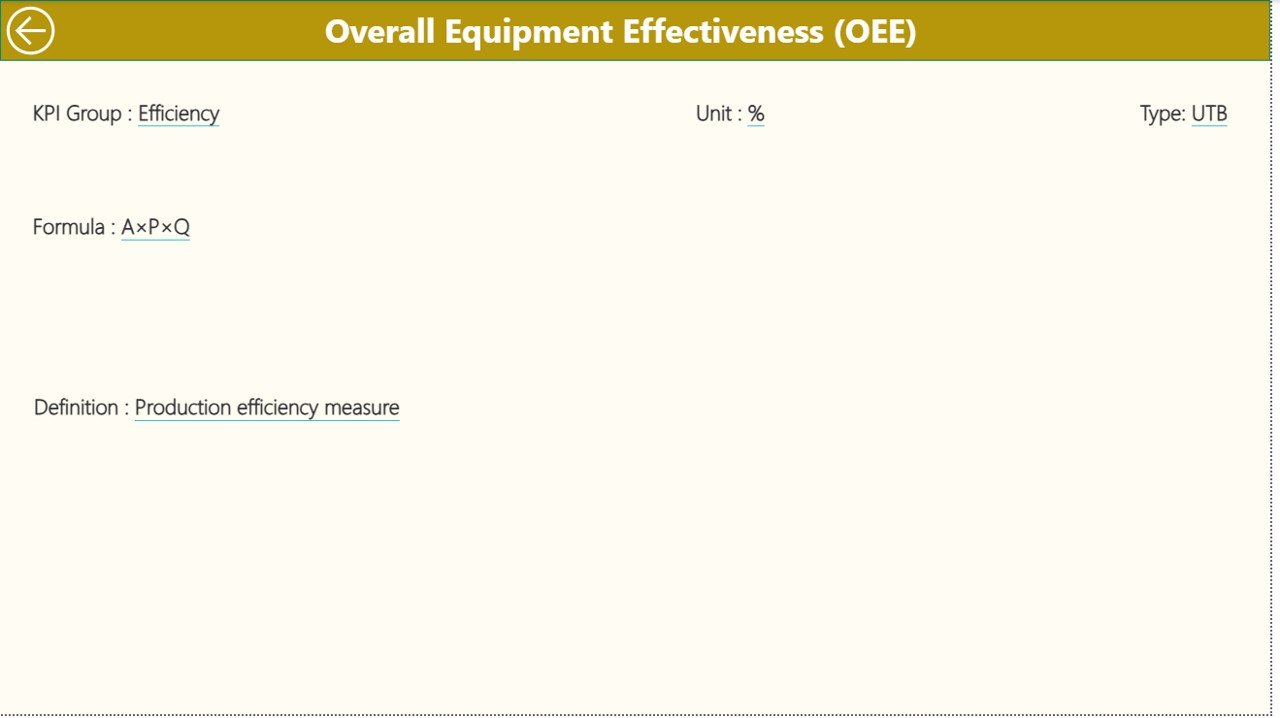
📌 KPI Definition Page
A drill-through reference page showing KPI formulas, definitions, units, and KPI type (LTB or UTB), ensuring clarity and consistency across teams.
The dashboard connects seamlessly to a structured Excel file containing Actuals, Targets, and KPI Definitions, making updates simple and scalable.
🛠️ How to Use the Packaging Industry KPI Dashboard in Power BI
Using this dashboard is straightforward and practical:
1️⃣ Enter Actual MTD and YTD values in the Input_Actual Excel sheet
2️⃣ Update target benchmarks in the Input_Target sheet
3️⃣ Maintain KPI details in the KPI Definition sheet
4️⃣ Refresh the Power BI file
5️⃣ Use slicers to analyze performance instantly
No advanced Power BI expertise is required. Basic Excel knowledge is enough to keep the dashboard running smoothly.
👥 Who Can Benefit from This Packaging Industry KPI Dashboard
This dashboard is ideal for:
🏭 Packaging Plant Managers – Monitor production and efficiency in real time
⚙️ Operations & Production Teams – Identify bottlenecks and performance gaps
🔍 Quality Assurance Managers – Track defects and quality KPIs clearly
🚚 Supply Chain & Logistics Teams – Align delivery performance with targets
💰 Finance & Cost Control Teams – Control costs and improve profitability
📊 Senior Management & Executives – Get high-level performance visibility instantly
Whether you operate a single plant or multiple facilities, this dashboard adapts to your needs.
Click here to read the Detailed Blog Post
Watch the step-by-step video tutorial:


Reviews
There are no reviews yet.