The outsourcing world runs at high speed. Outsourcing (BPO KPO) Dashboard companies handle thousands of calls, emails, chats, support tickets, projects, and back-office tasks every day. When all this data sits inside spreadsheets, CRM exports, shared folders, or manual logs, managers struggle to get clarity. Slow decisions lead to service delays, rising costs, poor satisfaction, and missed business opportunities.
The Outsourcing (BPO KPO) Dashboard in Power BI solves these challenges instantly. It converts raw operational data into clean visuals, KPI cards, trend charts, and performance insights—without any manual work. Managers view cost, revenue, profit, customer satisfaction, escalations, workload, and department-wise performance in seconds. With filters for teams, clients, process types, and months, the dashboard becomes a single source of truth for your entire outsourcing operation.
Whether you manage customer service, finance operations, back-office teams, analytics functions, or research processes, this dashboard helps you take faster, smarter, and data-driven decisions.
✨ Key Features of the Outsourcing (BPO KPO) Dashboard in Power BI
Each page of the dashboard gives a different level of analysis, allowing complete visibility across your entire outsourcing business.
📦 What’s Inside the Outsourcing (BPO KPO) Dashboard
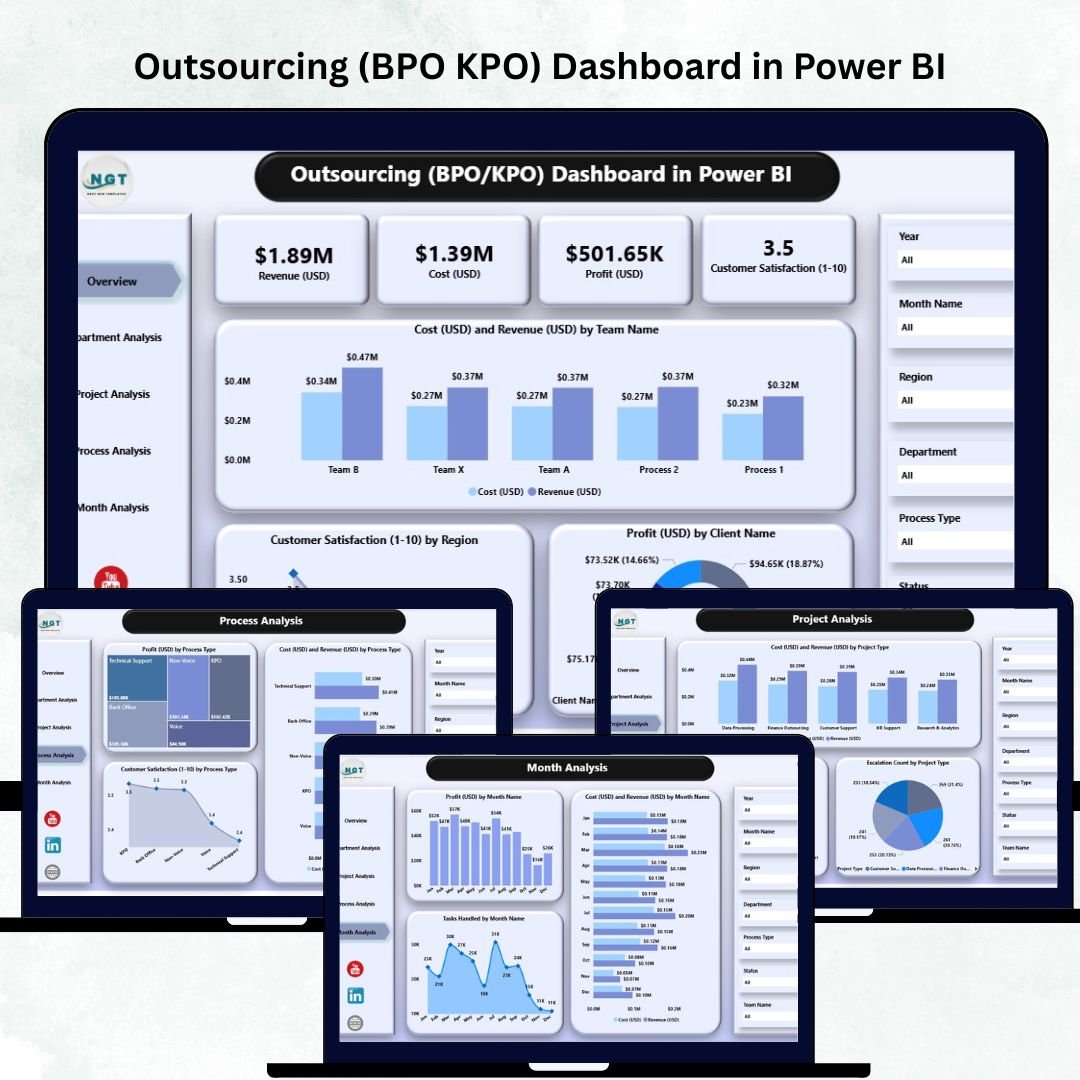
1️⃣ Overview Page – Your Entire Operation at a Glance
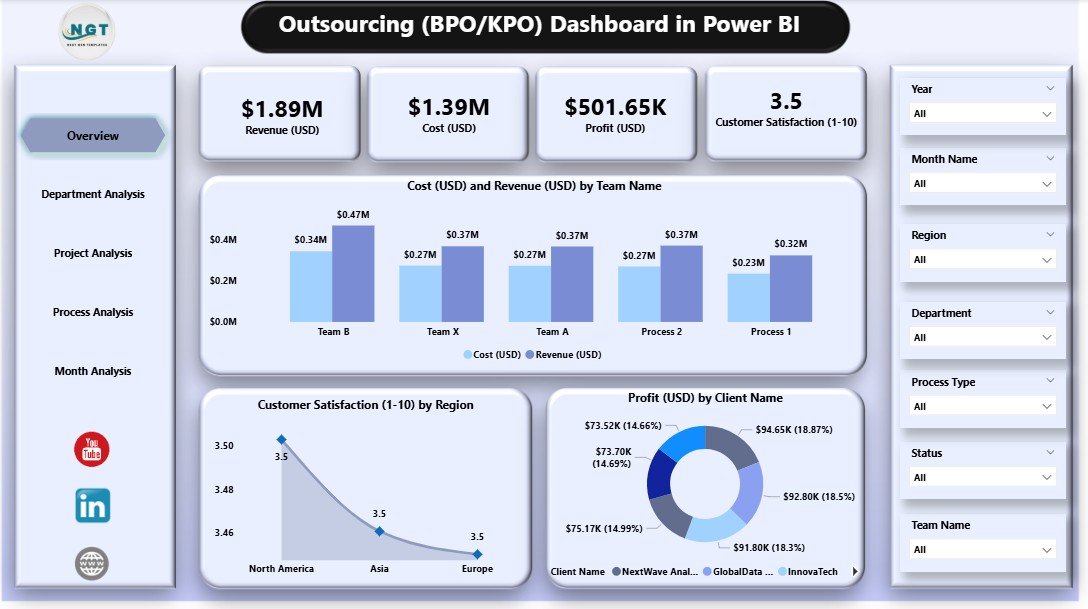
The Overview Page is designed for quick decision-making. It includes:
-
⭐ Four KPI Cards, showing:
-
Total Cost
-
Total Revenue
-
Total Profit
-
Customer Satisfaction Score
-
-
📊 Three Essential Charts:
-
Cost (USD) & Revenue (USD) by Team
-
Customer Satisfaction by Region
-
Profit (USD) by Client
-
With interactive slicers for team, month, department, client, and process type, leaders identify issues and opportunities instantly.
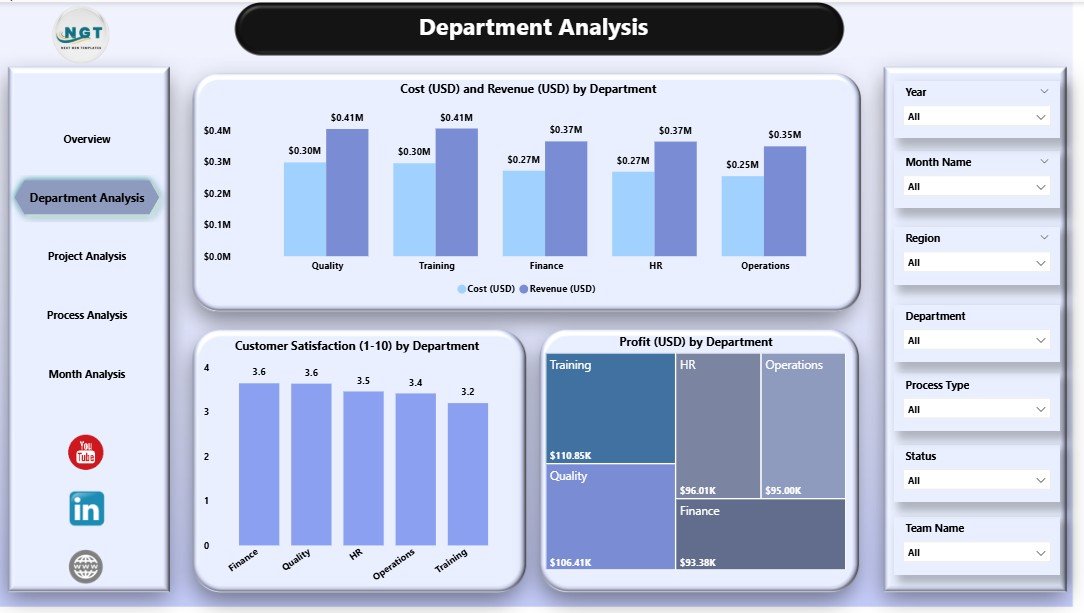
2️⃣ Department Analysis Page – Compare All Departments Clearly
Departments like Customer Support, Finance Operations, IT Support, Research, Data Processing, and Analytics perform differently. This page helps you compare them side by side.
Includes three department-focused visuals:
-
Cost (USD) & Revenue (USD) by Department
-
Customer Satisfaction by Department
-
Profit (USD) by Department
This page helps managers identify strong departments and improvement areas.
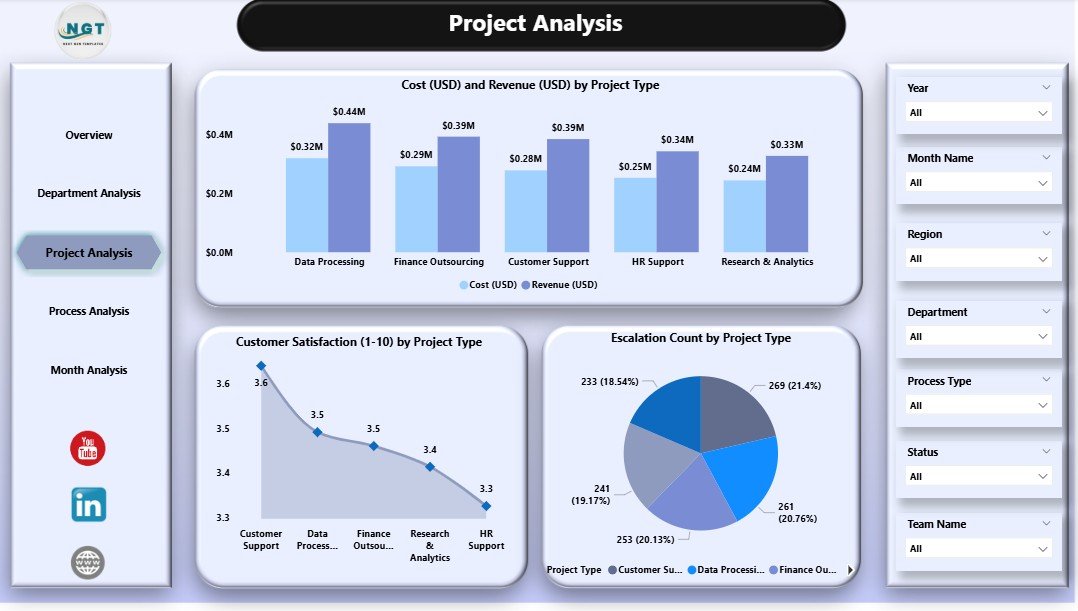
3️⃣ Product (Project Type) Analysis Page – Understand Which Services Perform Best
Outsourcing companies handle multiple service types. This page helps analyze performance by project/service category.
Contains:
-
Cost (USD) & Revenue (USD) by Project Type
-
Customer Satisfaction by Project Type
-
Escalation Count by Project Type
You quickly learn which services are profitable and which ones require process improvement.
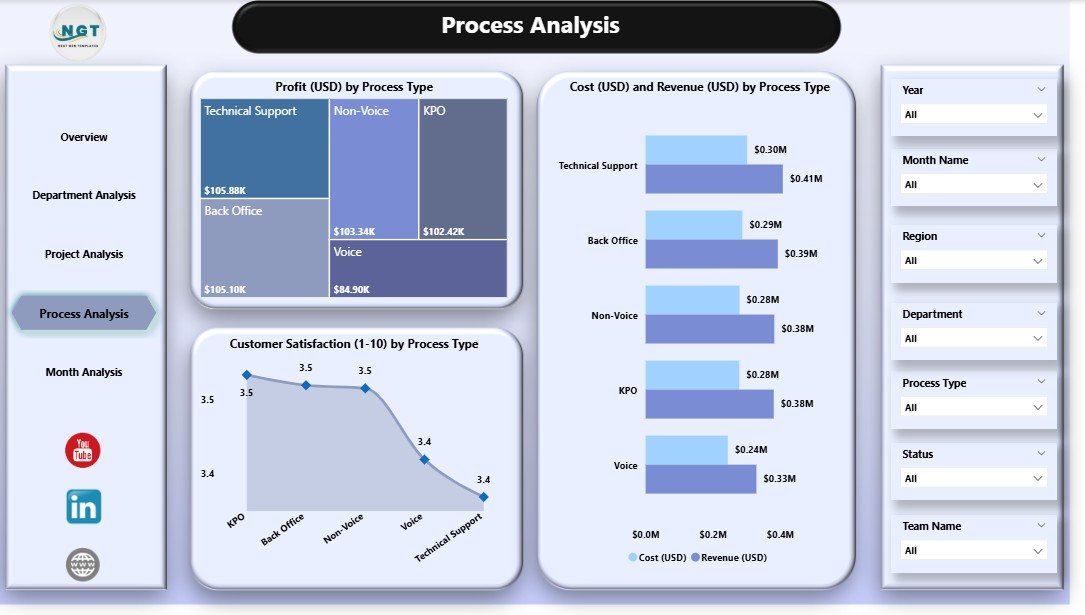
4️⃣ Process Analysis Page – Improve Operational Efficiency
Every outsourcing workflow follows multiple processes. This page shows:
-
Cost (USD) & Revenue (USD) by Process Type
-
Customer Satisfaction by Process Type
-
Profit (USD) by Process Type
This helps identify bottlenecks, low-performing processes, and high-value workflows.
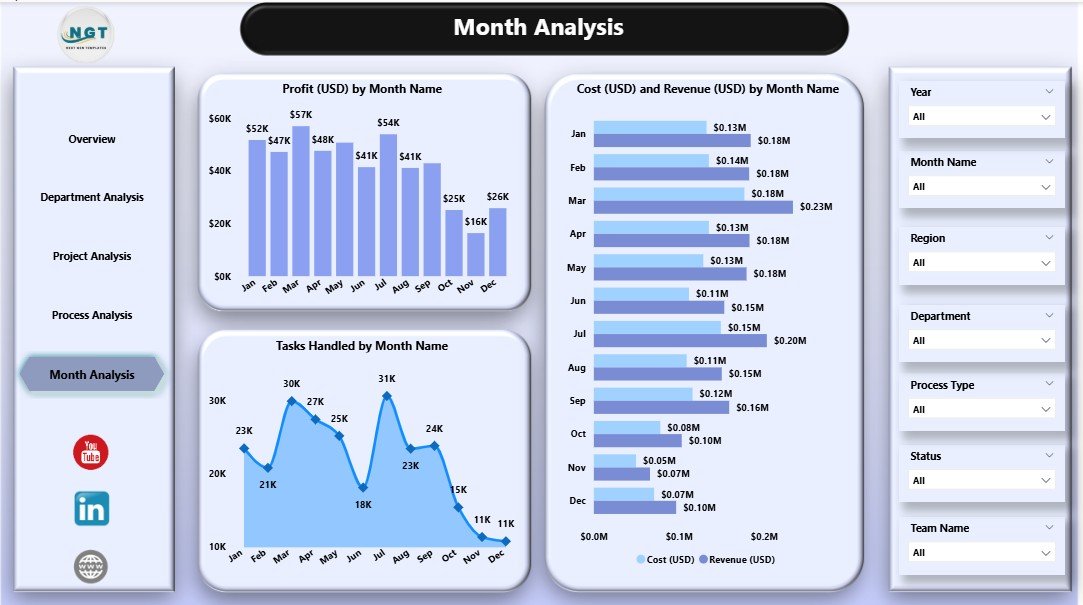
5️⃣ Monthly Trends Page – Track Performance Over Time
This page helps leaders understand how performance changes monthly.
Includes:
-
Cost (USD) & Revenue (USD) by Month
-
Profit (USD) by Month
-
Tasks Handled by Month
These insights support workload planning, budgeting, staffing, and forecasting.
🧩 How to Use the Outsourcing (BPO KPO) Dashboard
Using the dashboard is simple:
-
Update data in Excel, CRM logs, or your database
-
Refresh the Power BI report
-
Apply filters (team, month, client, department, process type, region)
-
View real-time insights instantly
No technical skills required—just basic Power BI navigation.
👥 Who Can Benefit from This Dashboard?
-
BPO Managers
-
KPO Managers
-
Client Managers
-
Operations Heads
-
Finance Teams
-
Workforce & Capacity Planners
-
Quality Assurance Teams
-
Senior Management
This dashboard fits call centers, research units, analytics teams, shared-service centers, and outsourcing companies of all sizes.
💡 Why This Dashboard Is a Game-Changer
-
Real-time decision-making
-
Clear visibility across teams, clients & processes
-
Faster root-cause identification
-
Higher profitability through better tracking
-
Improved customer satisfaction
-
Zero manual reporting
-
Professional visuals for client review meetings
-
Helps plan staffing, workload, and budgets
The dashboard brings complete transparency and helps you run operations with confidence.
### Click hare to read the Detailed blog post
Visit our YouTube channel to learn step-by-step video tutorials
👉 Youtube.com/@PKAnExcelExpert


Reviews
There are no reviews yet.