Managing outsourced accounting services requires accurate performance monitoring, transparency, and data-driven decision-making. Accounting outsourcing companies handle critical financial processes such as accounts payable, accounts receivable, payroll processing, bookkeeping, tax preparation, financial reporting, and compliance monitoring.
However, many organizations still rely on scattered spreadsheets and manual reports. As a result, managers often struggle to track productivity, measure service quality, and evaluate whether outsourced teams meet performance targets.
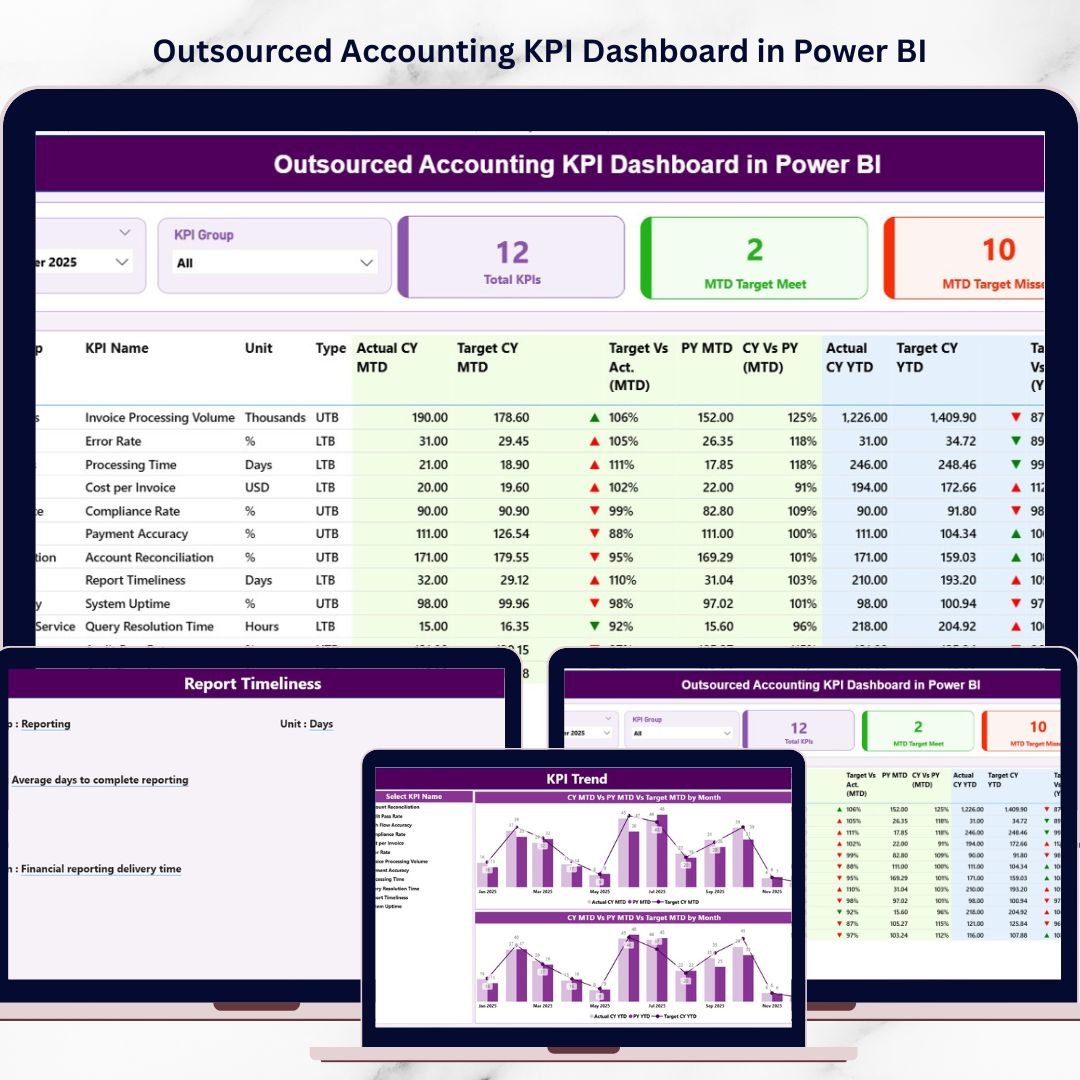
This is where the Outsourced Accounting KPI Dashboard in Power BI becomes an extremely valuable business intelligence solution.
The Outsourced Accounting KPI Dashboard in Power BI is an interactive analytics tool that converts complex accounting data into clear visual insights. It enables finance leaders, CFOs, outsourcing firms, and business owners to track performance metrics, monitor service quality, and analyze accounting operations using dynamic dashboards.
Because Power BI provides interactive charts, slicers, drill-through analysis, and automated data refresh, organizations can easily transform raw accounting data into meaningful insights.
As a result, decision-makers gain complete visibility into outsourced accounting operations, allowing them to improve productivity and maintain financial accuracy.
📊 Key Feature of Outsourced Accounting KPI Dashboard in Power BI
This dashboard provides powerful analytics capabilities designed to monitor outsourced accounting performance effectively.
📈 Centralized KPI Monitoring – Track all outsourced accounting performance indicators in one dashboard.
📊 Target vs Actual Performance Analysis – Compare current results with defined KPI targets.
📅 Month-to-Date (MTD) and Year-to-Date (YTD) Tracking – Monitor both short-term and long-term performance metrics.
📉 Performance Status Indicators – Green and red icons highlight achieved and missed targets instantly.
📊 KPI Trend Visualization – Analyze performance changes over time using dynamic trend charts.
📂 Structured KPI Definition System – View detailed KPI definitions, formulas, and categories.
🔎 Interactive Filters and Slicers – Analyze performance by KPI group or month.
📊 Historical Performance Comparison – Compare current results with previous year performance.
⚡ Real-Time Power BI Analytics – Refresh data to instantly update all KPIs and charts.
These features help finance teams monitor outsourced accounting operations efficiently and identify performance gaps quickly.
📦 What’s Inside the Outsourced Accounting KPI Dashboard in Power BI
The dashboard contains three analytical pages, each designed to monitor KPI performance from different perspectives.
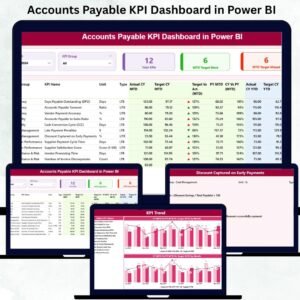
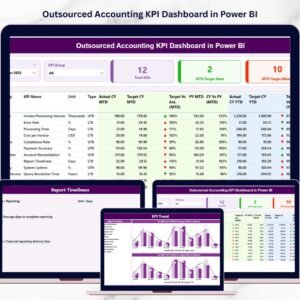
Summary Page – Main KPI Monitoring Dashboard
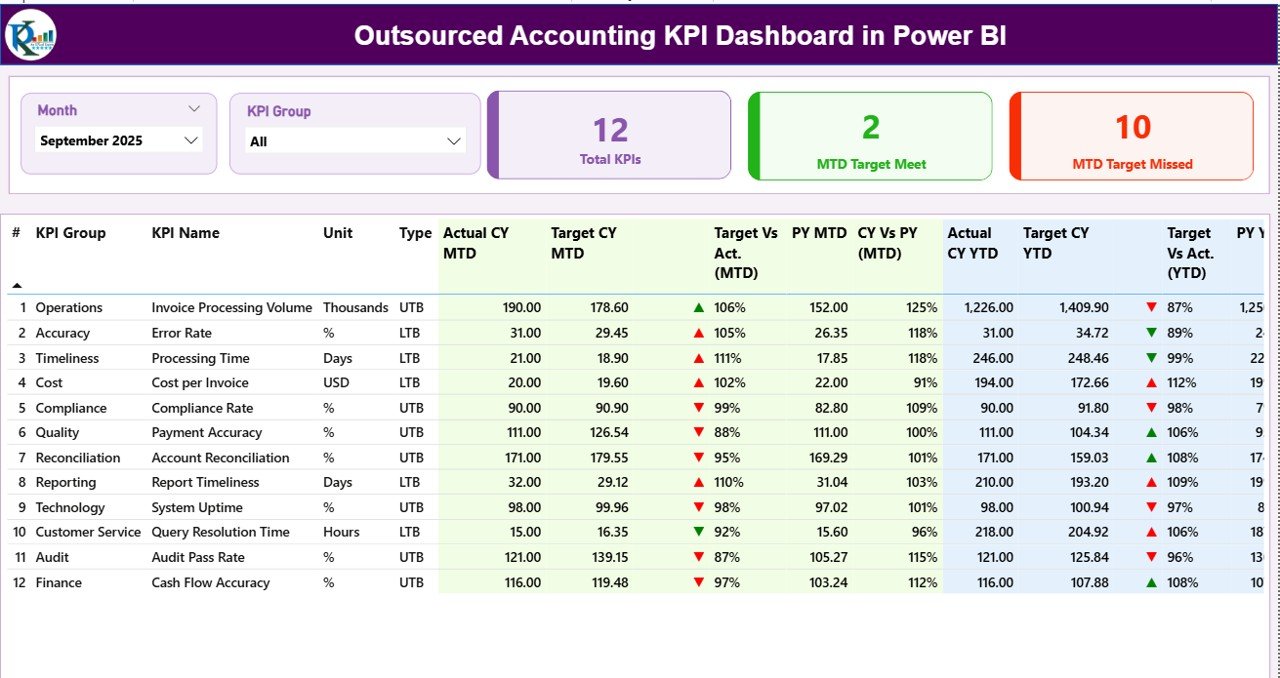
The Summary Page acts as the central control panel of the dashboard.
This page provides a complete overview of outsourced accounting performance.
Available Slicers
Users can filter the dashboard using:
• Month
• KPI Group
These slicers allow managers to analyze specific time periods or KPI categories.
KPI Performance Cards
The dashboard includes three important KPI cards:
📊 Total KPIs Count – Total number of KPIs tracked in the dashboard.
📈 MTD Target Meet Count – Number of KPIs that achieved their monthly targets.
📉 MTD Target Missed Count – Number of KPIs that failed to meet monthly targets.
These KPI cards help managers instantly evaluate overall accounting performance.
Detailed KPI Performance Table
Below the KPI cards, the dashboard includes a detailed KPI table with several analytical fields.
Key columns include:
• KPI Number
• KPI Group
• KPI Name
• Unit of Measurement
• KPI Type (LTB or UTB)
MTD Performance Metrics
The dashboard tracks Month-to-Date (MTD) metrics including:
• Actual CY MTD
• Target CY MTD
• MTD Performance Icon
• Target vs Actual (MTD)
• Previous Year MTD
• CY vs PY (MTD)
Visual icons help managers quickly identify whether targets are achieved.
YTD Performance Metrics
The dashboard also tracks Year-to-Date (YTD) performance metrics.
These include:
• Actual CY YTD
• Target CY YTD
• YTD Performance Icon
• Target vs Actual (YTD)
• Previous Year YTD
• CY vs PY (YTD)
These metrics help organizations analyze long-term accounting performance.
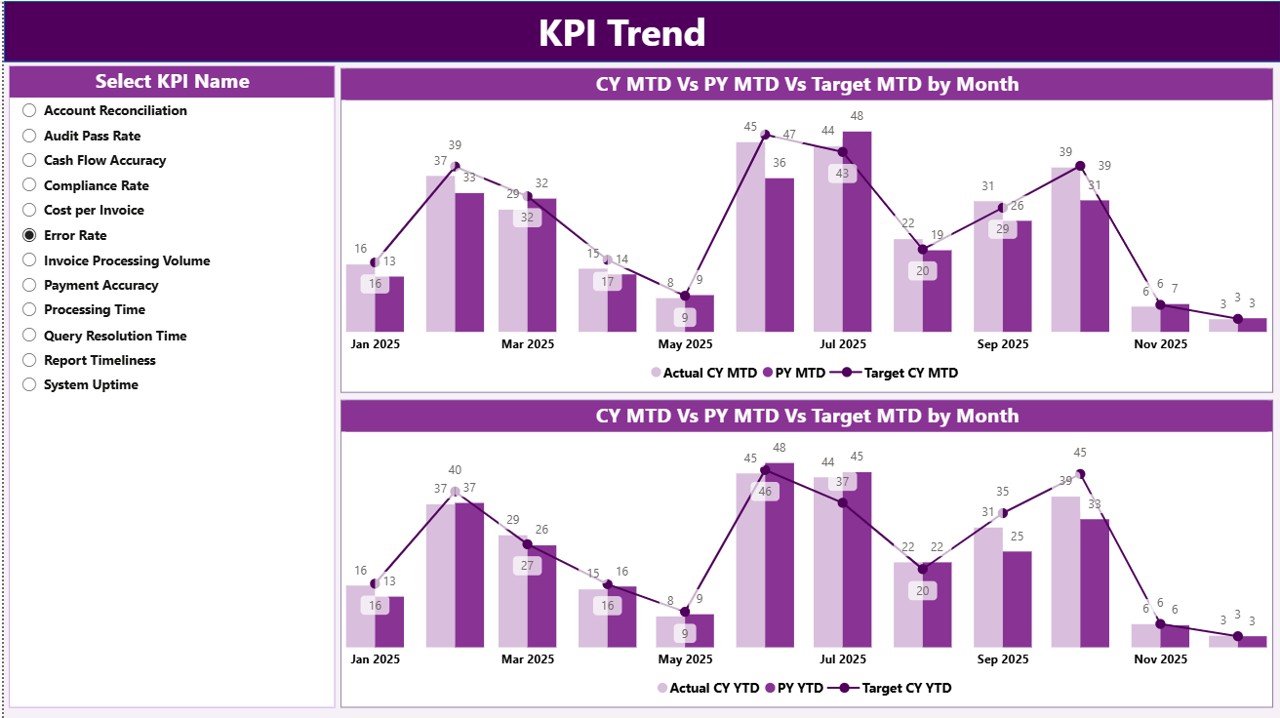
KPI Trend Page – KPI Performance Over Time
The KPI Trend Page helps managers analyze KPI performance trends.
Instead of reviewing static numbers, users can visualize performance changes using dynamic charts.
Charts Included
The page includes two combo charts:
📈 MTD Trend Chart – Displays Month-to-Date performance trends.
📊 YTD Trend Chart – Displays Year-to-Date performance trends.
Both charts compare:
• Current Year Actual Values
• Target Values
• Previous Year Values
KPI Selection Slicer
A slicer allows users to select a specific KPI.
Once selected, charts automatically update to display trend analysis for that KPI.
This feature allows managers to analyze performance patterns and detect issues quickly.
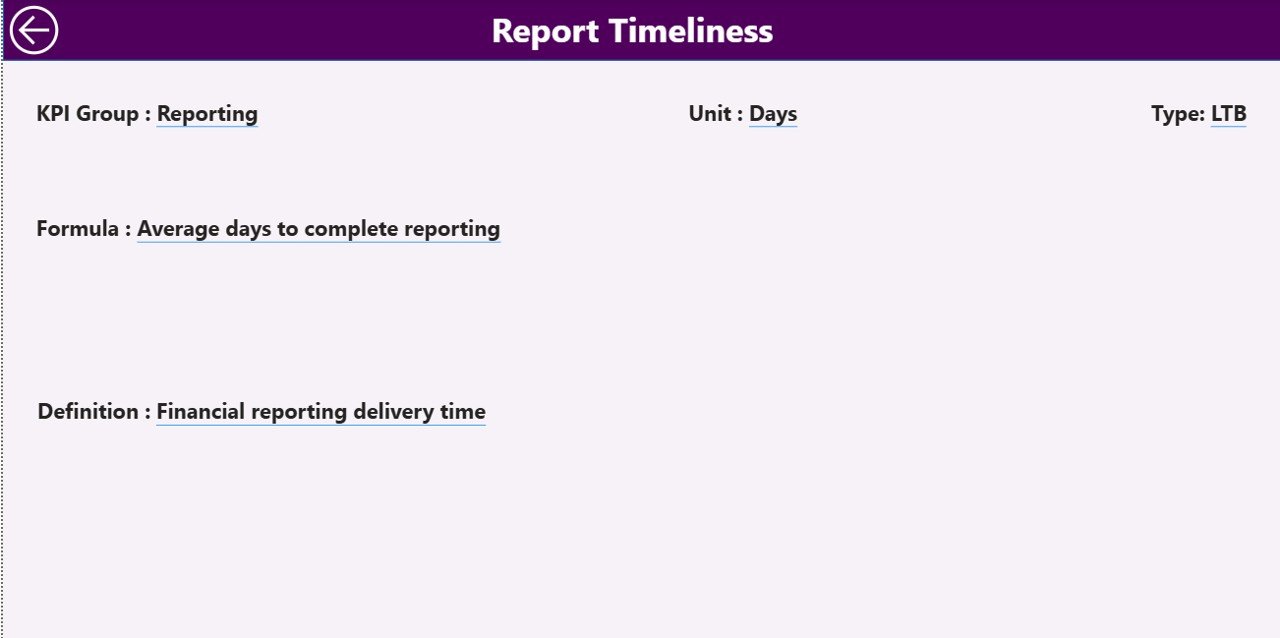
KPI Definition Page – KPI Explanation and Documentation
The KPI Definition Page provides detailed explanations of each KPI used in the dashboard.
This page acts as a drill-through analysis page.
Information displayed includes:
• KPI Number
• KPI Group
• KPI Name
• KPI Formula
• KPI Definition
• KPI Type (LTB or UTB)
A Back Button allows users to return to the main dashboard easily.
This documentation ensures all team members clearly understand KPI definitions.
⚙️ How to Use the Outsourced Accounting KPI Dashboard
Using the dashboard is simple and efficient.
1️⃣ Import accounting KPI data from Excel.
2️⃣ Connect the dataset to Power BI.
3️⃣ Refresh the dataset to update dashboard visuals.
4️⃣ Use slicers to filter data by month or KPI group.
5️⃣ Analyze charts and KPI indicators to evaluate performance.
Once the dataset refreshes, all dashboard insights update automatically.
👥 Who Can Benefit from This Dashboard
This dashboard is designed for professionals involved in accounting outsourcing and financial operations.
It is particularly useful for:
📊 Accounting Outsourcing Firms
💼 Finance Managers
📈 CFOs and Financial Controllers
🏢 Business Owners
📊 Financial Analysts
📑 BPO and KPO Companies
Because the dashboard provides operational and financial insights, it supports both strategic planning and operational monitoring.
💡 Advantages of Outsourced Accounting KPI Dashboard in Power BI
Organizations gain several important benefits by implementing this dashboard.
✔ Real-time accounting performance monitoring
✔ Improved transparency in outsourced accounting services
✔ Faster identification of underperforming KPIs
✔ Better financial accuracy monitoring
✔ Improved productivity tracking
✔ Faster and automated reporting
✔ Data-driven financial decision-making
Instead of relying on manual reports, organizations can use interactive Power BI dashboards to monitor outsourced accounting performance efficiently.
This dashboard transforms complex accounting data into clear insights that improve operational efficiency and service quality.
### Click here to read the Detailed blog post
Visit our YouTube channel to learn step-by-step video tutorials
https://youtube.com/@PKAnExcelExpert