
Outlet stores run on speed—speed of selling, speed of restocking, speed of hitting targets, and speed of reacting to competitors. But here’s the reality: many retail teams still rely on scattered Excel sheets and manual reporting. That’s where profit leaks quietly. When performance gaps stay hidden, decisions come late, and targets get missed before you even realize there’s a problem.
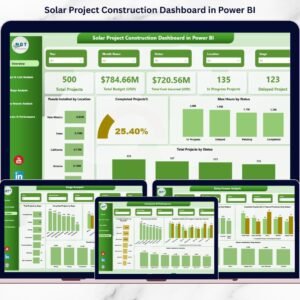
That’s why we built the Outlet Stores Dashboard in Power BI 🏬📊
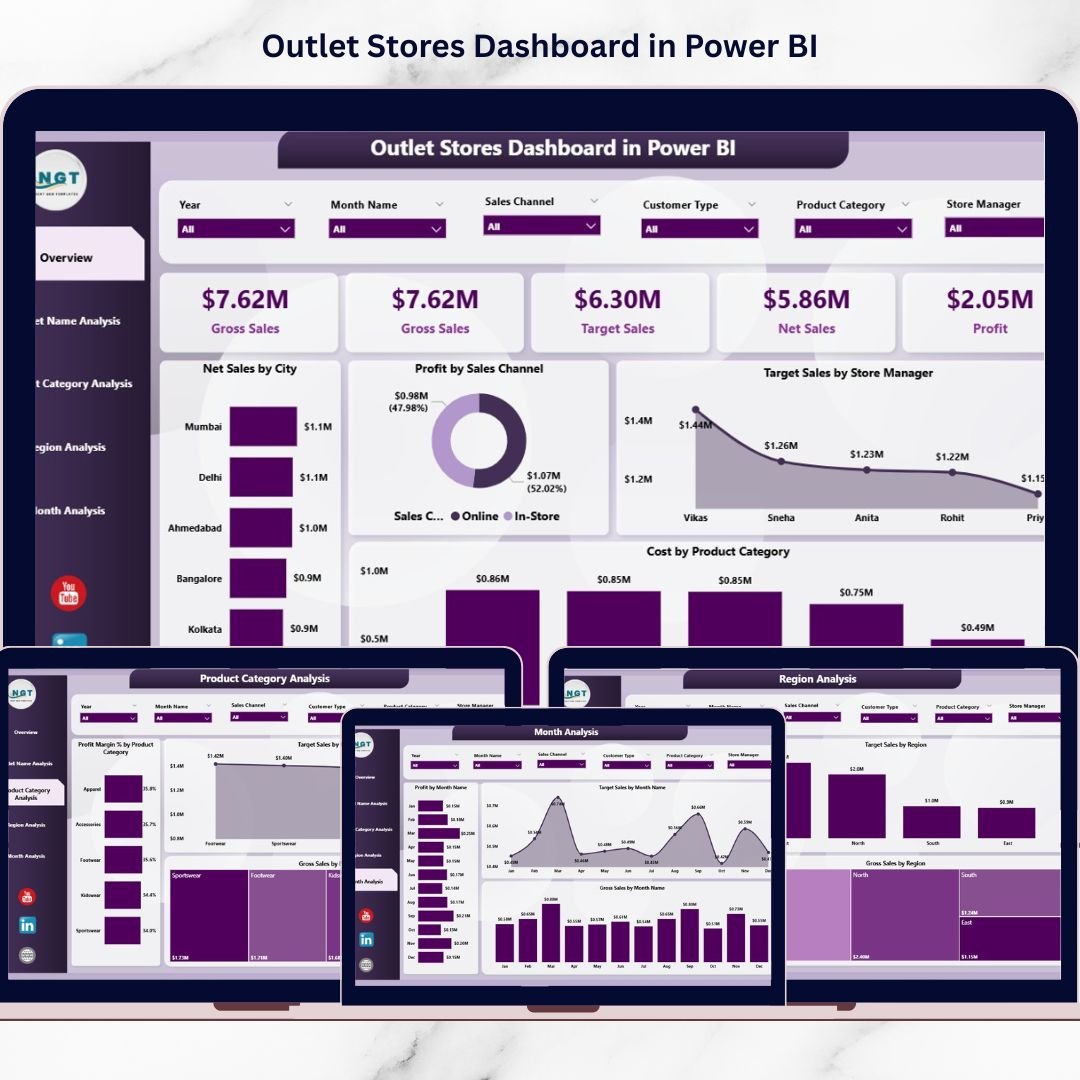
It’s a ready-to-use, interactive analytics solution that brings your retail KPIs into one powerful platform—so you can track Net Sales, Gross Sales, Profit, Costs, Profit Margin %, and Target Achievement across outlets, product categories, regions, sales channels, and months.
Instead of reading multiple reports, you get a single dashboard that answers the questions every retail leader asks daily:
-
Which outlets are performing best?
-
Where are targets being missed?
-
Which categories generate profit (not just sales)?
-
Which regions are growing—and which are struggling?
-
What’s happening month-by-month, and where are trends heading?
With slicers, filters, and interactive visuals, Power BI makes outlet analytics simple, fast, and decision-ready—even for non-technical users.
Key Feature of Outlet Stores Dashboard in Power BI
🚀 Ready-to-use Power BI dashboard built for outlet store performance tracking
🎛️ Interactive slicers to filter data instantly by time, region, outlet, category, and more
📌 Five KPI cards for quick executive-level performance visibility
📈 Actual vs Target monitoring to keep teams accountable and results-focused
💰 Profit + Profit Margin % insights to reveal true business performance
🏬 Outlet-wise store comparison to identify top outlets and weak locations fast
📦 Product category analytics to highlight profit-driving and low-margin categories
🌍 Region performance analysis for smarter resource allocation and expansion planning
📅 Monthly trend tracking to detect seasonality and campaign impact
🔄 Fast refresh + centralized reporting to reduce manual work and errors
What’s Inside the Outlet Stores Dashboard in Power BI
This dashboard includes five analytical pages, each designed to answer a specific retail question:
📌 1) Overview Page (Complete Business Snapshot)
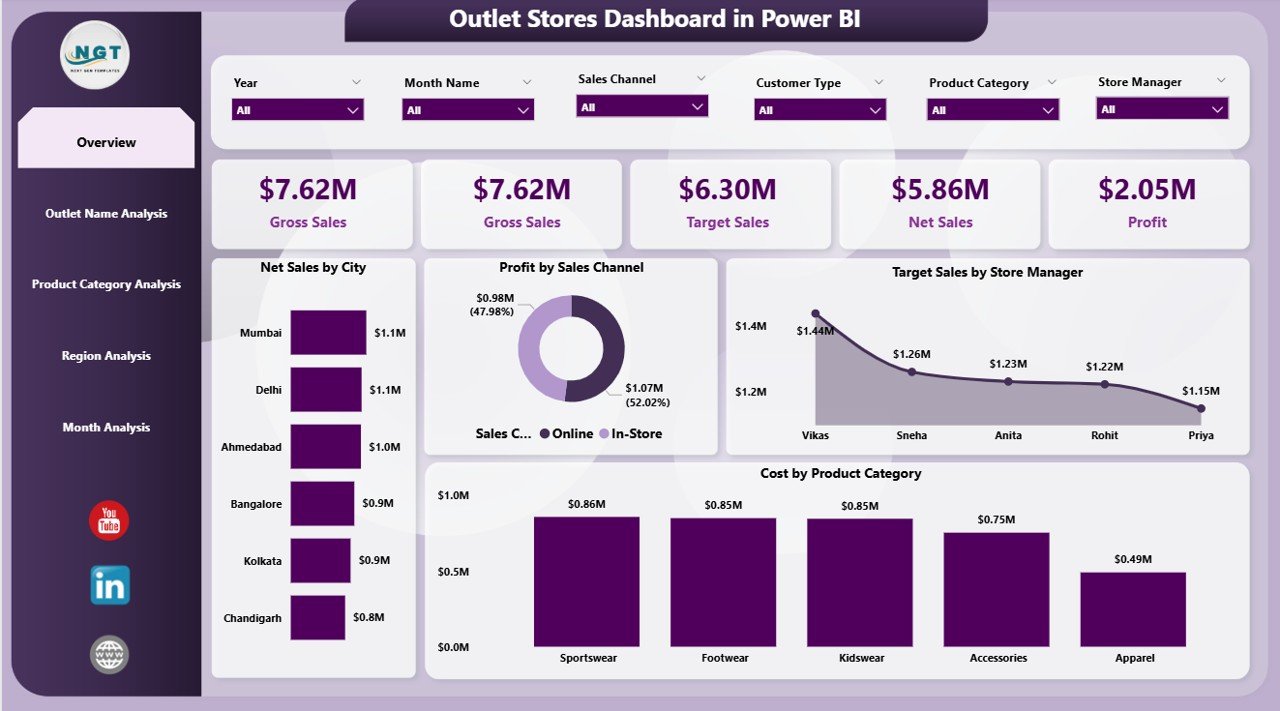
Your main control center with interactive slicers, KPI cards, and high-impact visuals such as:
-
Net Sales by City
-
Profit by Sales Channel
-
Target Sales by Store Manager
-
Cost by Product Category
-
Summary KPI cards (quick performance pulse)
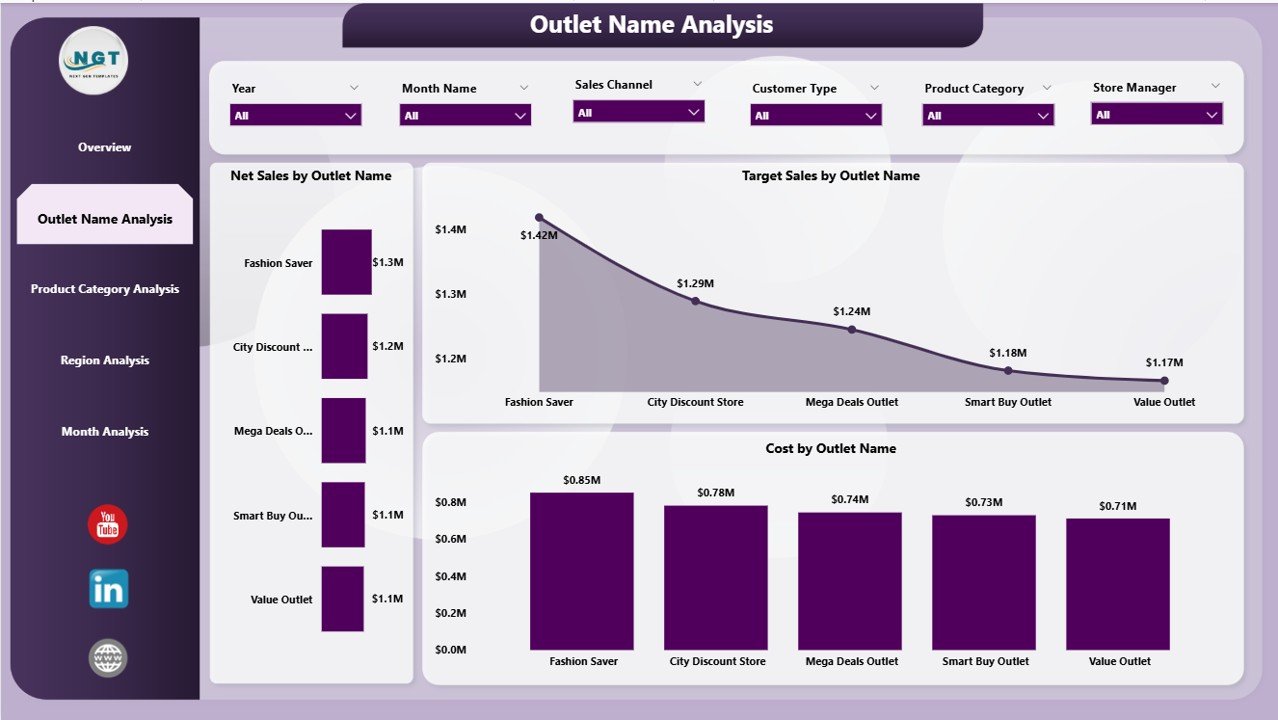
🏬 2) Outlet Name Analysis (Store Performance Comparison)
Compare outlets quickly and identify target gaps and cost-heavy locations:
-
Net Sales by Outlet Name
-
Target Sales by Outlet Name
-
Cost by Outlet Name
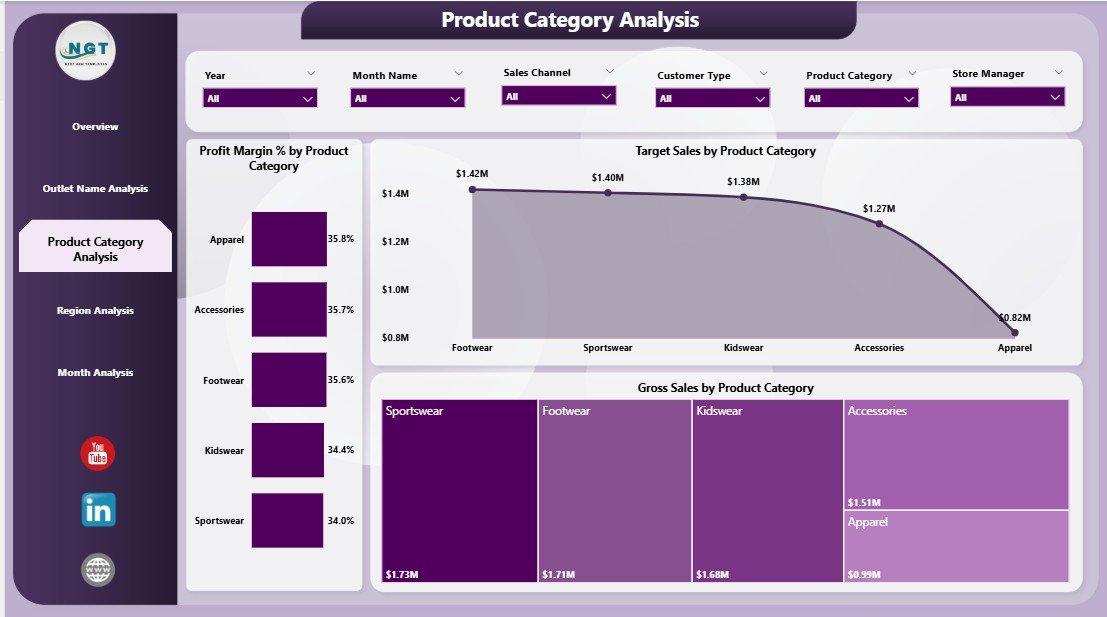
📦 3) Product Category Analysis (Product Performance & Margin)
Know which categories deserve investment—and which need pricing or promotion fixes:
-
Profit Margin % by Product Category
-
Target Sales by Product Category
-
Gross Sales by Product Category
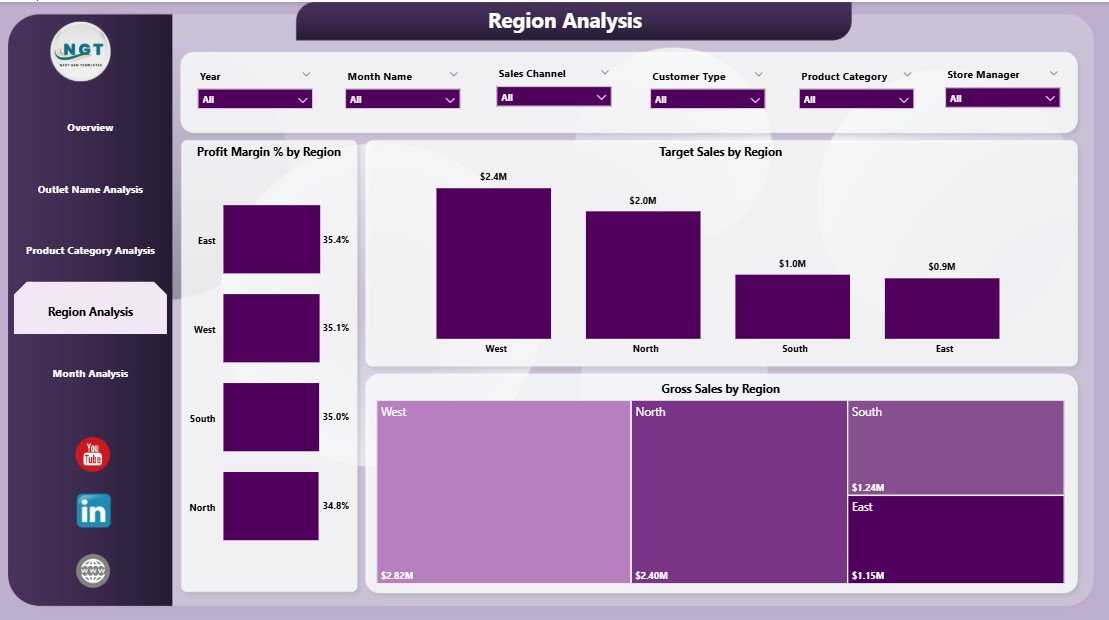
🌍 4) Region Analysis (Geographic Performance)
Measure regional demand and profitability to plan smarter:
-
Profit Margin % by Region
-
Target Sales by Region
-
Gross Sales by Region
📅 5) Month Analysis (Trends Over Time)
Track business trends and seasonality with:
-
Profit by Month
-
Target Sales by Month
-
Gross Sales by Month
Together, these pages provide full visibility across outlet operations—without overwhelming users.
How to Use the Outlet Stores Dashboard in Power BI
You don’t need advanced Power BI skills to use this dashboard:
1️⃣ Collect your outlet data (sales, costs, targets, outlet names, categories, regions, dates, etc.)
2️⃣ Import the data into Power BI (Excel and databases work perfectly)
3️⃣ Refresh the dashboard to update visuals instantly
4️⃣ Use slicers and filters to analyze by region, outlet, category, channel, and time
5️⃣ Take action faster by spotting target misses, low-margin categories, and weak outlets before they become bigger problems
Who Can Benefit from This Outlet Stores Dashboard in Power BI
This dashboard is ideal for:
🏬 Retail Owners & Multi-Outlet Chains
👨💼 Store Managers & Outlet Supervisors
🌍 Regional Managers
📊 Retail Analysts & MIS Teams
💰 Finance & Profitability Teams
🧠 Operations Executives
🤝 Retail Consultants
If you want a clean, centralized view of performance with fast insights, this dashboard is built for your day-to-day decisions.
Click hare to read the Detailed blog post
Visit our YouTube channel to learn step-by-step video tutorials
Youtube.com/@PKAnExcelExpert