Organic farming is no longer just about growing crops naturally—it is about balancing profitability, sustainability, and cost efficiency. Farmers, agribusiness owners, cooperatives, and policymakers must continuously monitor fertilizer costs, irrigation expenses, soil performance, revenue, profit margins, and seasonal trends. When this data remains scattered in spreadsheets or manual reports, it becomes difficult to see the full picture. This is exactly why an Organic Farming Dashboard in Power BI is a transformative solution for modern organic agriculture.
The Organic Farming Dashboard in Power BI is a ready-to-use, interactive analytics solution that transforms raw farm data into clear visuals and actionable insights. Instead of spending hours compiling reports, users gain instant visibility into performance through smart KPIs, charts, and slicers. Powered by Power BI and supported by Excel data, this dashboard makes farm performance transparent, measurable, and easy to optimize—without the need for technical expertise.
With real-time analytics, dynamic filtering, and visually engaging reports, this dashboard enables better decisions at every level—from farm operations to strategic planning. Whether you manage a single organic farm or oversee operations across regions, this dashboard provides clarity and confidence.
✨ Key Features of the Organic Farming Dashboard in Power BI
This professionally designed dashboard includes five powerful analytical pages, each focusing on a critical aspect of organic farming performance.
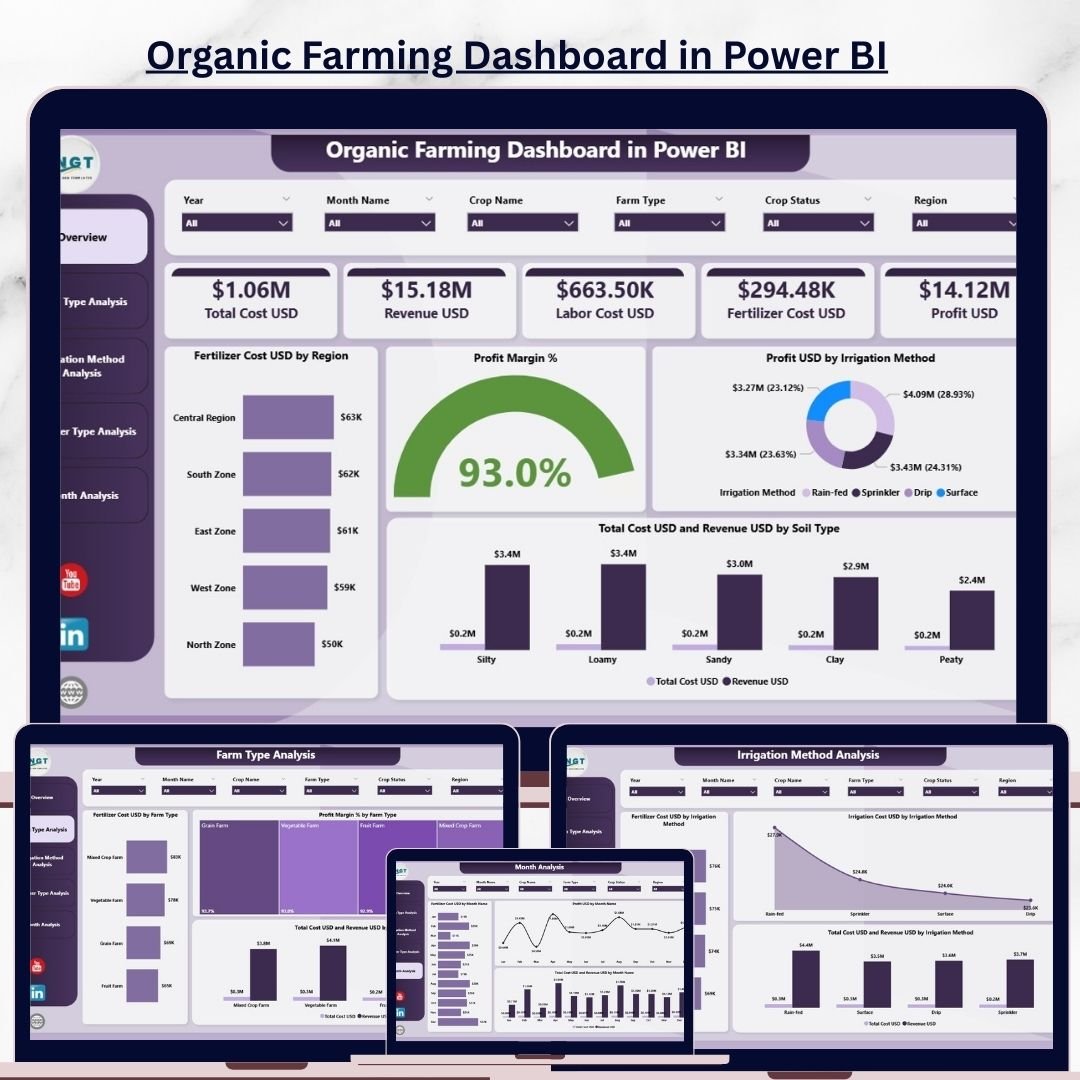
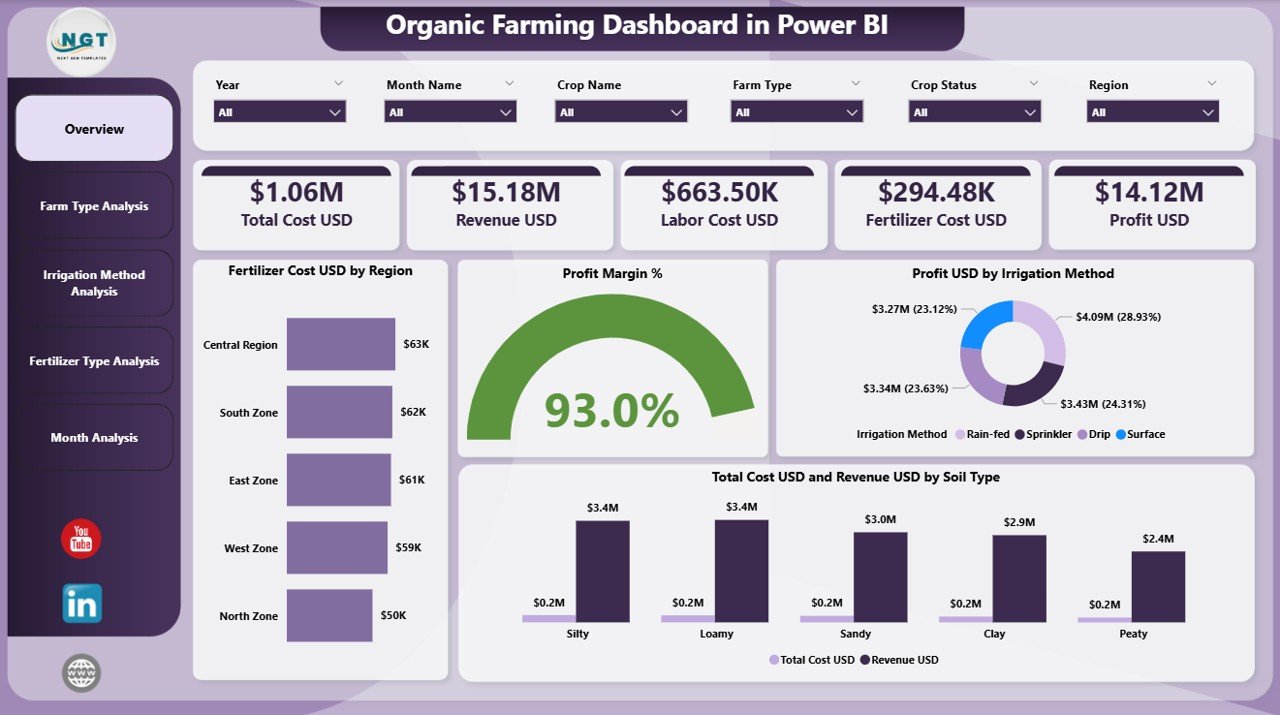
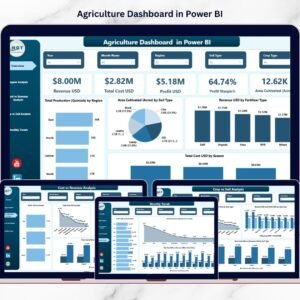
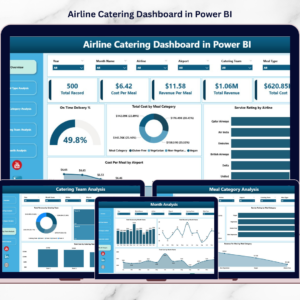
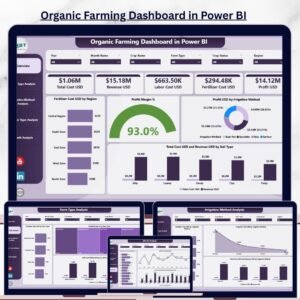
⭐ Overview Page – Complete Farm Performance Snapshot
✔ Interactive slicers for Region, Farm Type, Soil Type, and Time
✔ Four KPI cards showing:
-
Total Revenue USD
-
Total Cost USD
-
Profit USD
-
Profit Margin %
✔ Four essential charts:
-
Fertilizer Cost USD by Region
-
Profit Margin % by Region
-
Profit USD by Irrigation Method
-
Total Cost USD & Revenue USD by Soil Type
This page delivers instant clarity on financial health and operational efficiency.
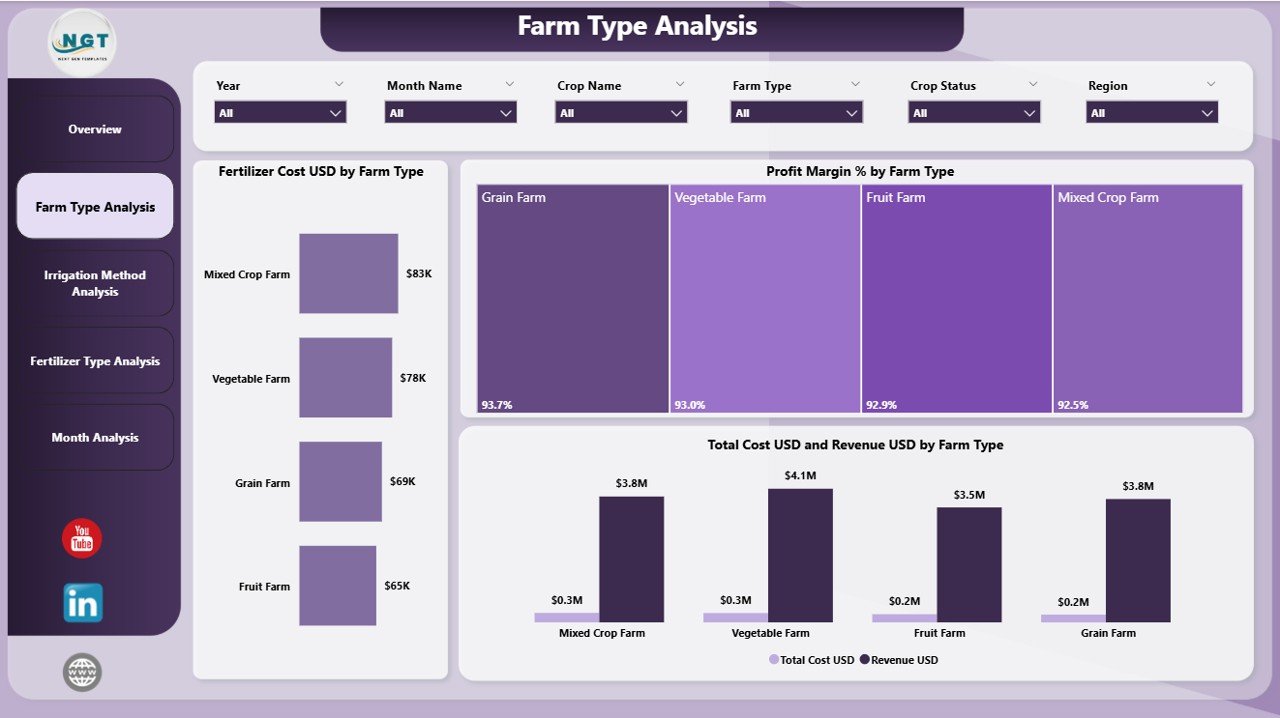
⭐ Farm Type Analysis Page – Compare Different Farming Models
✔ Fertilizer Cost by Farm Type
✔ Profit Margin % by Farm Type
✔ Total Cost USD & Revenue USD by Farm Type
This page helps identify which organic farm types perform best and deserve expansion.
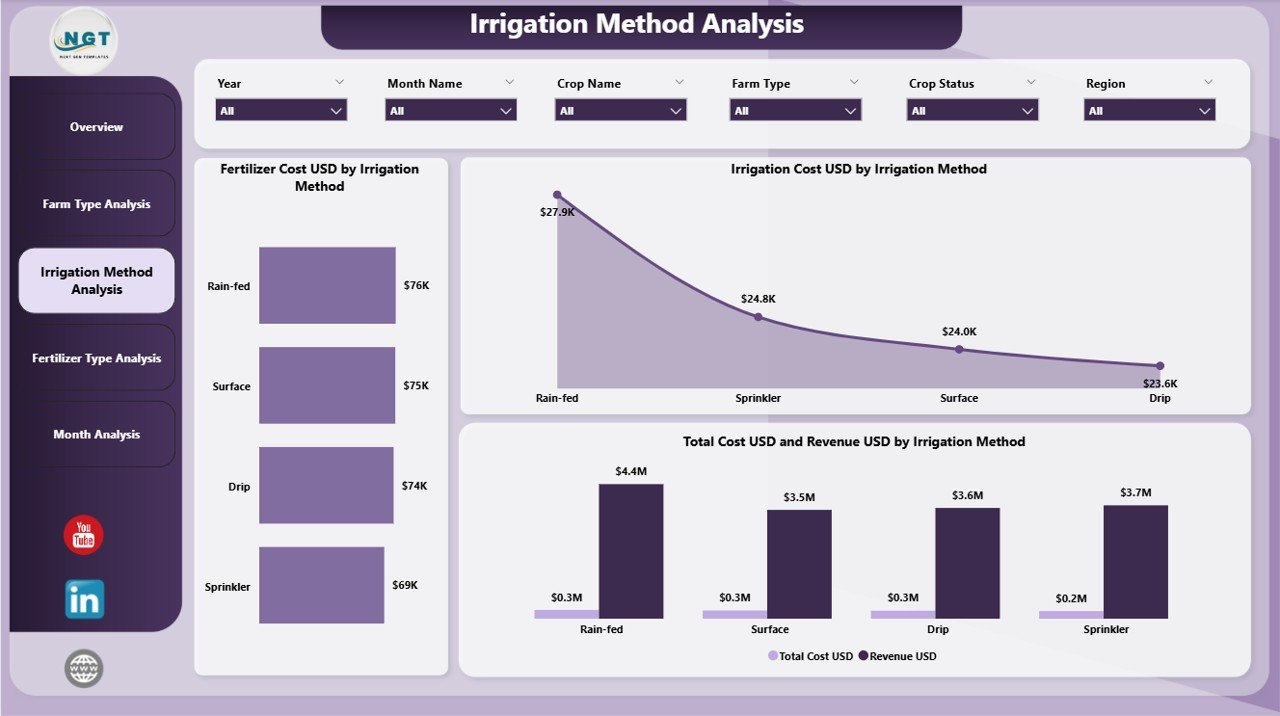
⭐ Irrigation Method Analysis Page – Optimize Water Usage
✔ Fertilizer Cost USD by Irrigation Method
✔ Irrigation Cost USD by Irrigation Method
✔ Total Cost USD & Revenue USD by Irrigation Method
This analysis highlights cost-efficient and sustainable irrigation practices.
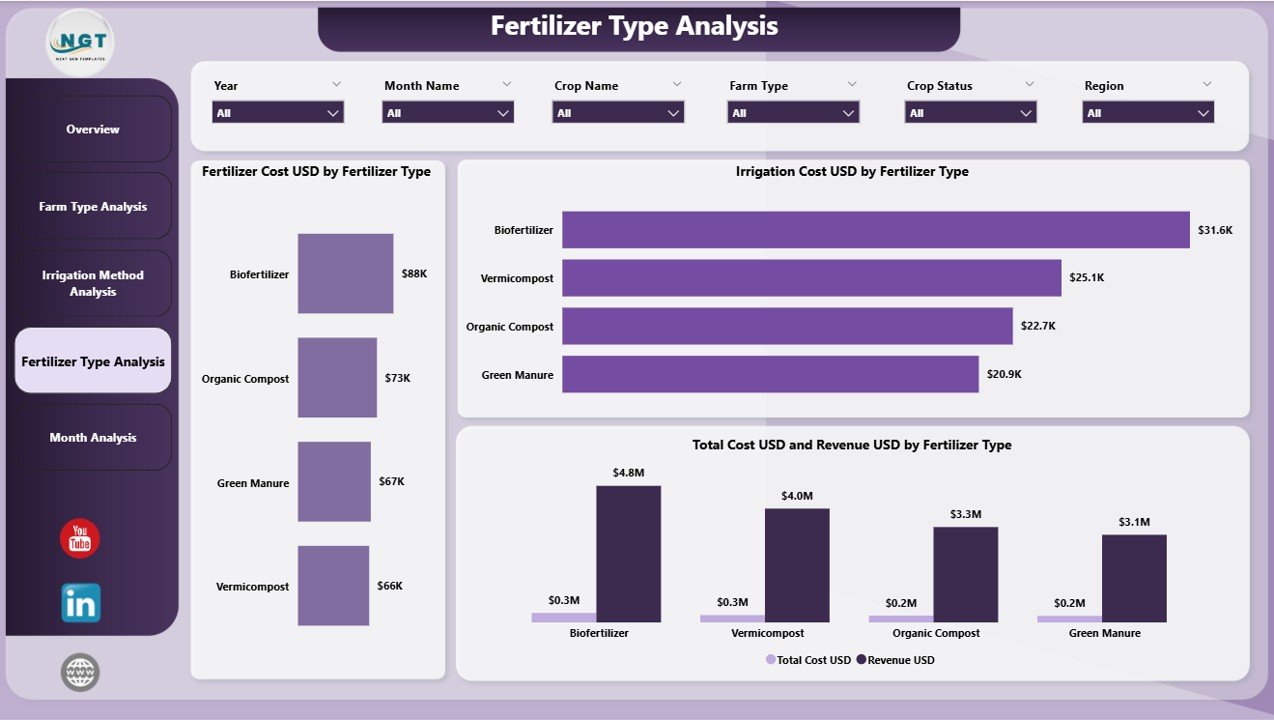
⭐ Fertilizer Type Analysis Page – Maximize Input Efficiency
✔ Fertilizer Cost USD by Fertilizer Type
✔ Irrigation Cost USD by Fertilizer Type
✔ Total Cost USD & Revenue USD by Fertilizer Type
Farmers can clearly evaluate return on investment for different organic fertilizers.
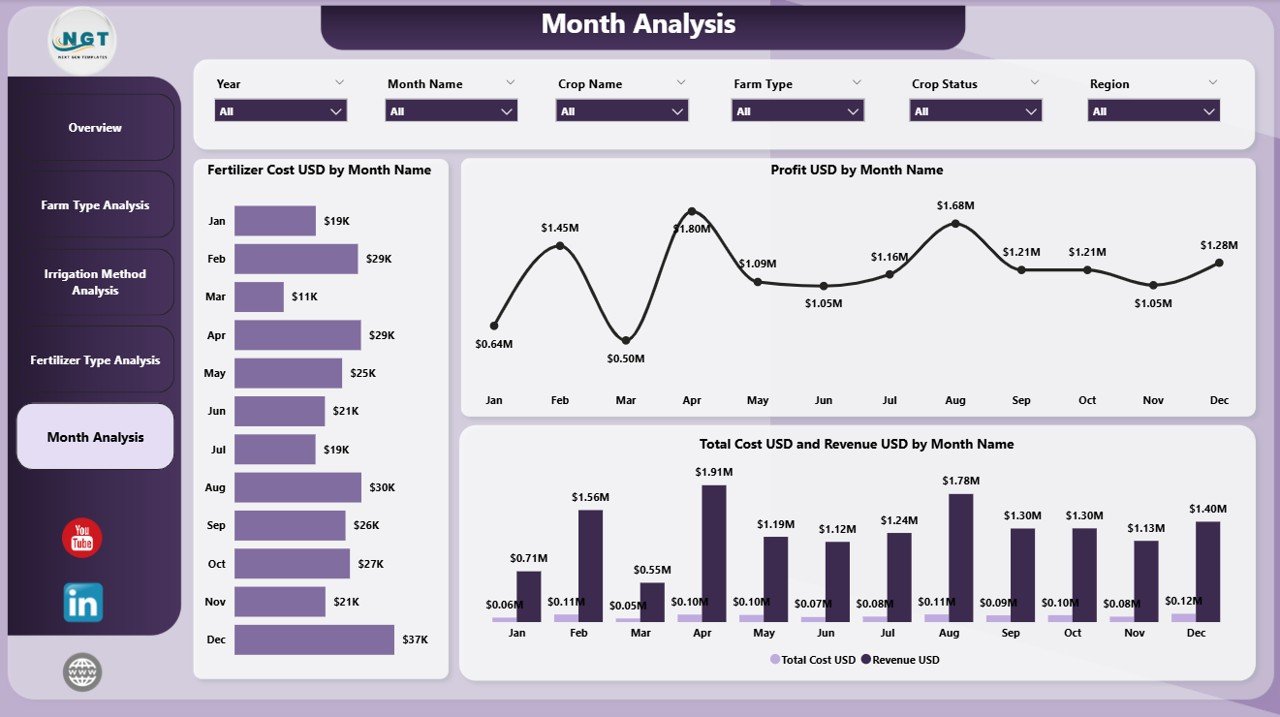
⭐ Monthly Trends Page – Understand Seasonality
✔ Fertilizer Cost USD by Month
✔ Profit USD by Month
✔ Total Cost USD & Revenue USD by Month
This page supports forecasting, budgeting, and long-term planning.
📦 What’s Inside the Organic Farming Dashboard in Power BI
When you download this product, you receive:
✨ A Power BI dashboard file (.pbix)
✨ Five fully interactive analytics pages
✨ KPI cards and dynamic visuals
✨ Slicers for deep analysis by region, type & time
✨ Excel-based data source for easy updates
✨ Scalable design for small and large farms
Everything is structured for simplicity, accuracy, and performance.
🛠️ How to Use the Organic Farming Dashboard in Power BI
1️⃣ Maintain your farming data in Excel or a database
2️⃣ Connect or refresh the data in Power BI
3️⃣ Open the dashboard pages
4️⃣ Use slicers to filter by region, farm type, soil, irrigation, or time
5️⃣ Analyze KPIs, charts, and trends
6️⃣ Identify cost-saving and profit-improving opportunities
You do not need advanced Power BI knowledge—basic refresh steps are enough.
👥 Who Can Benefit from This Organic Farming Dashboard in Power BI
This dashboard is ideal for:
✔ Organic farmers & farm owners
✔ Agribusiness companies
✔ Agricultural consultants
✔ Cooperative societies
✔ Sustainability and ESG teams
✔ Policymakers & researchers
✔ Investment & planning teams
It works equally well for operational review and strategic decision-making.
### 📘 Click here to read the Detailed blog post
🎥 Visit our YouTube channel to learn step-by-step video tutorials
👉 Youtube.com/@PKAnExcelExpert


Reviews
There are no reviews yet.